Committee of the Whole/Documents/Regional context / Scenario descriptions / Choices - 2022 Tax Rate Options
Presentation
Regional context / Scenario descriptions / Choices - 2022 Tax Rate Options
April 12, 2022Pages 163–1719 sections
A presentation outlining municipal tax rate scenarios for 2022, comparing View Royal to other regional municipalities and showing the impact of 4.7% and 5.5% tax increases.
Residential assessment increase: 23.54%Business assessment increase: 5.71%Scenario A and E focus on changing all tax ratesRecommendation for Council to determine municipal tax rates for 2022
Regional context
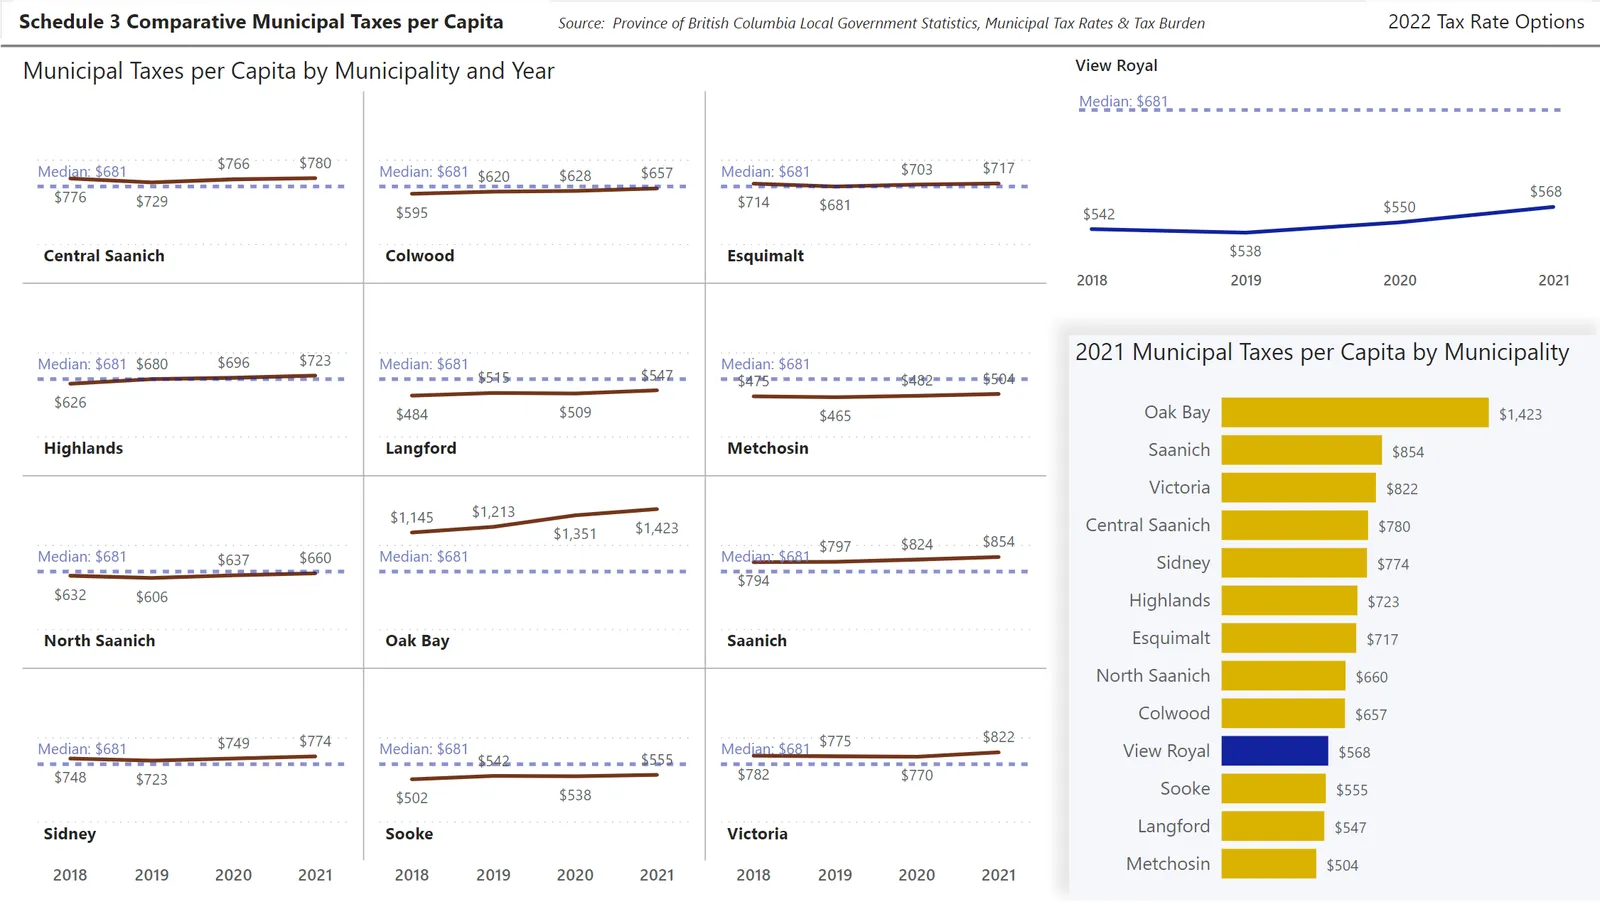
Schedule 3 Comparative Municipal Taxes per Capita
Source: Province of British Columbia Local Government Statistics, Municipal Tax Rates & Tax Burden
Page 163–171
Scenario descriptions (4.7%)
| Scenario | What changes | By how much | What stays the same |
|---|---|---|---|
| A | Change tax rates | All rates | Decrease 12.02% |
| B | Change total contribution | Tax ratios for all property classes | Different for each class; enough so total contribution changes by same percentage |
| C | Decrease Class 5 and Class 6 ratios | Tax ratios for: 5-Light Industry 6-Business |
3.3385 to 3.1000 3.6933 to 3.3000 |
| D | Increase Class 8 ratio | Tax ratio for: 8-Recreation/NP |
5.1 to 6.0 |
Page 163–171
Scenario descriptions (5.5%)
| Scenario | What changes | By how much | What stays the same |
|---|---|---|---|
| E | Change tax rates | All rates | Decrease 11.31% |
| F | Increase Class 8 ratio | Tax ratio for: 8-Recreation/NP |
5.1 to 6.0 |
Page 163–171
Scenario results
Schedule 5 Summary of impact on prior year $100,000 property value, adjusted for current year market change
| Property Class | Residential | Business |
|---|---|---|
| Change in representative property assessment | 23.54% | 5.71% |
| Scenario A and E | [Orange frowning icon] | [Orange frowning icon] |
| Scenario B | [Green smiling icon] | [Red angry icon] |
| Scenario C | [Red angry icon] | [Green smiling icon] |
| Scenario D and F | [Yellow neutral icon] | [Yellow neutral icon] |
Page 163–171
Scenario results
Schedule 5 Summary of impact on prior year $100,000 property value, adjusted for current year market change
| Property Class | Light Industry | Business | Recreation |
|---|---|---|---|
| 2021 multiple | 3.3385 | 3.6933 | 5.100 |
| Property Class | Light Industry | Business | Recreation |
|---|---|---|---|
| Scenario A and E | 3.3385 | 3.6933 | 5.1000 |
| Scenario B | 3.9620 | 4.3015 | 5.4805 |
| Scenario C | 3.1000 | 3.3000 | 5.1000 |
| Scenario D and F | 3.3385 | 3.6933 | 6.0000 |
Page 163–171
Scenario results
Page 163–171
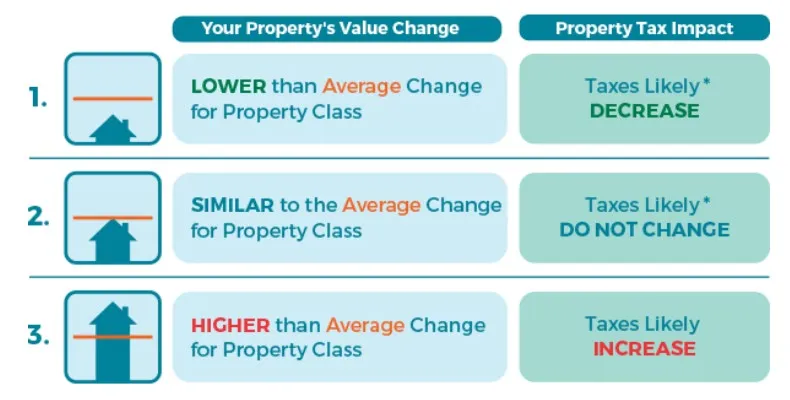
Scenario A (4.7%) results – individual properties
| Description | Percentage | Amount |
|---|---|---|
| Average property assessment increase | 24% | |
| Single family residential increase | 28% | |
| Difference | +4% | |
| Scenario A predicts for average property | 9% | $153 |
| Single family residential estimated increase | 9% + 4% = 13% | $191 |
| Description | Percentage | Amount |
|---|---|---|
| Average property assessment increase | 24% | |
| Strata residential assessment increase | 17% | |
| Difference | -6% | |
| Scenario A predicts for average property | 9% | $153 |
| Strata residential estimated increase | 9% - 6% = 3% | $52 |
Page 163–171
Scenario E (5.5%) results – individual properties
| Description | Percentage | Amount |
|---|---|---|
| Average property assessment increase | 24% | |
| Single family residential increase | 28% | |
| Difference | +4% | |
| Scenario E predicts for average property | 10% | $168 |
| Single family residential estimated increase | 10% + 4% = 14% | $238 |
| Description | Percentage | Amount |
|---|---|---|
| Average property assessment increase | 24% | |
| Strata residential assessment increase | 18% | |
| Difference | -6% | |
| Scenario E predicts for average property | 10% | $168 |
| Strata residential estimated increase | 10% - 6% = 4% | $66 |
Page 163–171
Choices
Recommendation:
THAT Council determines the municipal tax rates to be implemented for 2022 and direct that a bylaw be prepared to implement the tax rates accordingly.
Page 163–171
Extracted from: 2022 04 12 Committee of the Whole Agenda - Agenda - Pdf