Urban Forestry Operating & Financial Plan
A comprehensive consultant report by Diamond Head Consulting detailing the operational requirements, financial pathways, and feasibility of achieving 30%, 35%, or 40% canopy cover targets.
Planting Capacity and Structural Constraints
Opportunities mapping identified approximately 8,000 potential planting sites, with roughly 7,300 meeting current Subdivision Servicing (SDS) Bylaw standards. This is insufficient to support higher canopy targets through municipal lands alone.
Achieving a 30%, 35%, or 40% canopy target requires:
- Expanded planting in parks and rights-of-way,
- Creation of new planting space through capital projects,
- Integration of tree requirements into development processes,
- Significant expansion of planting on private lands.
Planting capacity becomes increasingly constrained under higher targets. The feasibility of 35% and especially 40% depends on structural changes in how planting space is created and how private landowners participate.
Peer Comparison and Benchmarking
A jurisdictional scan was completed to situate View Royal’s program relative to comparable municipalities across Vancouver Island, the Lower Mainland, and the Sunshine Coast. Comparators vary in size, canopy conditions, and fiscal capacity, but clear patterns emerge.
Municipalities with higher canopy ambitions consistently maintain:
- Dedicated urban forestry staff (often one or more full-time arborists),
- Structured pruning and inventory programs,
- Larger planting budgets,
- Per-capita spending significantly above View Royal’s current level.
Communities pursuing canopy increases in the range of 4% to 10% over 20 to 30 years typically maintain annual planting programs in the hundreds of trees and operate with multiple full-time urban forestry staff. Larger centres with ambitious targets, such like one bridging a delta of > 5% canopy coverage from current levels, operate programs often several times the size of View Royal’s current budget and staffing complement. By contrast, smaller municipalities with limited budgets tend to adopt modest canopy increases, often in the range of 1% over 20 years, paired with incremental program expansion.
Peer comparison does not prescribe a specific target for View Royal, but it demonstrates a consistent relationship: higher canopy targets require higher, sustained investment. Targets set without commensurate resourcing tend to be aspirational rather than operational.
Enhanced Program Model
This Plan applies a lifecycle costing approach that accounts for planting, watering, structural pruning, cyclical pruning, removals, soil care, and inventory updates over a tree’s lifespan. Under a proactive maintenance model, tree lifespans are expected to extend significantly, improving return on investment and reducing long-term replacement costs.
Core enhancements required to implement the UFS include:
Dedicated Town Arborist: A full-time Town Arborist is foundational. This role would provide technical leadership, oversee lifecycle management, coordinate contractors, support development review, and track canopy performance.
Enhanced Operational Funding: Maintenance budgets must scale with the number of trees under municipal care. Structured pruning cycles, establishment watering, and inventory management are necessary to sustain canopy gains.
Expansion of the Private Tree Planting Program: Municipal lands alone cannot deliver required planting volumes under higher canopy scenarios. The Resident Tree Program and related private initiatives must expand significantly to meet targets.
Natural Areas Capacity: Strengthening invasive species management and restoration planning supports long-term canopy health and biodiversity.
Financial Pathways
At full implementation (2045), estimated annual program costs are expected to be:
- 30% canopy cover: approximately $790,000 annually
- 35% canopy cover: approximately $1,140,000 annually
- 40% canopy cover: approximately $1,720,000 annually
These represent mature program levels that include full UFS implementation, dedicated staffing, and scaled planting and maintenance systems. Planting requirements rise sharply across pathways. A 30% target requires moderate expansion beyond current practice. A 35% target requires sustained, large scale increases in municipal and private planting. A 40% target represents a substantial escalation that well exceeds current site availability and program structure without major policy and funding shifts.
Target Feasibility
All three canopy pathways rely on the same core program elements: a dedicated Town Arborist, enhanced lifecycle maintenance, structured pruning and inventory cycles, expanded private planting programs, and strengthened restoration capacity. These components are required regardless of whether Council selects a 30%, 35%, or 40% canopy target. The distinction between scenarios is not structural, but one of scale.
A 30% canopy target requires roughly 260 municipal trees per year and 610 private trees annually over 20 years. A 35% target increases this to approximately 625 municipal trees and 1,515 private trees per year. A 40% target would require about 1,300 municipal trees and 2,060 private trees annually.
Higher planting volumes expand the long-term municipal tree inventory and proportionally increase asset management obligations. The financial differences between scenarios therefore reflect the cumulative maintenance costs of progressively larger tree populations by 2046, not different program designs. Council’s decision should align with the scale of sustained annual planting the Town is prepared to support, and the long-term maintenance responsibilities that accompany it.
Table of Contents
EXECUTIVE SUMMARY .......................................................................................................................1 Canopy Cover Is One Indicator of Program Success .................................................................................................1 Current Program Context ..........................................................................................................................................1 Planting Capacity and Structural Constraints ............................................................................................................2 Peer Comparison and Benchmarking ........................................................................................................................2 Financial Pathways ....................................................................................................................................................3 Target Feasibility .......................................................................................................................................................3 TABLE OF CONTENTS ..........................................................................................................................4 1.0 KEY CONTEXT ..........................................................................................................................5 Proactive Urban Forest Management Approach ......................................................................................................5 Canopy Cover ............................................................................................................................................................6 2.0 PEER COMPARISON .................................................................................................................8 Our Program ..............................................................................................................................................................8 Peer Comparators ...................................................................................................................................................10 3.0 FINANCE AND OPERATIONS ...................................................................................................14 Enhanced Operational Program ..............................................................................................................................14 Bolstered Administration ........................................................................................................................................15 Recurring Initiatives ................................................................................................................................................16 Program Pathways ..................................................................................................................................................18 APPENDIX 1 DISAGGREGATED SUMMARY OF CANOPY COVER AND URBAN FOREST PROGRAM RESOURCING 23 APPENDIX 2 PEER LAND USE COMPARISON ................................................................................24 APPENDIX 3 ANNUAL OPERATING COSTS ...................................................................................25
1.0 Key Context
The Town of View Royal’s Urban Forest Strategy (UFS) is being considered for adoption, laying out a strategic plan for the management of the community’s urban forest over the next 20 years. It includes a broad range of goals, strategies, actions, and monitoring criteria to improve the planning, management, maintenance, protection, and stewardship of the Town’s urban forest. Much of this framework either explicitly or implicitly supports the achievement of a canopy cover target, currently set to be 30%.
At its core, this document serves to provide insight into the resourcing required to support implementation of that ambitious plan. As a result, it is more operational in nature, and explores the operational burden associated with the UFS’ gradual rollout, and offering insight into the potential operational burden associated across three canopy cover pathways (i.e., 30%, 35% and 40%). It also provides a brief review of management and resourcing practices in other communities, to support program benchmarking, and has the following overall structure:
- Key Context: a summary of key considerations to keep front of mind while reviewing this document.
- Jurisdictional scan: A peer comparison of municipalities and their urban forestry programs, including operational and canopy cover targets.
- Program Pathways: Overview of the proposed canopy cover scenarios (30%, 35%, 40%) and their financial and level of service implications compared to the present.
- Life-Cycle Cost Analyses: Summary of the life cycle costs associated with urban forest maintenance administration.
Proactive Urban Forest Management Approach
View Royal’s current urban forest program operates primarily on a reactive basis. The Town does not maintain a formal pruning cycle, inventory update schedule, or structured risk assessment program. Tree maintenance is largely responsive in nature, driven by service requests from the public or by incidental staff observations. Under this model, intervention typically occurs only once a tree has declined, failed, or otherwise suffered an observed issue. While this approach can address immediate safety and liability concerns, it does not systematically maintain tree health, structure, or long-term performance. It also results in unpredictable workloads and greater budget variability, particularly during storm events and extreme weather.
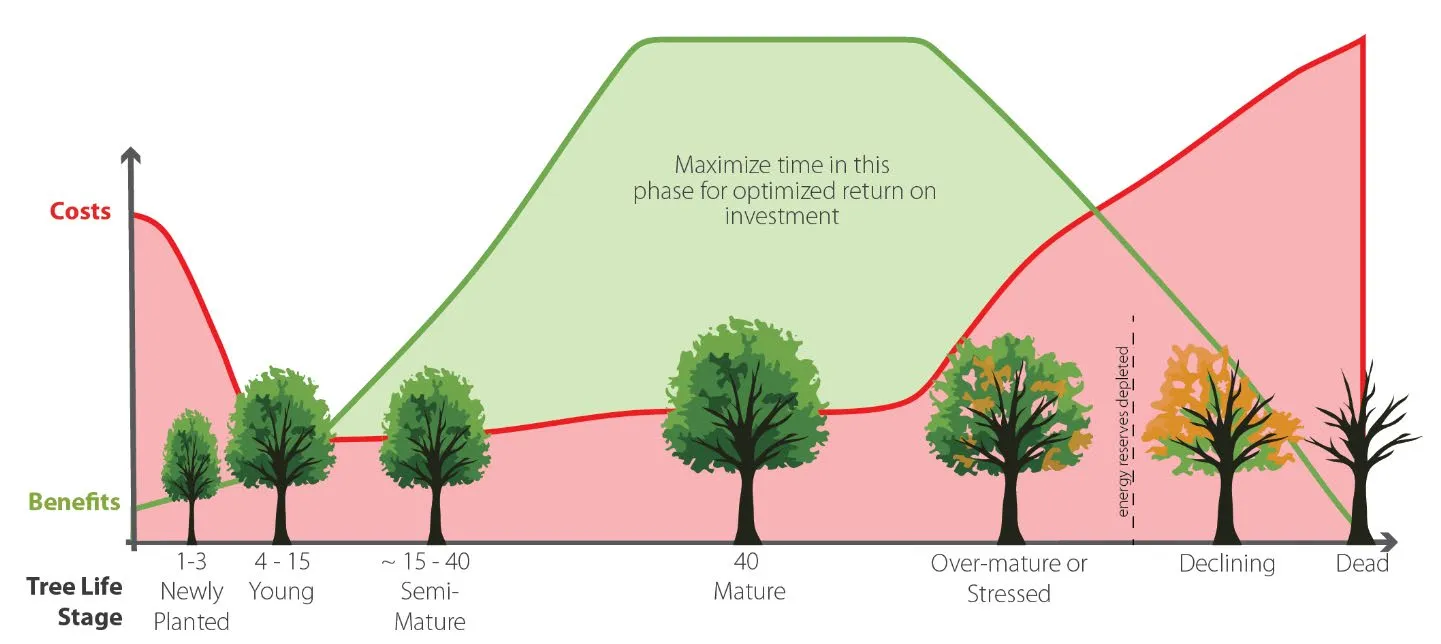
Best practices in urban forest management generally suggest that strategic, early investment in urban forest assets reduces long-term costs. Proactive programs typically include regular inventory updates, which drive recurring maintenance cycles, and can be further supported by a strong establishment care regimen, and prompt asset renewal (see Section 3.0 for expanded discussion on these practices). The rationale for this proactive investment is two-fold, and both are predicated on extended asset life cycles:
Proactive management can extend a tree's functional lifespan by decades, reducing the frequency of relatively expensive planting and removal activities. These are dollars spent on maintenance rather than replacement, and
Elongated asset life-cycles secure a better return on public investment by way of extending the period through which mature tree benefits are being enjoyed by the community (Figure 1).
Canopy Cover
Just One Measure
Canopy cover provides a simple, accessible measure to track the extent of the urban forest and the broad successes and failures of management efforts within a community. It is also increasingly feasible to report on regularly, as the costs of acquiring LiDAR and remote imagery have decreased in recent years. Further still, coverage metrics like canopy cover offer a quantitative metric that’s easily integrated into other municipal processes and plans, like the Official Community Plan, or through local development processes and bylaws.
It is however important to recognize that canopy coverage measurements do not offer a full picture of the successes or merits of an urban forestry program and alone do not offer sufficient information to assess the sustainability of management practices. A range of other considerations (e.g., maintenance practices, biodiversity, program resourcing) also support canopy growth and cannot be adequately evaluated through current canopy coverage measurements. As a result, canopy coverage measurements should be considered alongside a range of other program metrics to understand the full picture; this is why the urban forest management strategy puts forward a monitoring program broader in scope than canopy coverage alone.
Temporality of Canopy Cover Targets
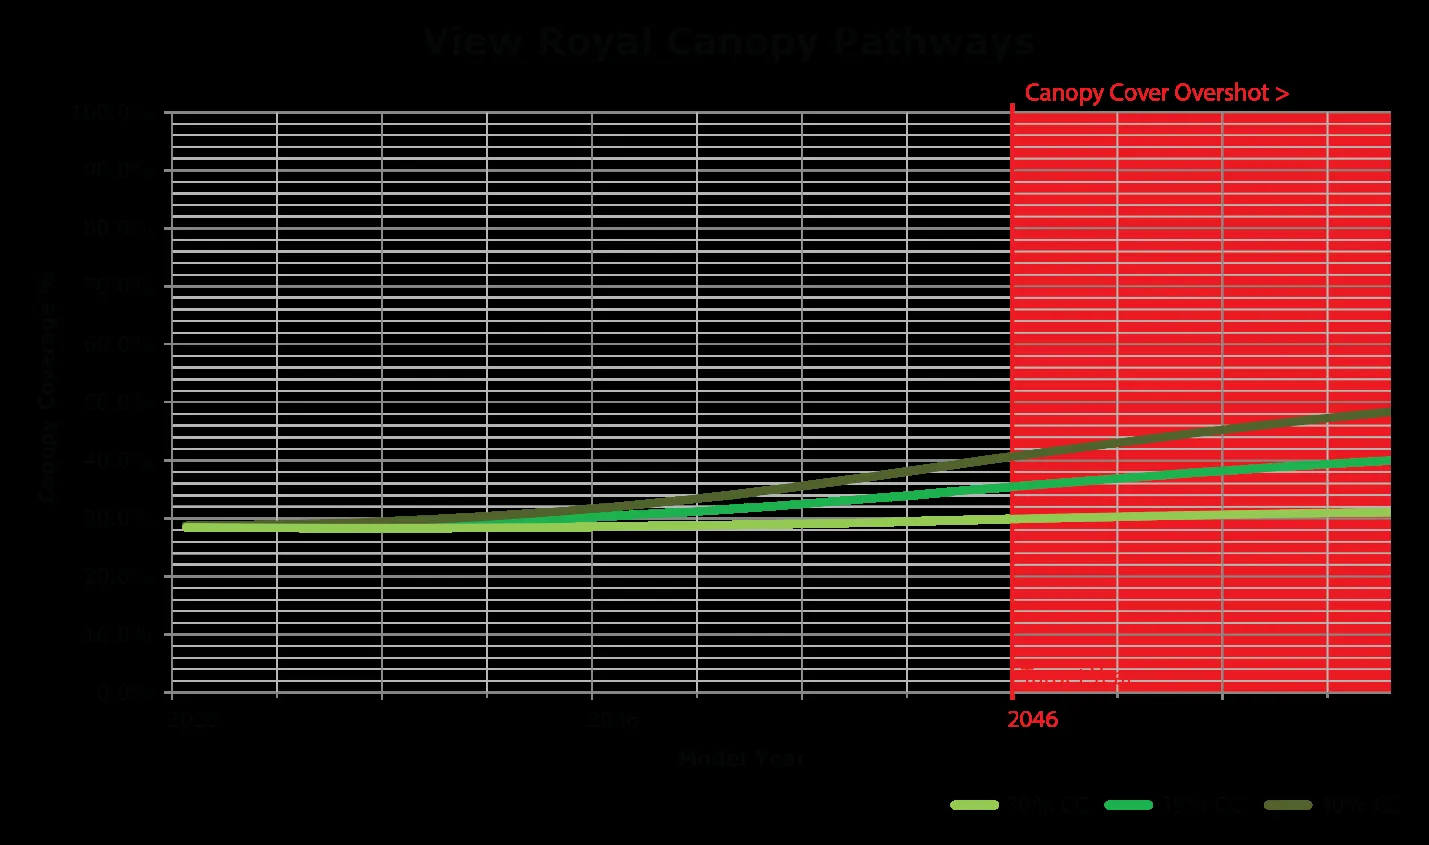
Trees experience growth continually through life stages. As a tree ages, growth tends to slow considerably, particularly with respect to height. Because growth and therefore canopy area are not static, a canopy coverage measurement (or target) is just the proportion of a given area of interest covered by tree canopy at one particular point in time. Canopy cover targets that are set nearer-term (e.g., < 30 years), tend to require planting more trees annually to hit a target than if that same target were set further out (e.g. 30 - 50 years). This is because the trees planted towards a nearer-term target will not generally have time to grow to maturity under relatively short time horizons. This is particularly true where a large delta exists between the identified target and the current canopy coverage measure.
When tree planting numbers are increased to realize a shorter-term target, the result is often that the set target is ‘overshot’ in the years following the target date, as the young trees reach maturity in the decades following.
View Royal’s canopy coverage would likely exceed its identified target (i.e., 30%, 35%, or 40%) in the years following 2045. The magnitude to which the target is exceeded or ‘overshot’ depends on how many trees have been planted in the years leading up to the target date, as those trees will continue to grow well beyond the current 20-year horizon (Figure 2).
Limited Planting Areas
Planting opportunities were also mapped during the preparation of alternative canopy pathways. ‘Opportunities mapping’ simply describes sites that would be immediately available for tree planting. Typically, these consist of turf grass that meets the requirements of the Town’s Subdivision Servicing (SDS) Bylaw. There are currently approximately 8,000 planting sites available, and 7,300 comply with the Town’s SDS Bylaw, which is not currently enough planting opportunities identified through the mapping process to support the achievement of a 30% (17,400), 35% (42,800) or 40% (67,250) canopy cover target in the Town of View Royal. In practice, a canopy cover target can still be met without having planting opportunities available. However, in this case, the Town will likely need to employ a combination of planting in turf sites that do not meet the requirements of its own SDS bylaw and/or by creating new opportunities where opportunities don’t currently exist (e.g., new boulevard planting sites through capital works). The latter of the two solutions can introduce considerable cost to a planting program.
2.0 Peer Comparison
A jurisdictional scan of the operational design and resourcing of urban forest programs was conducted to situate View Royal’s current (2024) program relative to those of peer municipalities. This sort of comparison facilitates the Town to benchmark its program against that of its peers. Peers were selected based on similar contexts, such as land area, population, and/or proximity. Selections encompass a range of resourcing levels, canopy coverages, and canopy coverage targets (Figure 3). Additional details were included about each comparator’s planting program, as available. The following communities were selected as peer comparators:
- The City of Langford,
- The Town of Oak Bay,
- The City of Victoria,
- The Town of Gibsons,
- The Town of Comox,
- The City of Courtenay,
- The City of North Vancouver, and
- The City of Port Moody.
The following is a brief review of each of those programs, as well as a quick overview of View Royal’s own program.
Our Program
Like many of the selected peers, View Royal is located in the CRD and had a population of 11,500 in 2021 across an area of 14km2 (5.6 km2 of which is urban). In 2023, our urban canopy cover was measured to be 29%, and 60% canopy cover across the Town’s entire jurisdictional area (including Thetis and Mill Hill Regional Parks). Within the urban area, View Royal’s land base is dominated by right-of-ways (24%) and single-family residential use (22%), with major components of mixed residential (12%), and parks (9%). The Town’s Urban Forest Strategy has set an urban canopy cover target of 30% to be achieved by 2045. Council has also expressed interest in exploring the feasibility of achieving 35% and 40% targets within that same period. That interest served as the catalyst for this document.
The Town’s current urban forestry budget is approximately $343,000 annually, which includes a $17,500 replacement tree budget, staff time spent on tree-related matters, contractor supports for development review, and the annual free tree giveaway that supports planting on private land (160 trees in 2024). Currently, public tree planting occurs at very modest levels, with approximately 30-50 trees being installed annually. Overall, public and private rates of tree planting have not kept pace with removals over the last two decades. To decouple from historic patterns of net loss, each of the 30%, 35%, and 40% canopy pathways would require significantly more tree planting than has been the case previously (see Section 3.0 Program Pathways).
There is currently no dedicated staff capacity to absorb significant expansions of program scope or technical requirements. All tree maintenance activities are currently contracted, as are some development and permit review activities.
Considering Resourcing and Target Setting
Figure 3 plots canopy change against program budgets, and helps to illustrate the relationship between program resourcing, design, capacity and aspired canopy growth. View Royal is situated amongst peers with relatively low levels of program resourcing and a lower canopy cover target. This is not inherently bad or poor practice. Canopy cover targets that are higher notwithstanding lower levels of resourcing may be more aspirational in nature, and difficult to achieve in practice, whereas higher levels of resourcing and a lower target may be indicative of urban forestry resources being directed to other program areas besides canopy growth (such as maintenance and monitoring, which is also beneficial). Communities with higher existing canopy coverage, like Port Moody and Langford, tend to set lower canopy cover targets but may allocate greater resources to retaining what’s already in place. High levels of resourcing and higher canopy cover targets are more common in larger centres, which generally have lower canopy coverage but greater available resources and capacity to support a more aspirational target.
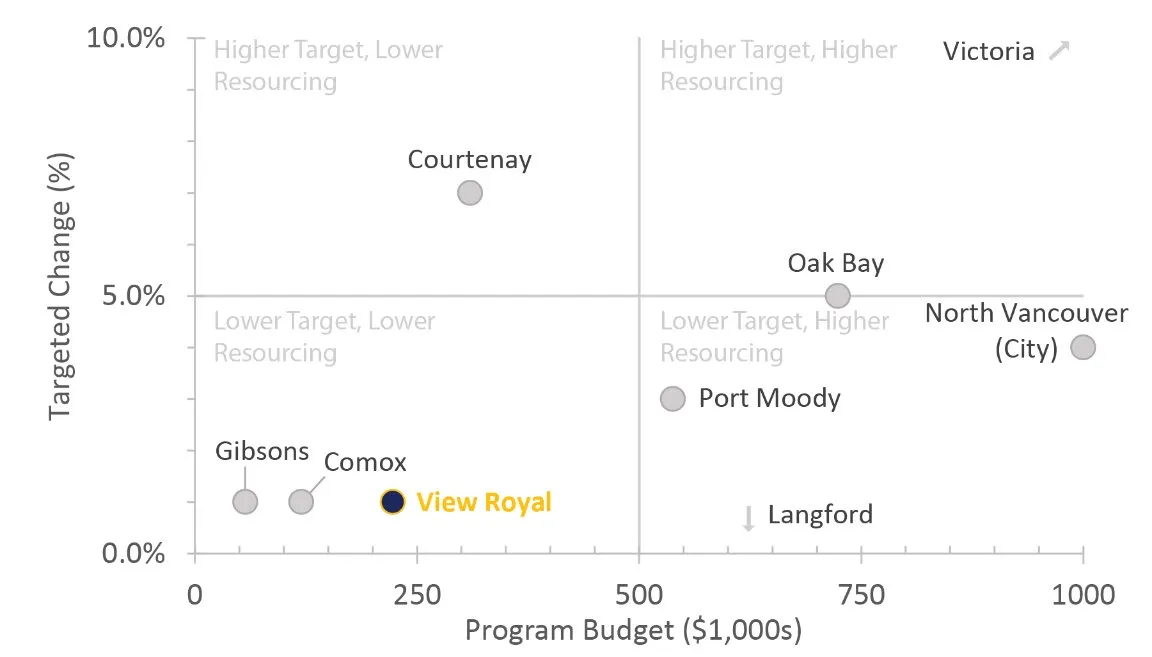
Figure 3 simplifies the nuances that go into setting a canopy cover target. Contextual factors, such as differences in land use, large parks, development pressures, and available resources, need to be considered in a target-setting exercise. However, plotting canopy cover against resourcing in this way helps to communicate some of the justification for the setting of a target that is aligned with the real resources available to a program.
Peer Comparators
City of Langford
The City of Langford had a population of 56,500 in 2021 across 41 km². In 2023, the city had 48% community-wide canopy cover. Key land uses include hillside and shorelines (29%), parks (25%), residential (15%), and right-of-ways (11%). The city has adopted community-wide canopy target that is both ranged and regressive from current canopy cover; 40% to 45% by 2050. This is predicated on the significant pressures the community faces in terms of continued growth, as well as the fact that 48% canopy coverage is already quite high amongst peer municipalities. In addition, the city’s canopy cover target is measured community-wide, which tends to inflate coverage metrics in communities with significant parkland.
Langford currently plants about 200 caliper trees per year toward offsetting losses associated with new development. Target municipal planting rates range from 300 trees at the lower end, to more than 40% lower target to over 2,000 trees per year for sustainment of canopy coverage at 45% (this also assumes significant greenfield growth). Langford’s urban forestry program budget is roughly $630,000 ($11/capita), which includes a $100,000 planting and replacement budget. The City currently has one dedicated urban forestry FTE (i.e., an arborist) responsible for tree inspections, contract administration and development review, in addition to a Director of Parks whose role encompasses overseeing urban forest management and operations.
In View Royal, there is opportunity to include Thetis within the canopy coverage metric. In some communities, including large parks can make sense given the configuration or ownership of the parkland. In others, inclusion of parks can result in large, forested areas being considered within a target where the municipality has little influence over management intervention. Including more canopied area within a target makes it so that the same nominal change (e.g., planting of a few hundred trees) is less perceptible in terms of its overall influence on the overall target. Being as Thetis is Provincial and very large relative to View Royal’s overall land base, the inclusion of the park as part of the Town’s canopy cover does not make sense.
Town of Oak Bay
The Town of View Royal is located in the CRD and had an urban population of 18,000 in 2021 across 11 km². In 2015, the Town reported 33% urban canopy cover. Key land uses include single-family residential (39%), right-of-ways (19%), low-density residential (11%), community institutional (11%), commercial and mixed use (10%), and parks (8%). The Town has set an urban canopy target range from 36% to 40% by 2045, and plants about 125 caliper trees per year despite a target rate of 200 trees per year on public land, and 330 trees per year in private. The community’s urban forestry program budget is $724,000 ($40/capita), including a $38,000 planting and replacement budget. The Town has two dedicated urban forestry staff, including an arboriculture supervisor and an arborist, responsible for planting, pruning, removals, watering, and tree health care.
The Town of Oak Bay’s 40% canopy cover target represents a delta of 7% and was to be achieved over a longer period (eight more years) than the 20-year period underpinning View Royal’s target pathways. To achieve this increase, Oak Bay’s UFMP proposed a $300,000 increase to its urban forestry program budget within the first two years of the plan’s adoption; securing funds for a new urban forester to guide plan implementation, and a grants coordinator to support funding, public education and stewardship activities; actions consistent with View Royal’s UFS. This also included seasonal labourers to support a regular pruning cycle for its young, park and street trees ($50,000) and an extension of its watering program by two months ($10,000). It also increased its annual planting program by $23,000, bringing it to $61,000, up from its 2017 baseline.
City of Victoria
The City of Victoria is also located in the CRD and had an urban population of 92,000 in 2021 across its 19 km² land area. In 2023, Victoria had 30% urban canopy cover. Land use information was not made available to us at the time of the writing of this report. The City has set a target of 40% urban canopy cover by 2050. Victoria plants approximately 375 municipal caliper-sized trees per year.
Victoria’s urban forestry program budget is $3,500,000 ($38 per capita). The City’s program consists of 16 dedicated urban forestry staff positions, together responsible for all aspects of urban forest management, including planting, removals, maintenance, inspections, and bylaw administration;
- Manager of Urban Forestry Services
- Supervisor of Arboriculture Operations
- Supervisor of Urban Forest Planning
- Assistant Supervisors (2)
- Senior Urban Forest Planner
- Tree Preservation Coordinators (3)
- Urban Forest Technicians (2)
- Utility Arborists (2)
- Technical Field Arborists (3)
The City of Victoria’s urban forest program budget is 16 times the size of View Royal’s and consists of 16 more full-time staff. The city has also experienced an increase in canopy cover over the past decade, differing from most municipalities on Vancouver Island and the Lower Mainland, which have experienced a decline. Their current planting rates are comparable to those that would be required for View Royal to achieve a 40% target and are backed by significant staff and fiscal resources.
Town of Gibsons
The Town of Gibsons is in the Sunshine Coast Regional District and had a population of 4,750 in 2021, across a 4 km² land area. In 2021, Gibsons reported 30% urban canopy cover. Dominant land uses include low-density residential (28%), medium and high density residential (22%), right-of-ways (15%), mixed use (8%), and parks (8%). The Town has recently set an urban canopy cover target of 31% by 2045.
The Town has not historically planted trees in an intentional capacity. The target municipal planting rate is 110 caliper trees per year, supported by a target private planting rate of 25 trees per year, which will require the development of a new street tree and park planting program. Gibsons’ urban forestry program budget is $57,000 ($12 per capita). The Town reports no dedicated urban forestry staff positions. The Town of Gibson’s UFMP proposes canopy cover and planting target increases similar to View Royal’s 30% canopy cover pathway.
Town of Comox
The Town of Comox is in the Comox Valley Regional District and had a population of 14,750 in 2021, as well as a land area of 17 km². In 2025, Comox reported 25% urban canopy cover. Dominant land uses include the airport (36%), single-family detached (26%), right-of-ways (12%), and parks (9%). The size of the Town’s airport skews the results of its canopy cover, which would otherwise be significantly higher. While the Town’s Urban Forest Management Strategy is still in draft, it proposes urban canopy cover targets of 26% by 2045 and 30% by 2065. Municipal rates of tree planting have not historically been tracked. The target municipal planting rate is 115 caliper trees per year, supported by a target private planting rate of 100 trees per year.
Comox’s urban forestry program budget is $120,000, or $8 per capita, including a $20,000 planting or replacement budget. The Town has one dedicated urban forestry staff position, the Town arborist, who is responsible for planting, planning, contracting, and inspections. Though still draft, The Town of Comox is set to commit to a 1% increase in canopy cover over 30 years, with planting rates and budgets comparable to those of View Royal’s 30% pathway.
City of Courtenay
The City of Courtenay is in the Comox Valley Regional District and had a population 28,500 in 2021 across a land area spanning 32 km². In 2018, Courtenay reported 25% urban canopy cover. Dominant land uses include low-density residential (23%), agriculture (20%), rural use (17%), and public lands (12%). The City has considered a range of urban canopy cover targets, from 21% to 34% by 2050, reflecting different levels of program resourcing, tree bylaw restrictions, and voluntary private tree planting rates. The target municipal planting rate was set as 165 caliper trees per year and private from 285 to 565 caliper trees, per year (moderated by target).
Courtenay’s urban forestry program budget is $310,000 ($11 per capita), including a $103,500 planting and replacement budget. The city has one dedicated urban forestry staff position. While the Courtenay’s canopy cover target ranges from a 4% decrease to a 9% increase, the planting rates committed to are similar to those needed to achieve View Royal’s 30% canopy cover target. The target would have also be achieved over a longer period (i.e., 30 years), with support from a Town arborist, and about five times View Royal’s existing resources for tree planting. Their UFMP implementation budget also includes a significant increase in funding for planting, young tree maintenance, cyclical pruning, proactive risk and health assessment and management, and stumping and removals.
City of North Vancouver
The City of North Vancouver, located in Metro Vancouver, had a population of 58,000 in 2021 distributed across 12 km². In 2021, North Vancouver reported an urban canopy cover of 20%. Dominant land uses include residential (39%), right-of-ways (25%), parks (12%), and mixed use (10%). The City has set targets of 24% urban canopy cover by 2050 and 30% by 2065. They also aim to achieve over 40% canopy cover on select ‘Cool Streets’ by 2045 to mitigate the effects of extreme urban heat in areas with low canopy cover and high pedestrian use and population density. The target municipal planting rate is 670 caliper trees per year, supported by 890 private trees, annually.
North Vancouver’s urban forestry program budget is $1,010,000 ($17 per capita), including a $138,000 planting and replacement budget, and a $154,000 natural areas budget. Six dedicated urban forestry staff positions are on staff, including an urban forestry supervisor, assistant supervisor/field arborist, two tree workers, and two labourers. Collectively, they are responsible for tree planting, inspections, pruning, watering, removal, bylaw administration, planning, and IPM.
The City of North Vancouver has committed to a 4% increase in canopy cover over the next 20 years, with an existing planting budget about eight times larger than the View Royals, and six additional FTEs. To achieve this, it proposes planting rates comparable to those required to achieve View Royal’s 35% pathway. Recognizing the time required for trees to grow, the City has also set a more ambitious target over a 40-year period of 30%, a 10% increase from current coverage.
City of Port Moody
The City of Port Moody, located in Metro Vancouver, had a population of 33,500 in 2021 and a land area of 26 km². In 2019, Port Moody had 28% urban canopy cover. Dominant land uses include parks (47%), single-family detached (21%), and industrial (17%). The City has set a target of 31% urban canopy cover by 2050. Port Moody currently plants approximately 50 municipal caliper trees per year. The target municipal planting rate is 275 trees per year, supported by a target private planting rate of 825 trees per year to achieve 31% canopy cover by 2050.
Port Moody’s urban forestry program budget is $538,000 ($16 per capita), including a $15,000 planting and replacement budget. The City reports three dedicated urban forestry staff positions, including an urban forestry supervisor, urban forestry technician, and labourer responsible for planting, establishment, trail maintenance, emergency and hazard response, inspections and removals.
Its target planting rates are comparable to View Royal’s 30% canopy cover target, but again over a longer 30-year period. While its dedicated planting budget is currently near that of View Royal’s, its urban forest program includes 3 FTE able to support the City’s planting program, among the many other aspects of urban forest management.
3.0 Finance and Operations
The following financial forecasts are to be received as forecasted program budgets at full rollout of the actions contained in View Royal’s Urban Forest Strategy, to be phased in over a 20-year period. While core changes to maintenance regimen are suggested regardless of the Town’s future inventory size, Council are currently considering three canopy scenarios (i.e., 30%, 35% and 40%), and so program budgets would be expected to vary dependent on the number of trees planted, and therefore the number of trees brought under the Municipality’s care over the 20-year period.
The financial forecasts assembled here use a life-cycle costing approach. This means regular activities like tree care, replacement, and removal are first assigned an activity cost, then averaged across the assets' anticipated service life, and finally given a frequency at which the activity is expected to occur over the asset’s life. Some activities like planting and removal occur once in an asset’s life-cycle, while others like watering or structural tree training are to occur a finite number of times (i.e., 3 years through establishment, as put forward through the UFS), while others still will vary dependent on matters such as climate and the care regimen resourced in practice (e.g., reactive maintenance).
This section first describes the operational program put forward through the UFS, as it relates to the Town’s current program, and then explores three funding and canopy pathways based on that design: 30%, 35% and 40% canopy coverage.
Enhanced Operational Program
View Royal’s UFS involves changes to the operational program designed to support sustainability in management practices, and resilience within the urban forest. These changes range, most of them would require the support of a new or significantly enhanced program resources to be realized. This section offers a review of the activity costing approach used to inform the following program pathways, as well as expanded discussion around key enhancements to operational design.
Table 3-1. View Royal’s current and enhanced activity costs and frequencies, and life-cycle costs (approx.).
| Activity Cost | Current | Enhanced | |||
|---|---|---|---|---|---|
| Asset Renewal (Years) | 40 | 80 | |||
| Pruning cycle (Years) | 80 | 7 | |||
| LC Activities | $ | Frequency | LC Cost | Frequency | LC Cost |
| Tree planting | $150.00 | 1 | $150 | 1 | $150 |
| Inventory updates | $8.00 | 0 | $0 | 11.4 | $100 |
| Planned pruning | $150.00 | 0.5 | $75 | 11.4 | $1,725 |
| Reactive pruning | $200.00 | 1.2 | $240 | 0.8 | $150 |
| Structural pruning | $30.00 | 0 | $0 | 3 | $100 |
| Watering | $30.00 | 0.5 | $15 | 3 | $50 |
| Soil management | $30.00 | 0 | $0 | 3 | $100 |
| Removal | $300.00 | 1 | $300 | 1 | $300 |
| Stumping | $80.00 | 1 | $80 | 1 | $75 |
| Total | $860 | $2,735 |
Tree planting, stumping and removal
All trees are planted, removed, and stumped once in their lifetime. These are fundamental activities that occur as part of any management program. The primary difference between the current and enhanced management regimen is that given improved maintenance practices, we would expect elongated asset life cycles, which would in turn reduce the aggregate annualized removal and replacement costs incurred by the municipality on a yearly basis. Again, it becomes money spent on maintenance, rather than replacement.
Maintenance
Under View Royal’s current urban forest program, trees are pruned on a reactive basis, and beyond watering, young tree care practices are relatively inconsistent. To sustainably grow urban forest canopy, and to reduce the likelihood of establishment mortality, best practices suggest watering trees for at least 3 years post-planting. Structural pruning, being the (ground) pruning of young trees (suggested to occur at years (5, 7, and 9), also helps ensure trees develop strong branch structure that reduces the risk of significant failures that are thought to have a greater likelihood of severe impacts for the tree, person(s) or property, and which have poorer prognosis for the tree’s recovery.
Along those same lines, a regular 7-year pruning cycle, ensures each tree under the Town’s care is visited once on a seven-year cycle. This is an industry best practice, and ensures that as trees mature, they continue to maintain good structure and that most branches that pose a risk to the public, structures, or infrastructure are removed before damage occurs. Additional activities that support tree establishment and help maintain or improve tree condition can include soil amendments and mulching, which can help keep tree roots nourished and moist at the time of planting, and as they begin to establish.
Inventory updates
Currently, the Town of View Royal has an incomplete street tree inventory. The UFS suggests updates should occur in-step with an enhanced cyclical pruning program, so that inventory updates may drive operational programming. Having a complete tree inventory and regularly updating stewards an invaluable operational dataset, giving the Town insight into what it has and the state its in.
For annualized activity costs for each scenario based on final population sizes in 2045, see Appendix 1.
Bolstered Administration
Town Arborist
View Royal’s Urban Forest Strategy is constrained by limited in-house capacity; urban forest management responsibilities currently incurred across departments primarily as secondary duties. Administration costs aggregated across roles are thought to amount to $72,000 annually, while technical expertise remains largely contractor- and consultant-reliant. Establishing a Town Arborist at a market rate of $80,000–$100,000 would offer critical new capacity and subject matter expertise to support implementation of the Strategy and achievement of the Town’s canopy target. The Arborist would serve as the technical and strategic lead for urban forest lifecycle management, contract administration, development review, performance tracking, stewardship programming, and grant applications. They would also formalize operational standards and build internal expertise and capacity. This role would also oversee and expand the Town’s private tree-planting initiatives in collaboration with the Natural Areas Technician, and work with the existing Communications Coordinator to promote urban forestry programs and recruit volunteers. Consolidating these functions under a single technical lead would strengthen accountability, reduce reliance on external consultants, and internalize long-term program capacity.
Natural Areas Technician
The importance of View Royal’s natural areas is enshrined in its OCP vision statement. A part-time Restoration Coordinator funded at $18,000 annually and is responsible for invasive species management and restoration in View Royal, including coordination with the Greater Victoria Green Team. Existing funding limits their ability to manage invasive species across the Town’s many forested natural areas.
Expanding the Coordinator’s current role into a full-time Natural Areas Technician position at an annual cost of approximately $60,000–$80,000 would enable the development of forest management plans for flagship parks, systematically prioritize invasive species control and native planting efforts, and contribute to the Town’s urban canopy cover target. It would also enable the Town to monitor the health of its forested natural areas, ensure the success of its restoration sites, and expand existing stewardship programming. With support from the Town’s existing Communications Coordinator, the Technician would also pursue grants and external funding opportunities to expand the Town’s urban forestry initiatives.
View Royal’s existing Resident Tree program grew exponentially from 2023 to 2024. Increasing canopy cover in View Royal depends on public support and shared responsibility, as it will require sustained tree planting on both private and municipal land. This is especially true because municipal lands alone do not provide enough planting opportunities to reach the proposed 30%, 35%, or 40% scenarios. Without dedicated engagement capacity, the high levels of planting on private property required to achieve a 30% - 40% canopy cover target are unlikely to be achieved. The Technician would also collaborate with the Town Arborist to administer View Royal’s private tree planting programs, directly accelerating canopy growth by turning private property into a much-needed driver of urban forest expansion.
Recurring Initiatives
Canada Summer Jobs Intern
Since the Town of View Royal currently has limited capacity and resources to implement the UFS, a subsidized Canada Summer Jobs (CSJ) Intern would provide program support during the peak growing season to both the Town Arborist and the Natural Areas Technician at a reduced cost of approximately $15,000 annually. The Intern would assist with updating and completing the Town’s tree inventory, perform structural young-tree pruning under the supervision of the Town Arborist, and verify that contracted services such as young-tree watering have been completed to municipal standards. They would also complete assessments of young-tree mortality and support the Natural Areas Technician with restoration site monitoring, invasive species removal, and stewardship events. In collaboration with the Technician and the existing Communications Coordinator, the intern would also play a critical role in public outreach and growing the Town’s private planting programs towards View Royal’s canopy target.
Greater Victoria Green Team
The Greater Victoria Green Team plays an important role in supporting View Royal’s restoration and invasive species management efforts. With guidance from the Town’s Restoration Coordinator, they lead volunteer-based work parties that restore degraded forest natural areas by removing invasive plants and planting native trees and shrubs in municipal parks. These activities directly improve forest health and support biodiversity, provide public opportunities for urban forest stewardship, and protect the ecological integrity of the Town’s native ecosystems. These volunteer events increase awareness of ecological issues and build public support for the Town’s urban forestry initiatives.
Current funding levels limit the scale and frequency of this work. Invasive species management requires repeated treatment and monitoring over multiple years. Restoration plantings require follow-up care to ensure survival and canopy establishment. Expanding the Green Team would allow the Town to increase the number of restoration sites treated annually, improve maintenance of planted areas, and extend programming across more parks, while contributing to the Town’s canopy cover ambitions.
Private Tree Planting Program
View Royal’s Resident Tree Planting Program is currently led by the Town’s Engineering Department and has grown nearly sixfold between 2023 and 2024, to $26,000. As discussed in Section 1.0 Limited Planting Areas, there is currently insufficient planting space on municipal property in View Royal to achieve a 30% to 40% canopy cover target. Therefore, continuing to expand the Town’s Resident Tree Program and developing new planting programs to encourage private residential and ICI landowners to plant trees will be necessary in addition to expanding the Town’s municipal planting program. Under a 30% canopy cover scenario, the Town’s private tree planting program would be doubled ($52,000) under the 30% scenario, tripled ($78,000) under the 35% scenario, and would grow to $156,000 under the 40% scenario. This would support the annual planting target of 410, 1515, and 2060 trees on private property under each respective scenario.
Forest Management Planning & Intervention
Forested natural areas management in the Town of View Royal is currently limited to occasional restoration activities supported by the existing Restoration Coordinator and the Greater Victoria Green Team. As previously discussed, current levels of resourcing limit the number of View Royal’s parks and forested natural areas that can be regularly managed. It also prevents the Town from developing Forest Management Plans for its flagship park natural areas, such as Portage Park. This is especially important for parks and green spaces that contain Garry oak meadows, which have steadily declined by 85% on the Island since 1800.
Beginning a proactive forest management approach for $19,000 annually is essential to maintaining the health and function of these ecosystems. By planning ahead, View Royal can strategically reduce wildfire risk and prioritize invasive species management and native habitat restoration. Integrating biodiversity thinking into forest management planning helps ensure that ecological integrity is preserved while also adapting to climate change and urban development pressures. Strategic, long-term planning allows View Royal to protect its natural heritage while building a more resilient and sustainable future.
Program Pathways
Note that the program pathways identified in this part assume full implementation (i.e., 2046) and do not imply that resourcing must immediately reach the identified levels. Further, costs associated with increased tree planting to achieve the inventory populations for each pathway are not included in the identified resourcing levels and would be incurred annually until the public tree population for each pathway is realized.
Current Resourcing Pathway
The Town of View Royal’s current urban forest program costs approximately $343,000 across a range of cost centres identified in Figure 3. This includes $195,000 for lifecycle management² (i.e. planting, pruning, watering, removal and stumping), $87,000 for program administration across staff with diverse portfolios (Director of Engineering, Deputy Director of Engineering, Engineering Clerk, Parks Supervisor, Restoration Coordinator), and $61,000 for recurring initiatives, including invasive species management and the Town’s resident tree planting program.
30% Canopy Cover Pathway
Each of the following three scenarios leverages the same fundamental program design, aligned with that suggested through the UFS and previously described. To sustain the levels of service put forward through the UFS and achieve a 30% canopy cover target by 2045, program costs would be expected to rise to $790,000 at full implementation (Figure 3-5). This would consist of $504,000 for enhanced lifecycle management of the Town’s trees, $140,000 for program administration and staff costs, and $146,000 for annualized special projects. As the Town significantly increases tree planting to achieve a 30% canopy cover target by 2046 (est. 260 tree/year), approximately $39,000 would be required to that end, annually.
[Pie chart titled Figure 3 showing baseline budget distribution: Administration 23%, Removal 20%, Recurring Costs 19%, Reactive pruning 16%, Tree planting 10%, Stumping 5%, Planned pruning 5%, and 1% for other.]
This is not a program pathway, but rather a review of baseline program resources. It would be reasonable, given current growth pressures and past trends, to continue to observe a canopy decline from the 29% the Town currently holds, if resource levels remain unchanged. Significant tree-planting efforts would continue to be primarily opportunistic and predicated on the initiation of other capital initiatives, rather than on any defined target. Operational budgets supporting urban forestry would continue to be set independently of desired program design and the number of assets under the municipality’s care, leaving resource attrition a concern. Program responsibilities would continue to be absorbed as secondary scopes under existing roles, leaving tree care expertise out of house and the Town reliant on third-party expertise for tree-related matters. Decision-making would continue to be based primarily on institutional knowledge, rather than through datasets and recorded observations. Private tree planting would continue to be encouraged, principally through the free tree giveaway, however, not to any defined private land target, and only as finances allow.
[Pie chart titled Figure 4 showing budget distribution under 30% canopy pathway: Planned pruning 36%, Admin 23%, Recurring Initiatives 20%, Removal 6%, Reactive pruning 3%, Tree planting 3%, and other segments.]
Under this scenario, full implementation of the UFS is achieved over a 20-year horizon. Canopy cover would be expected to increase from 29% to 30% by 2045. Operational budgets would be benchmarked to scale with the number of assets under the City’s care. Enhanced maintenance practices would be expected to elongate asset life cycles, supporting enhanced return through mature tree benefits, given public investment in their care. New staff would shore up existing in-house capacities, institutionalize in-house tree care knowledge, and expand the City’s capacity to roll out programming for tree growth on private land. Additional discussion of the program's scope identified through the UFS is provided earlier in this Section.
35% Canopy Cover Pathway
Under this scenario, canopy cover would increase from 29% to 35% by 2045. The 35% canopy cover scenario builds directly on the program framework established under the 30% pathway, including full implementation of the Urban Forest Strategy, enhanced lifecycle management, dedicated staffing, structured pruning and inventory cycles, restoration capacity, and expanded engagement programming. The increase in budget relative to the 30% scenario is driven primarily by three factors: higher municipal planting rates, substantially expanded private planting through the Resident Tree Program and related initiatives, and the long-term maintenance obligations associated with a significantly larger tree population in 2045.
[Pie chart titled Figure 3-5 showing budget distribution under 35% canopy pathway: Planned pruning 41%, Recurring Initiatives 17%, Admin 17%, Removal 7%, Reactive pruning 4%, Tree planting 4%, and other segments.]
To achieve a 35% canopy cover target by 2045, total annual program costs at full implementation are estimated at approximately $1,140,000. Of this, $825,000 is allocated to lifecycle management, $140,000 to administration and staffing, and $172,000 to recurring initiatives. In the short term, increasing planting and establishment watering to approximately 625 trees per year will require an estimated $94,000 annually.
40% Canopy Cover Pathway
Under this scenario, canopy cover would increase from 29% to 40% by 2045. The 40% canopy cover scenario represents a drastic increase in investment and canopy ambition. It maintains the same program structure as the 30% and 35% scenarios—dedicated urban forestry leadership, formalized lifecycle management, restoration planning, engagement capacity, and data-driven asset management—but significantly increases the scale of planting and long-term maintenance as the trees planted will not have time to grow very large within the 20-year timeframe. Similar to the 35% scenario, the higher budget is driven overwhelmingly by markedly expanded municipal and private planting programs and the maintenance required for the corresponding growth in the Town’s tree asset inventory. As canopy targets rise, so too do the number of trees requiring structured maintenance, risk inspection, watering, and eventual renewal.
[Pie chart titled Figure 3-6 showing budget distribution under 40% canopy pathway: Planned pruning 45%, Recurring Initiatives 17%, Admin 11%, Removal 8%, Reactive pruning 4%, Tree planting 4%, and other segments.]
At full implementation, annual program costs are estimated at approximately $1,720,000, including $1,325,000 for lifecycle management, $140,000 for administration and staffing, and $250,000 for annualized recurring initiatives. In the short term, achieving planting and establishment rates of approximately 1,300 trees per year would require an estimated $195,000 annually.