Appendix
Appendix 2: Peer Land Use Comparison
Visual charts comparing land use distribution (Residential, ROW, Parks, etc.) between View Royal and peer municipalities.
View Royal Land Use: 33% Residential, 24% ROW, 9% Parks & Open SpaceLangford Land Use: 25% Parks & Open Space, 29% Residential
Appendix 2 Peer Land Use Comparison
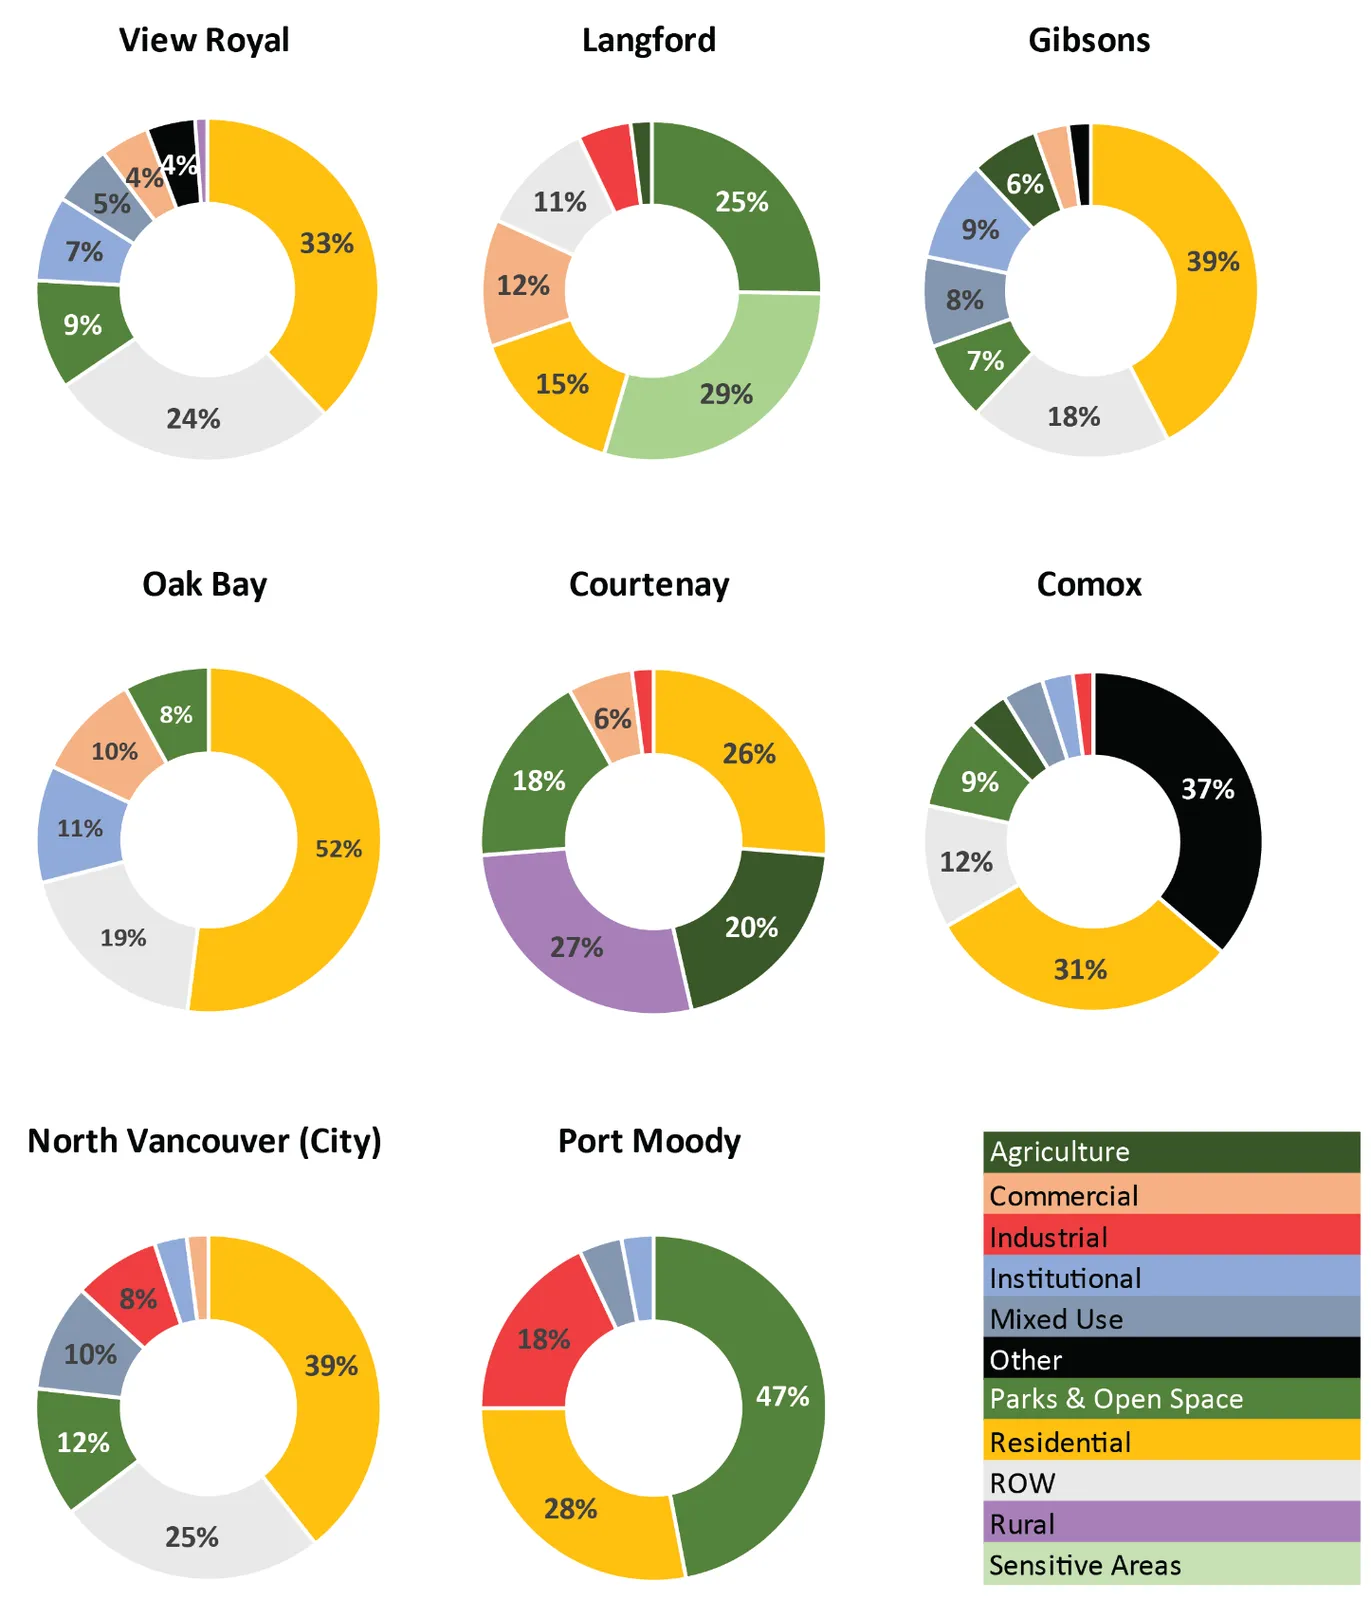
Figure 7. Peer land use summary comparison graphic.
Land Use Legend
- Agriculture: Dark Green
- Commercial: Peach
- Industrial: Red
- Institutional: Light Blue
- Mixed Use: Steel Blue/Grey
- Other: Black
- Parks & Open Space: Medium Green
- Residential: Yellow
- ROW (Right of Way): Light Grey
- Rural: Purple
- Sensitive Areas: Pale Green
Data Summary by Municipality
- View Royal: Residential 33%, ROW 24%, Parks & Open Space 9%, Institutional 7%, Mixed Use 5%, Commercial 4%, Other 4%.
- Langford: Sensitive Areas 29%, Parks & Open Space 25%, Residential 15%, Commercial 12%, ROW 11%.
- Gibsons: Residential 39%, ROW 18%, Institutional 9%, Mixed Use 8%, Parks & Open Space 7%, Agriculture 6%.
- Oak Bay: Residential 52%, ROW 19%, Institutional 11%, Commercial 10%, Parks & Open Space 8%.
- Courtenay: Rural 27%, Residential 26%, Agriculture 20%, Parks & Open Space 18%, Commercial 6%.
- Comox: Other 37%, Residential 31%, ROW 12%, Parks & Open Space 9%.
- North Vancouver (City): Residential 39%, ROW 25%, Parks & Open Space 12%, Mixed Use 10%, Industrial 8%.
- Port Moody: Parks & Open Space 47%, Residential 28%, Industrial 18%.
Page 48
Extracted from: 2026 03 17 Council Meeting - Agenda - Pdf(160 pages total)