A comprehensive strategic plan for managing and expanding the town's urban forest through 2045, including analysis of current canopy cover and detailed action plans.
Current canopy cover (2023): 29% within the Urban Containment Boundary (UCB)Target canopy cover: 30% by the year 20452024 Urban Forest program grade: 'Fair'Garry oak meadows have decreased in area by over 85% since 1800Inventory includes over 1,222 municipal boulevard trees, 33% of which are maplesTarget program budget: $10 per capita (current ~$6.50 per capita)Target capital budget for the program: $250,000 (current $184,000)Estimated annual tree planting/replacement needs: ~730 trees for the 'growth' scenarioThe strategy identifies 5 goals, 14 strategies, and 51 individual actions
1.8 Urban Forest Report Card
Criteria and indicators offer a standard framework for the assessment of municipal urban forest management programs. Such a framework enables municipalities to evaluate performance consistently over time and enables comparison with peer communities who have used the same evaluation approach.
View Royal’s urban forest program has been assessed against a widely recognized set of urban forest criteria and indicators. These criteria provide a baseline for evaluating progress across various elements of an urban forest management program, including planning, operations, maintenance, monitoring, and partnerships. The evaluation of the Town’s program included a thorough review of relevant policies and procedures, supplemented by detailed consultations with Town staff.
Evaluation of View Royal’s program was based on a detailed review of the municipal policies and staff interviews. Overall, the Town’s urban forest program scored ‘Fair’. The primary limitation in advancing View Royal’s urban forest program has been the limited resources available to it. All of the program is administered by staff whose primary role includes a range of other core tasks.
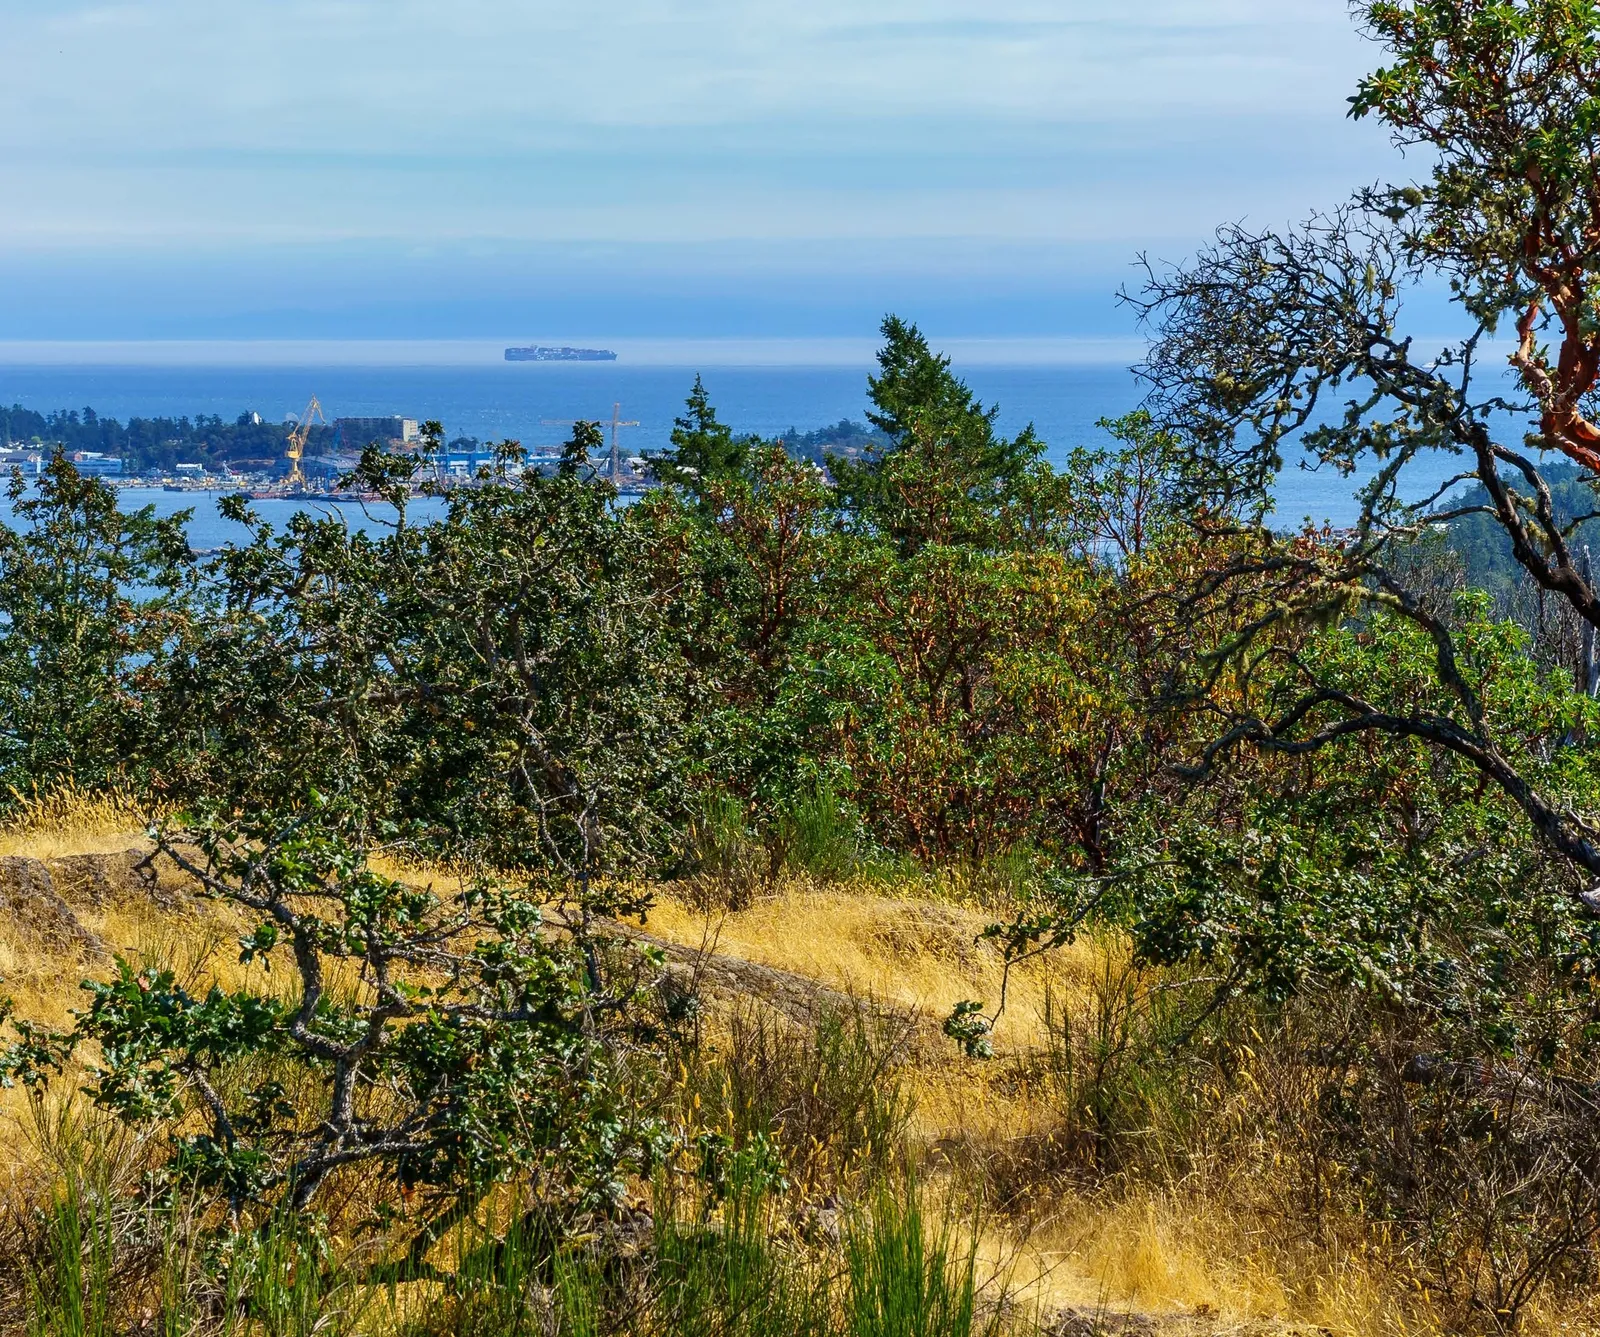
View of a coastline with trees and a ship in the distance from a viewpoint
Urban Forest Report Card
●●●● 2024 program grade (in colour)
○ Not yet assessed
2024 URBAN FOREST REPORT CARD GRADE:
The dial indicates a score of 12, placing the program in the FAIR category.
POOR: 7
FAIR: 12
GOOD: 8
OPTIMAL: 2
Category
Criteria
Grade
PLAN
Awareness of the urban forest as a community resource
FAIR
Tree canopy cover relative to established canopy cover goals
GOOD
Clear and defensible urban forest assessment and goals
OPTIMAL
Interdepartmental cooperation in urban forest strategy implementation
GOOD
Municipality-wide urban forest management plan
POOR
Municipal green asset management
FAIR
Municipal-wide biodiversity or green network strategy
FAIR
Tracking urban forestry operational carbon footprint and carbon-cycle balance
POOR
Urban forest funding to implement a strategy
POOR
Municipal urban forestry program capacity
POOR
Waste biomass utilization
FAIR
MANAGE
Equity in planting program delivery
POOR
Forest Restoration & Native species planting
FAIR
Ecosystem services targeted in tree planting projects and landscaping
FAIR
Selection and procurement of stock in cooperation with nursery industry
POOR
Streetscape and servicing specifications and standards for planting trees
FAIR
Municipal tree planting and replacement program design, planning, and implementation
FAIR
Development requirements to plant trees on private land
GOOD
Age diversity (size class distribution)
FAIR
Species suitability
FAIR
Species diversity
POOR
PROTECT
Regulations for the protection and replacement of private and municipal trees
GOOD
Regulations for sensitive ecosystems, soils, or permeability through private development
FAIR
Internal protocols guide municipal tree or sensitive ecosystem protection
GOOD
Standards and specifications supporting tree protection during development
GOOD
Cooperation with utilities on protection and pruning of municipal trees
POOR
MONITOR
Tree inventory
FAIR
Natural areas inventory
FAIR
Maintenance of intensively managed trees
FAIR
Publicly owned tree species condition assessment
FAIR
Tree risk management
FAIR
Emergency response planning
GOOD
Pest and disease management
FAIR
Knowledge of trees on private property
GOOD
PARTNER
Citizen involvement
FAIR
Involvement of large private land and institutional land holders
FAIR
Urban forest research
POOR
Regional collaboration
FAIR
Page 61–81
2. View Royal’s Urban Forest
2.1 Climate and Ecology
Climate
The Town of View Royal has a temperate coastal climate, shaped by its sheltered location in the rain shadow of the Olympic Mountains and Vancouver Island. This results in mild, wet winters and warm, dry summers with a mean annual temperature near 10°C and over 1,000 mm of annual precipitation. The climate and coastal setting support diverse terrestrial and marine ecosystems, including estuaries, deltas, meadows, and forests. Low snowfall enables a high diversity of overwintering birds, and Portage Inlet lies within a migratory bird sanctuary.
Ecology
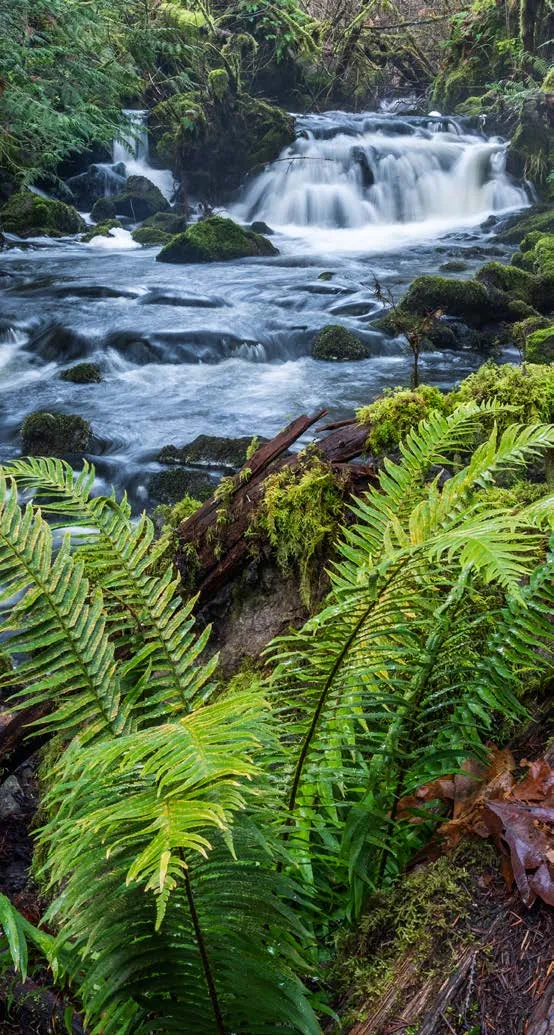
View Royal is in the Coastal Douglas-fir Moist Maritime (CDFmm) biogeoclimatic subzone, limited to low-elevation coastal areas around the Salish Sea. Native ecosystems feature century-old Douglas-fir forests with a lush understory of ferns, salal, Oregon grape, and ocean spray, especially in Thetis Lake and Mill Hill Regional Parks. Natural landscapes include grassy hilltops, marshes, mudflats, sandbars, streams, rivers, and lakes. Willows, dogwood, and snowberry are common in CDFmm floodplains, and grand fir and western red cedar are more common in wetter sites.
Invasive Species
Invasive plants like English ivy, Himalayan blackberry, and spurge laurel are widespread in the CDFmm and in View Royal, outcompeting native species and degrading wildlife habitat. Over 150 invasive species have been introduced to the region since European settlement. As early as 1972, a quarter of species in Garry oak ecosystems were non-native, with some areas having up to 80% of understory plants from exotic origins.
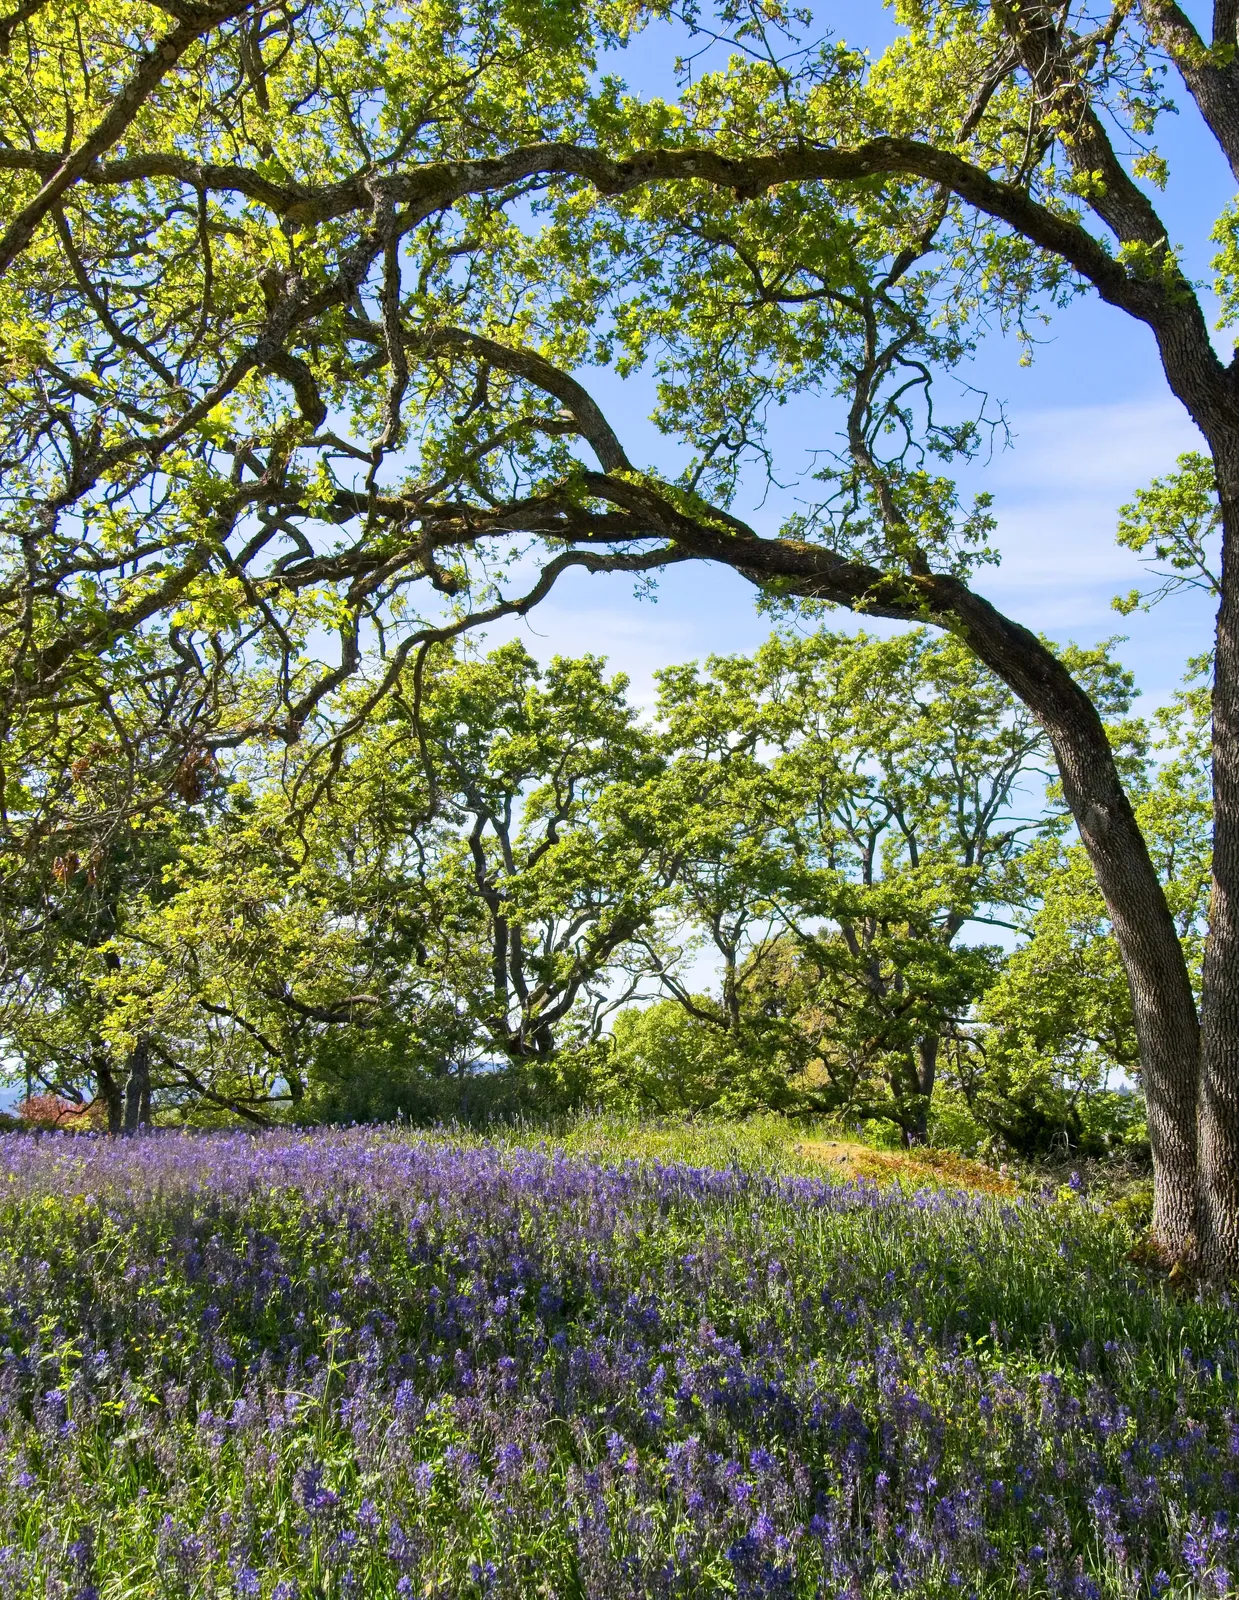
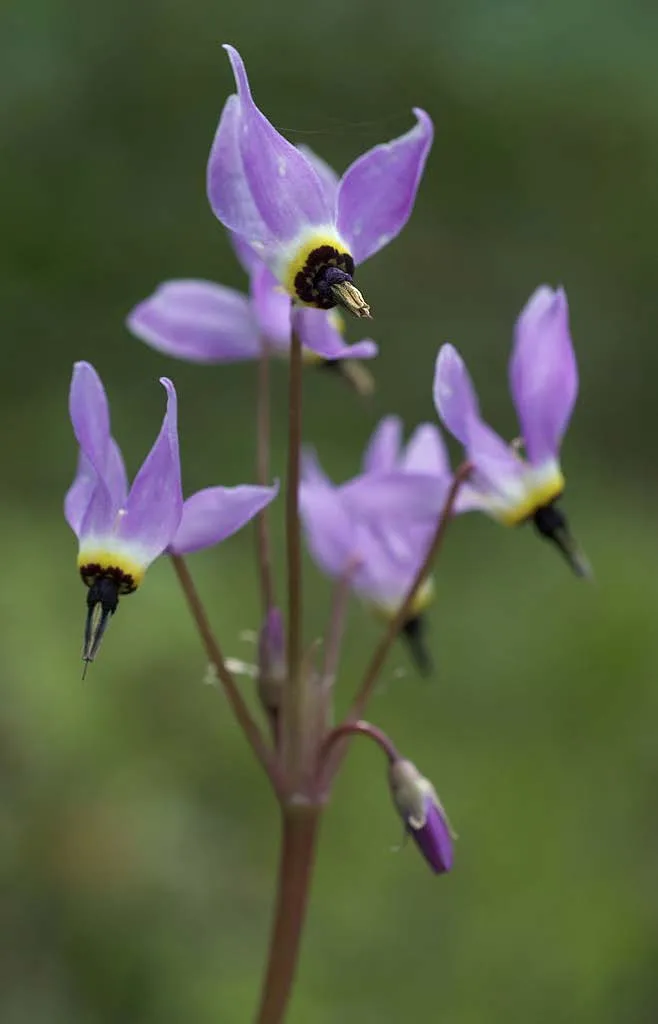
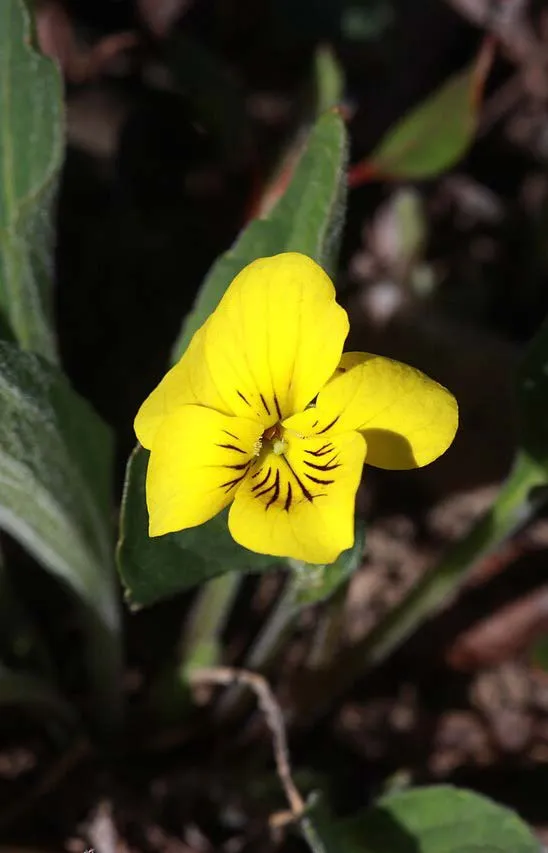
Garry oak meadow with purple wildflowers
Garry oak meadow (left) and wildflowers found in them (above).
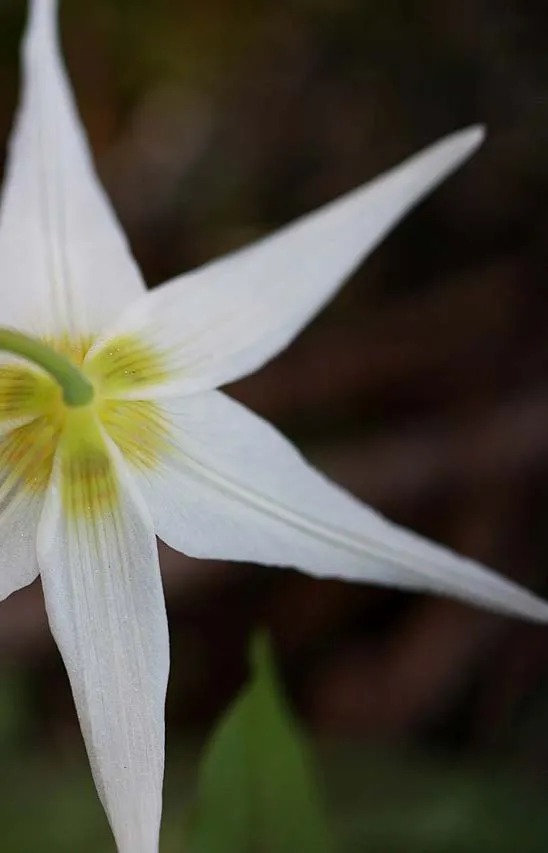
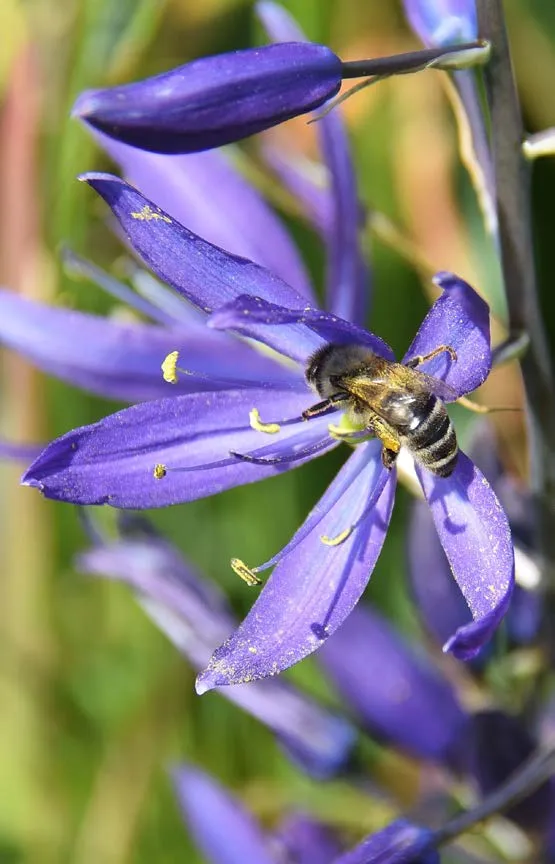
Left to right: Garry oak meadow (Pr2is), white fawn lily, bee on a camas flower, Henderson’s shooting star, and yellow montane violet.
Page 61–81
Garry Oak Ecosystems
View Royal is home to many of Canada’s rarest species and ecosystems. Garry oak meadows and savannas are home to over 100 native species, including plants and wildlife. Many do not occur anywhere else in Canada and often have threatened or endangered conservation status.
Garry oak ecosystems were widespread prior to colonization and were intentionally burned by local Host Nations using frequent low-intensity fires for food, such as berries, camas bulbs, and nuts. Over time, these landscapes were converted to farmland and residential uses, and Host Nations were prevented from using traditional land management practices. Fire suppression has led to the transition of some Garry oak meadows into Douglas-fir forests. Work is underway to further recognize the significance of cultural burns for maintaining the most biodiverse ecosystem in Canada.
View Royal’s Garry oak meadows have decreased in area by over 85% since 1800. This area will likely decrease further since the ecosystem faces encroachment by urban development and Douglas-fir forests. Remnants of this ecosystem are often small and interspersed with urban areas which limits the movement and establishment of plants and wildlife.
In 2022, View Royal sold almost ten hectares of land to the Capital Regional District (CRD) to support the creation of Mill Hill Regional Park. This decision helps protect the large concentration of species at risk contained within the resident Garry oak ecosystem. View Royal continues to protect rare Garry oak ecosystems through continued community development and is engaged in dialogues to further the community’s management of these culturally important landscape features.
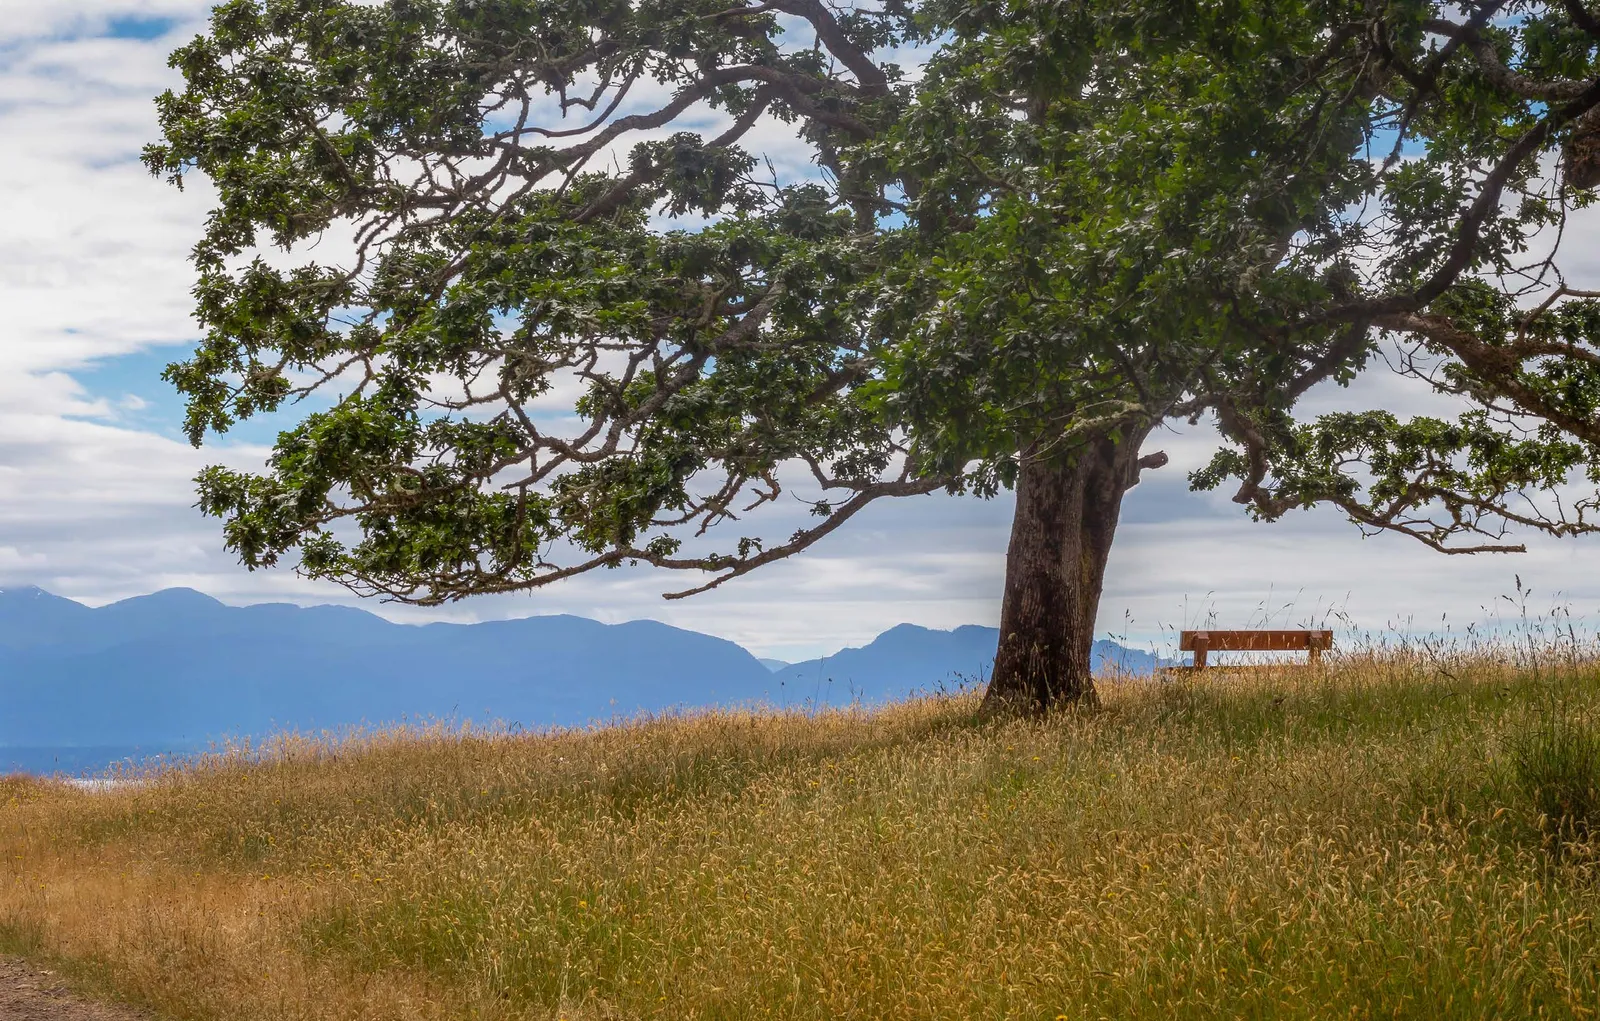
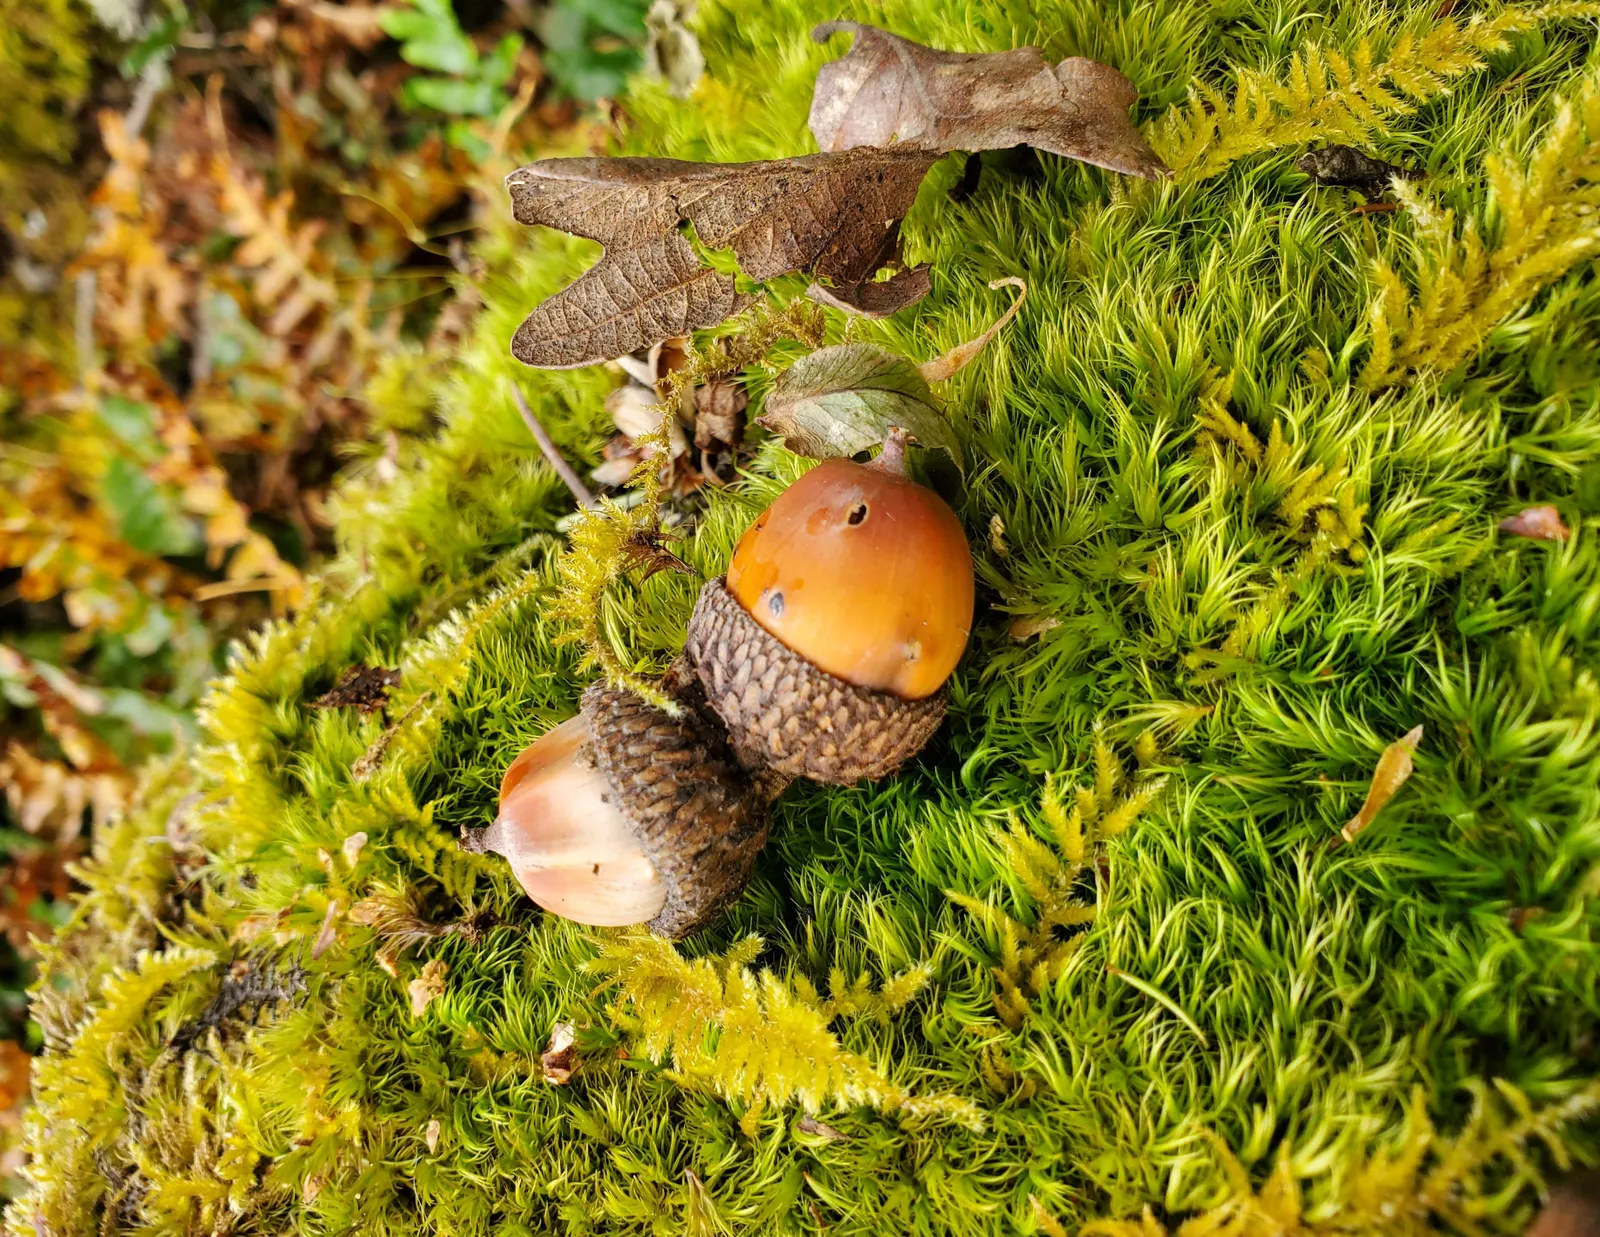
Garry oak tree in a meadow with a park bench and mountains in the backgroundTwo Garry oak acorns resting on green moss
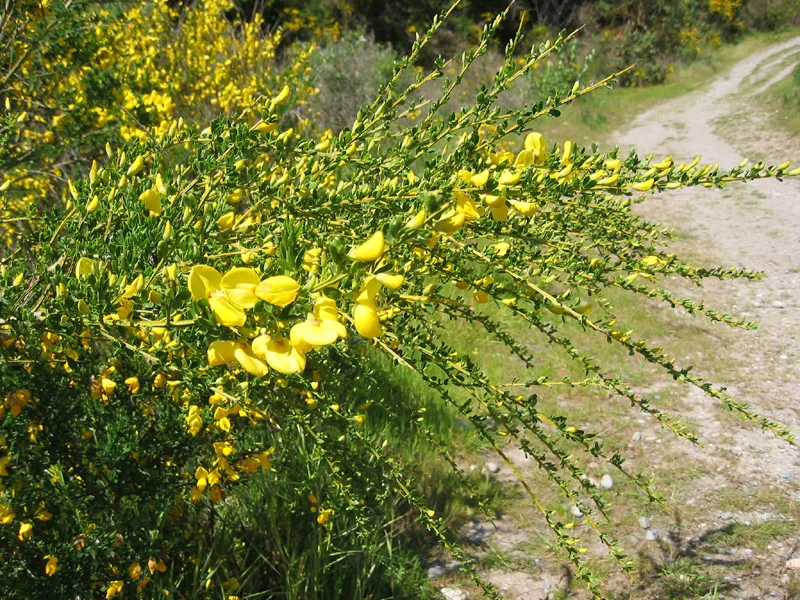
INVASIVE PLANTS
SCOTCH BROOM:Bright yellow Scotch Broom flowersArea of concern: Dry open areas. Introduced in 1850 as an ornamental, dense thickets of scotch broom are fire prone and can shade out the numerous rare native flowering plants that normally occur in more open Garry oak meadows.
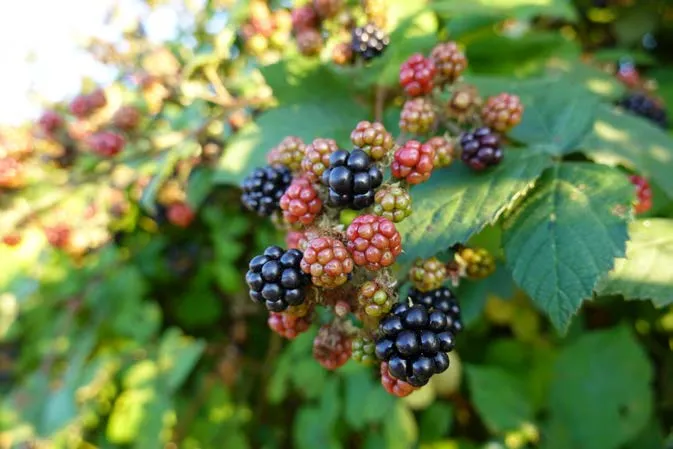
HIMALAYAN BLACKBERRY:Cluster of ripening Himalayan blackberriesArea of concern: Parks, roadways, riparian and natural areas. Intentionally introduced to produce edible berries, it is now spread profusely by birds and expands aggressively through vegetative growth. Along streams and rivers, it can increase erosion.
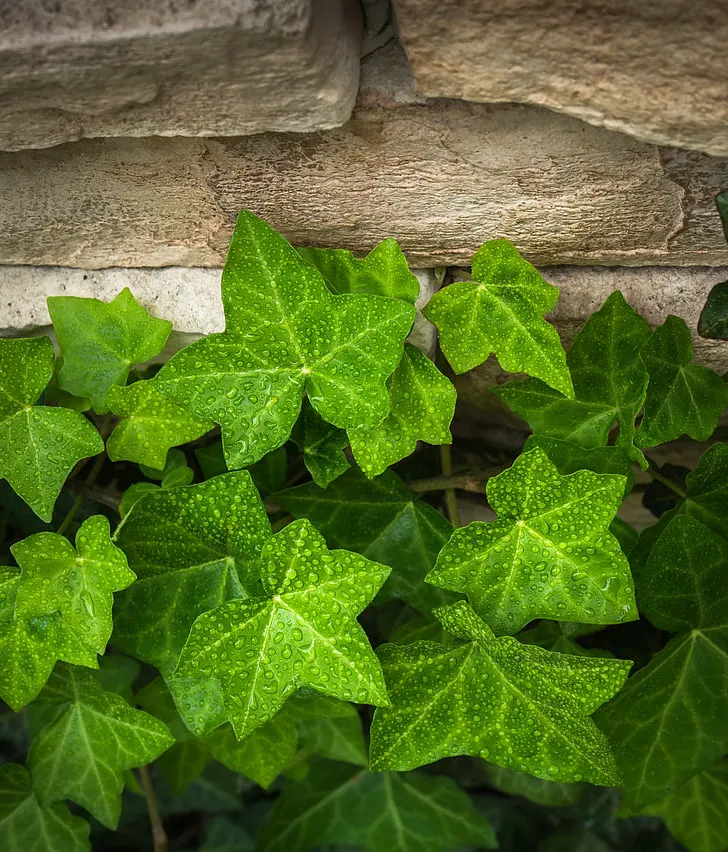
ENGLISH IVY:Wet English Ivy leaves covered in water dropletsArea of concern: Natural areas, edges. An ornamental plant that escaped from private gardens into natural areas that can smother native vegetation and reduce the lifespan of trees.
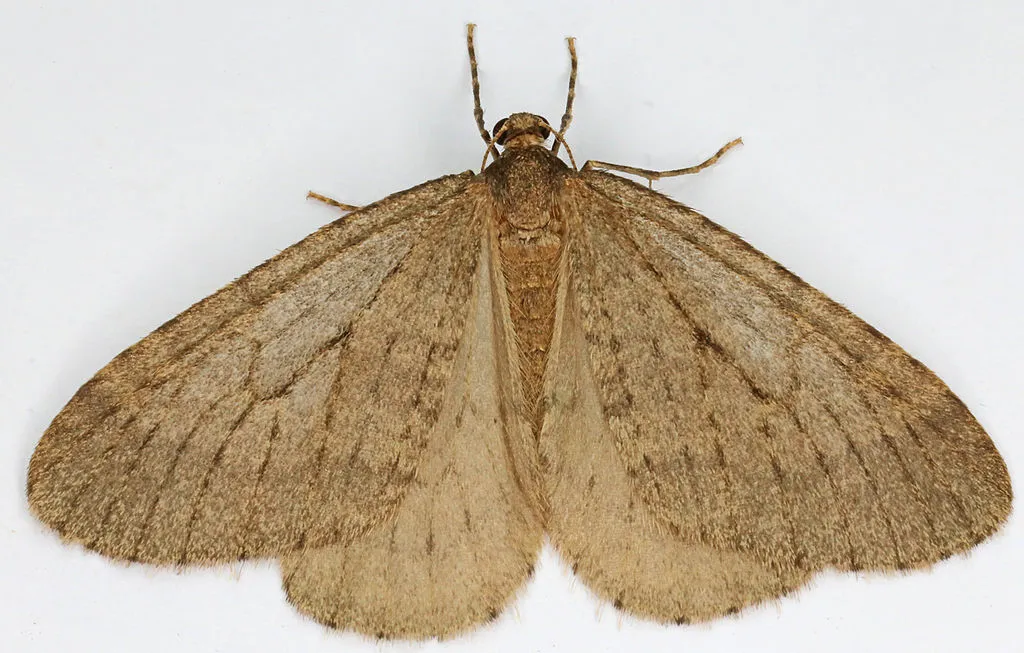
INVASIVE PESTS
WINTER MOTH:Close-up of a brown Winter Moth Introduced in the 1930s from Europe and Russia, arriving on Vancouver Island in 1970, it now threatens the Garry oak ecosystem where it feeds on young Garry oak buds. Target(s): Garry oak, Maples, Apples.
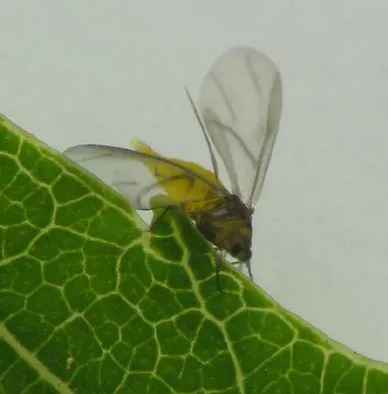
OAK LEAF PHYLLOXERA:Tiny yellow Oak Leaf Phylloxera insects on a leaf Introduced from Europe in the 1960s, it is a growing concern in the Pacific Northwest. The insect pierces and extracts nutrients from Garry oak leaves which can cause the leaves to drop prematurely. Up to 10% of the trees attacked by the pest die from repeated defoliation. Target(s): Garry oak, English oak.
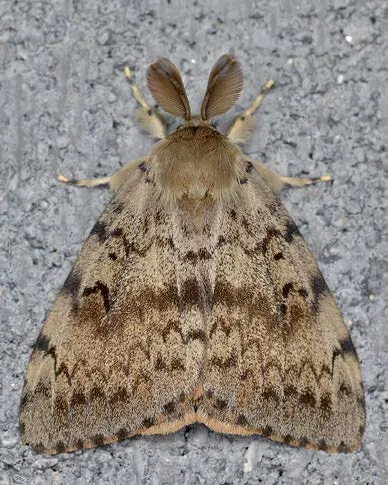
SPONGY MOTH:Close-up of a brown Spongy Moth Introduced to North America around 1868, the moth has been found in Garry oak trees and can completely defoliate them. This can kill trees if repeated over multiple years, reducing the establishment of new trees, and impacting the health of older trees, which also affects the species that depend on them. Target(s): Hardwoods.
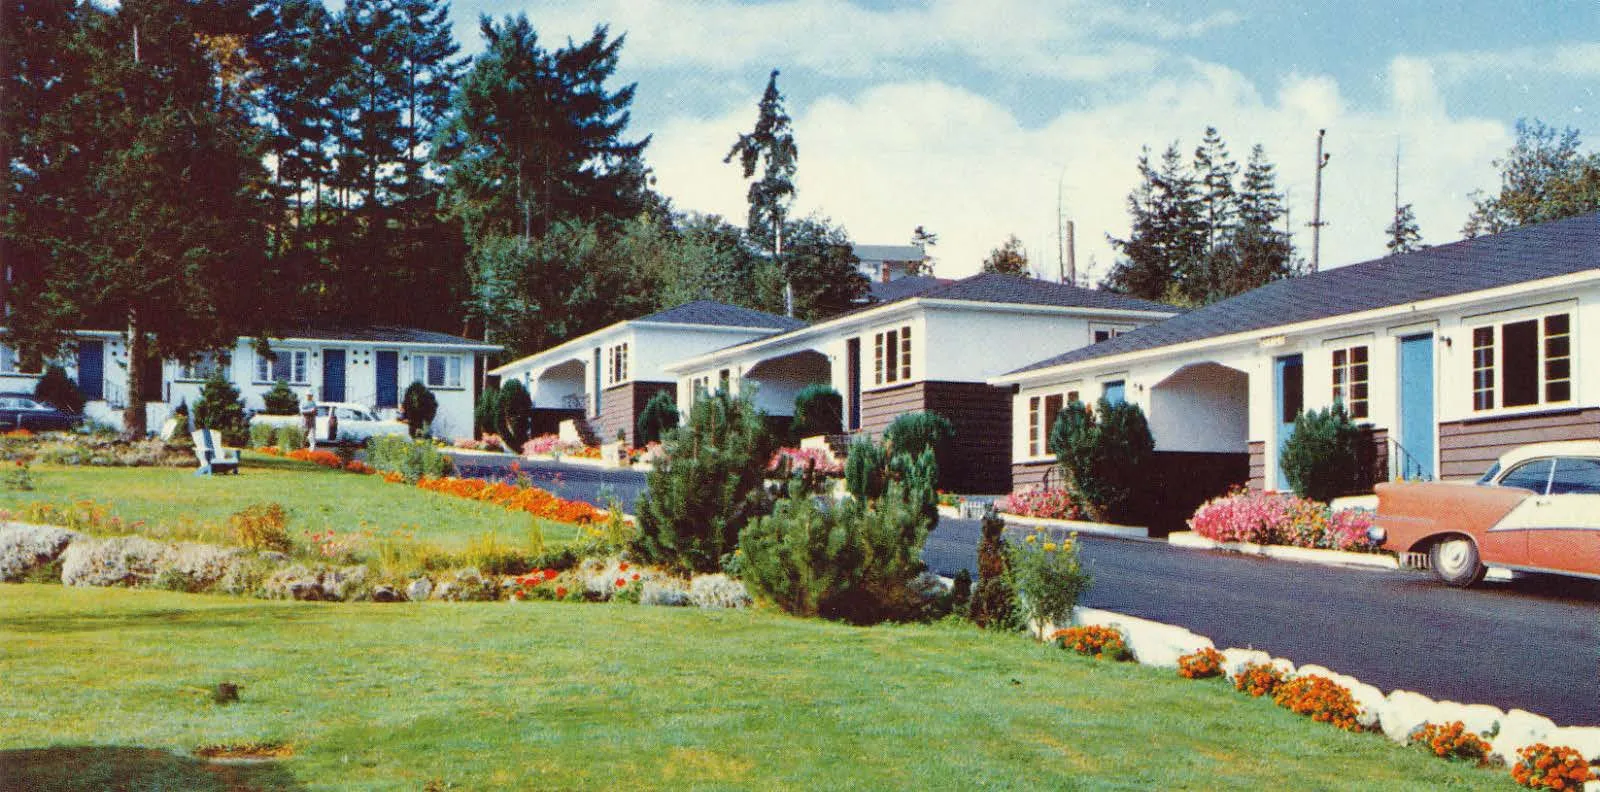
Historical hand-colored photograph showing small houses with gardens and a vintage car
2.2 History and Timeline
Time immemorial
The Xwesepsum and Songhees Nations have stewarded the lands and waters in and around View Royal for thousands of years. Indigenous land management, including burning and food cultivation, made the area’s creeks and meadows rich in berries. Streams were used as paths by traditional bark harvesters and led back to food-gathering areas.
Colonial land management practices have had dramatic impact on Indigenous relationships with this landscape. Urban forest management can serve as an outlet to integrate Indigenous values, perspectives, and thousands of years of land management knowledge back into the management of these lands. The Town is working to further dialogues with local Nations, and will explore opportunities to support reconciliation and culturally sensitive management practices through implementation of this Strategy.
European Arrival
Captain James Douglas arrived at Clover Point in what is now the City of Victoria in the 19th century. The Puget Sound Agricultural Company, a subsidiary of the Hudson’s Bay Company, began farming along Esquimalt Harbour shortly after Douglas’s arrival, transitioning the fur trading economy to an agricultural economy. For much of its history, View Royal’s agricultural community fuelled the growth of urban centres like Victoria and Vancouver.
Urban development in the 1930s around Esquimalt Harbour and Portage Inlet was initially accompanied by market gardens and nurseries in its lowlands until the aftermath of WWII. New residents introduced new and exotic trees and plants, featuring familiar foliage, flowers, and fruits from their places of origin. While some early settlers retained Garry oak meadows on their property, View Royal’s growth began in earnest in the 1960s and 1970s, reducing the abundance of native trees and ecosystems within the community. In its transition from an agricultural community to an attractive getaway destination, View Royal has more than doubled its initial population since that time.
Page 61–81
2.3 The Urban Forest Today
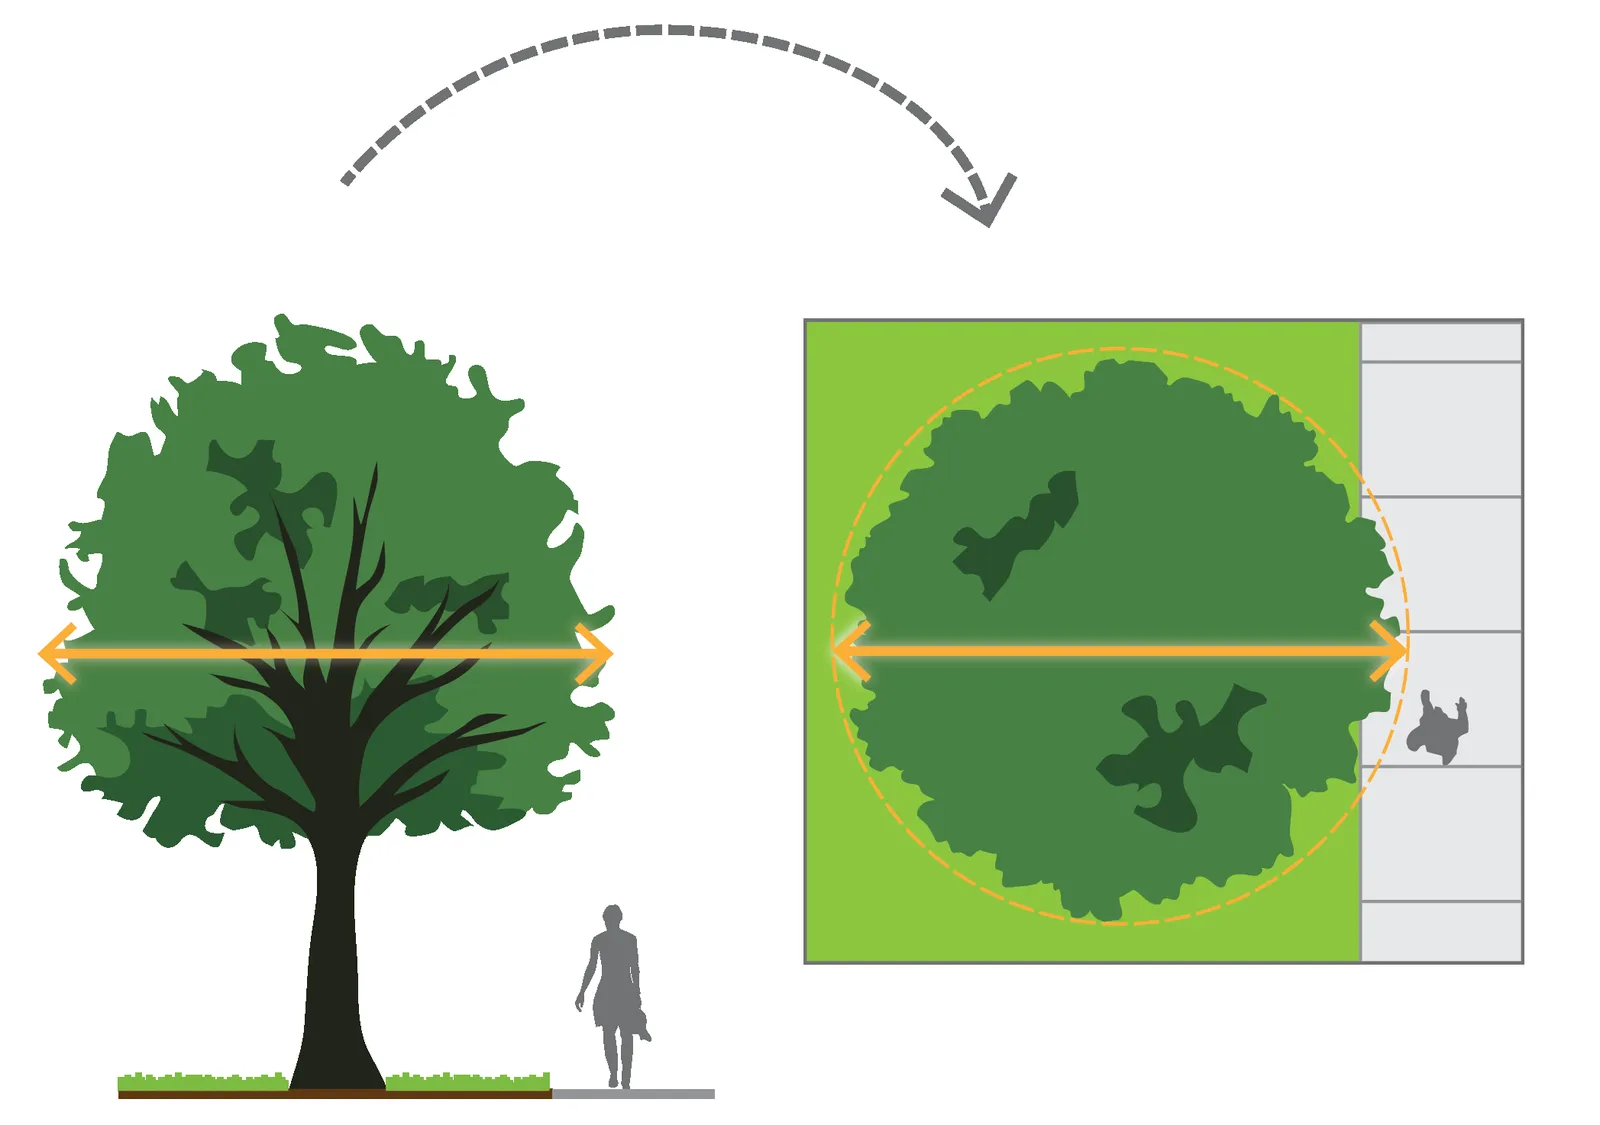
Canopy Cover
A tree’s canopy cover is the area occupied by leaves or needles when viewed from above (Figure 6). In BC and across Canada, canopy cover is increasingly being used to monitor the growth or decline of community urban forests over time. Canopy cover can be summarized by different spatial areas, often including neighbourhoods, land uses, or ownership types. This type of analyses supports insight into how the urban forest is distributed across the community, and can help shape the development of policy and land use regulations toward achieving a defined canopy cover target.
View Royal’s canopy cover in 2019 and 2023 were measured using 2019 LiDAR (Light Detection and Ranging) data, as well as 2019 and 2023 high-resolution imagery. Canopy layer processing was supported by machine learning methods.
While some canopy analyses below are provided Townwide for context, most focus on its Urban Containment Boundary (UCB) which the Town has a greater ability to influence.
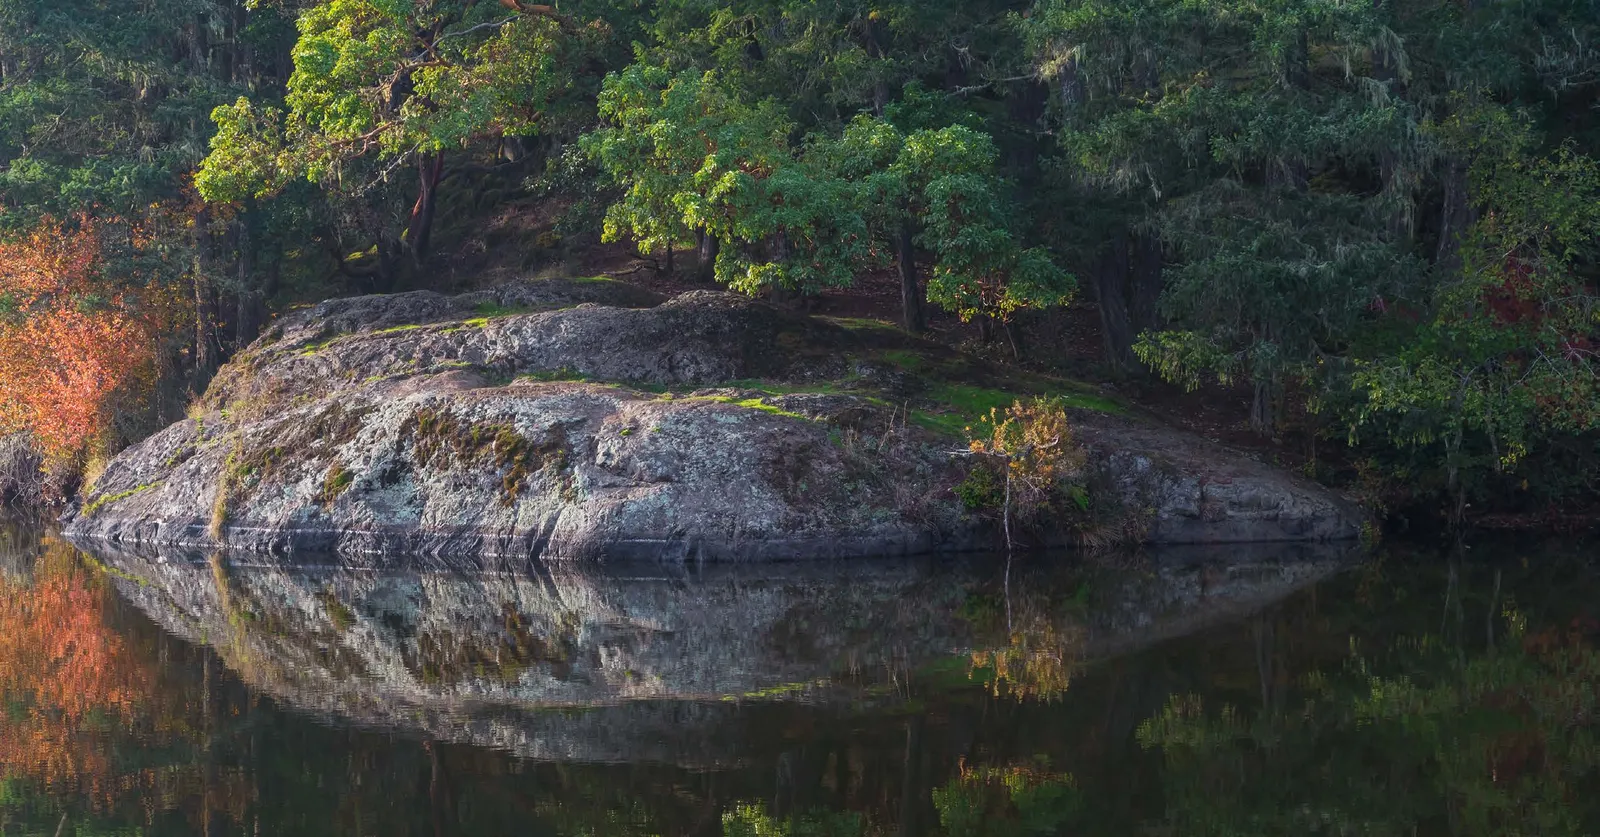
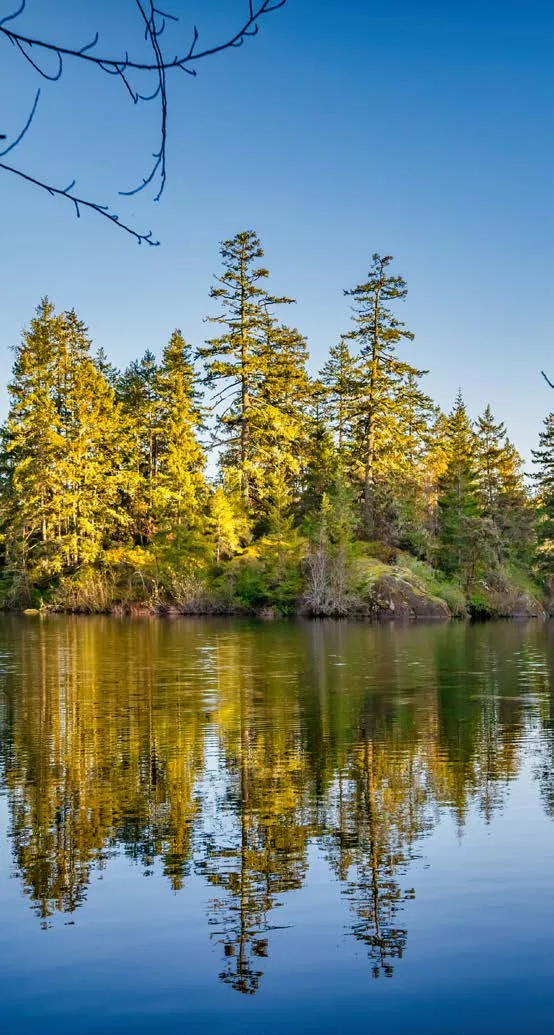
Reflection of a forested shoreline in a calm body of water
In 1993, Thetis Lake Regional Park was created to protect 921 ha of native forests and freshwater lakes within View Royal’s municipal area, but outside of its Urban Containment Boundary. Today, the Park is managed by the CRD, and supports a wide range of recreational opportunities such as cross-country skiing, swimming, running, and cycling.
Despite dramatic change, View Royal’s native forests and waters continue to be a critical part of our community fabric. Without our trees and forests, View Royal would feel like a very different place than the one we have come to know and love.
View Royal’s Canopy Cover: 29%*
*162 ha in 2023 within the Urban Containment Boundary.
Diagram illustrating how canopy cover is measured from a side view and a top-down view
Figure 6. Canopy cover refers to the leafy upper part of trees when viewed from above (right)
Tall coniferous trees reflected in the still water of a lakeView of a forest across a calm lake under a bright skyDirt road winding through a dense, lush green forestSmall waterfall flowing over mossy rocks in a forest
Community-wide
In 2023, canopy cover within the Urban Containment Boundary (UCB) was 29% (162 ha), down from 31% in 2019. This section explores canopy patterns within the following spatial units:
Neighbourhood: Trends in canopy cover across View Royal’s neighbourhoods
Land ownership: Patterns of canopy cover across land ownership.
Land use: Variation in canopy cover across different land uses.
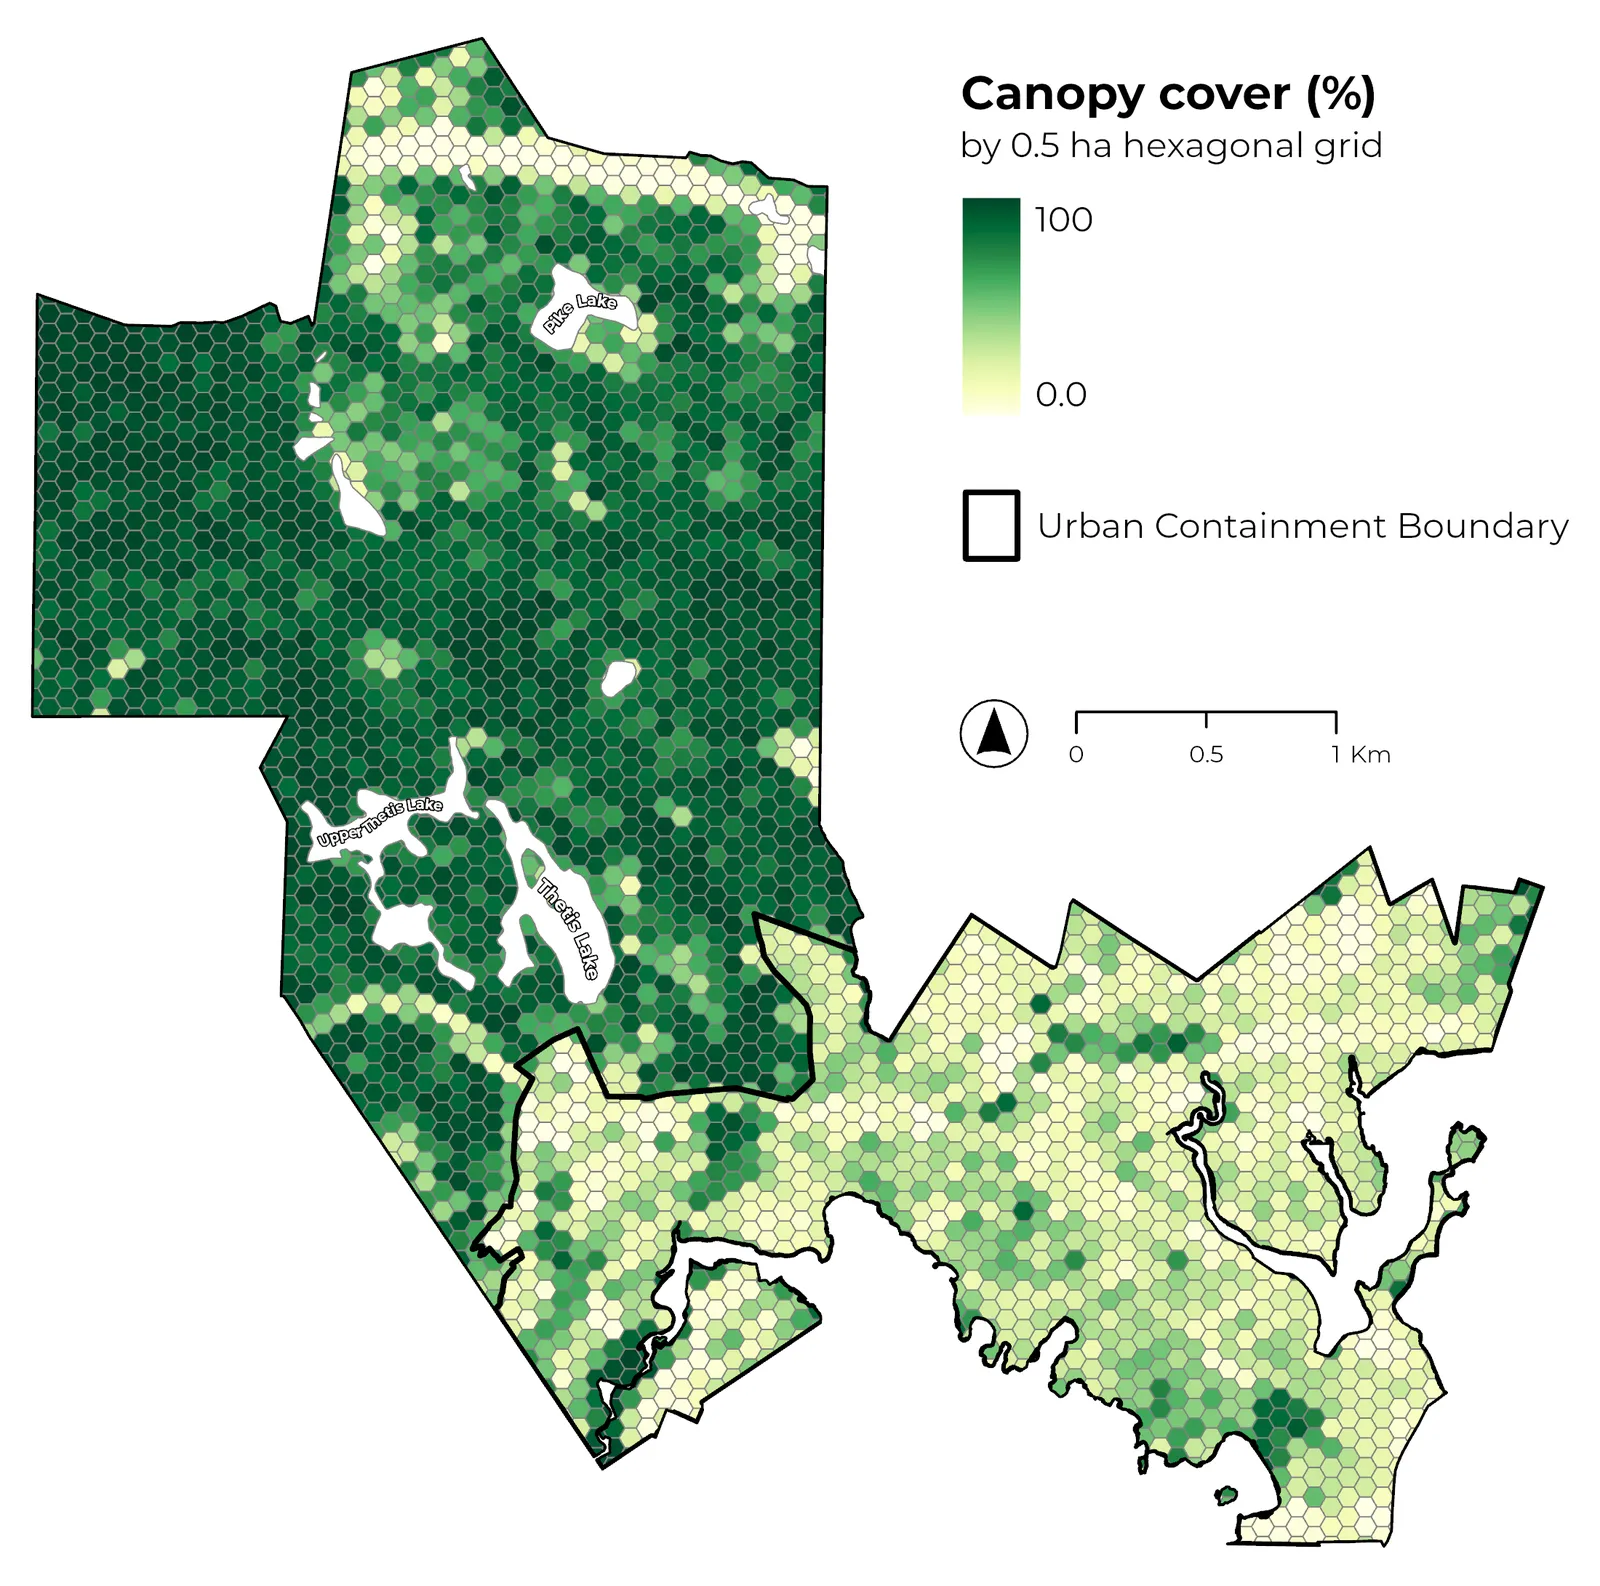
Map of View Royal showing canopy cover percentages using a hexagonal grid
Figure 7. Town-wide canopy cover in 2023 with the UCB
By Neighbourhood
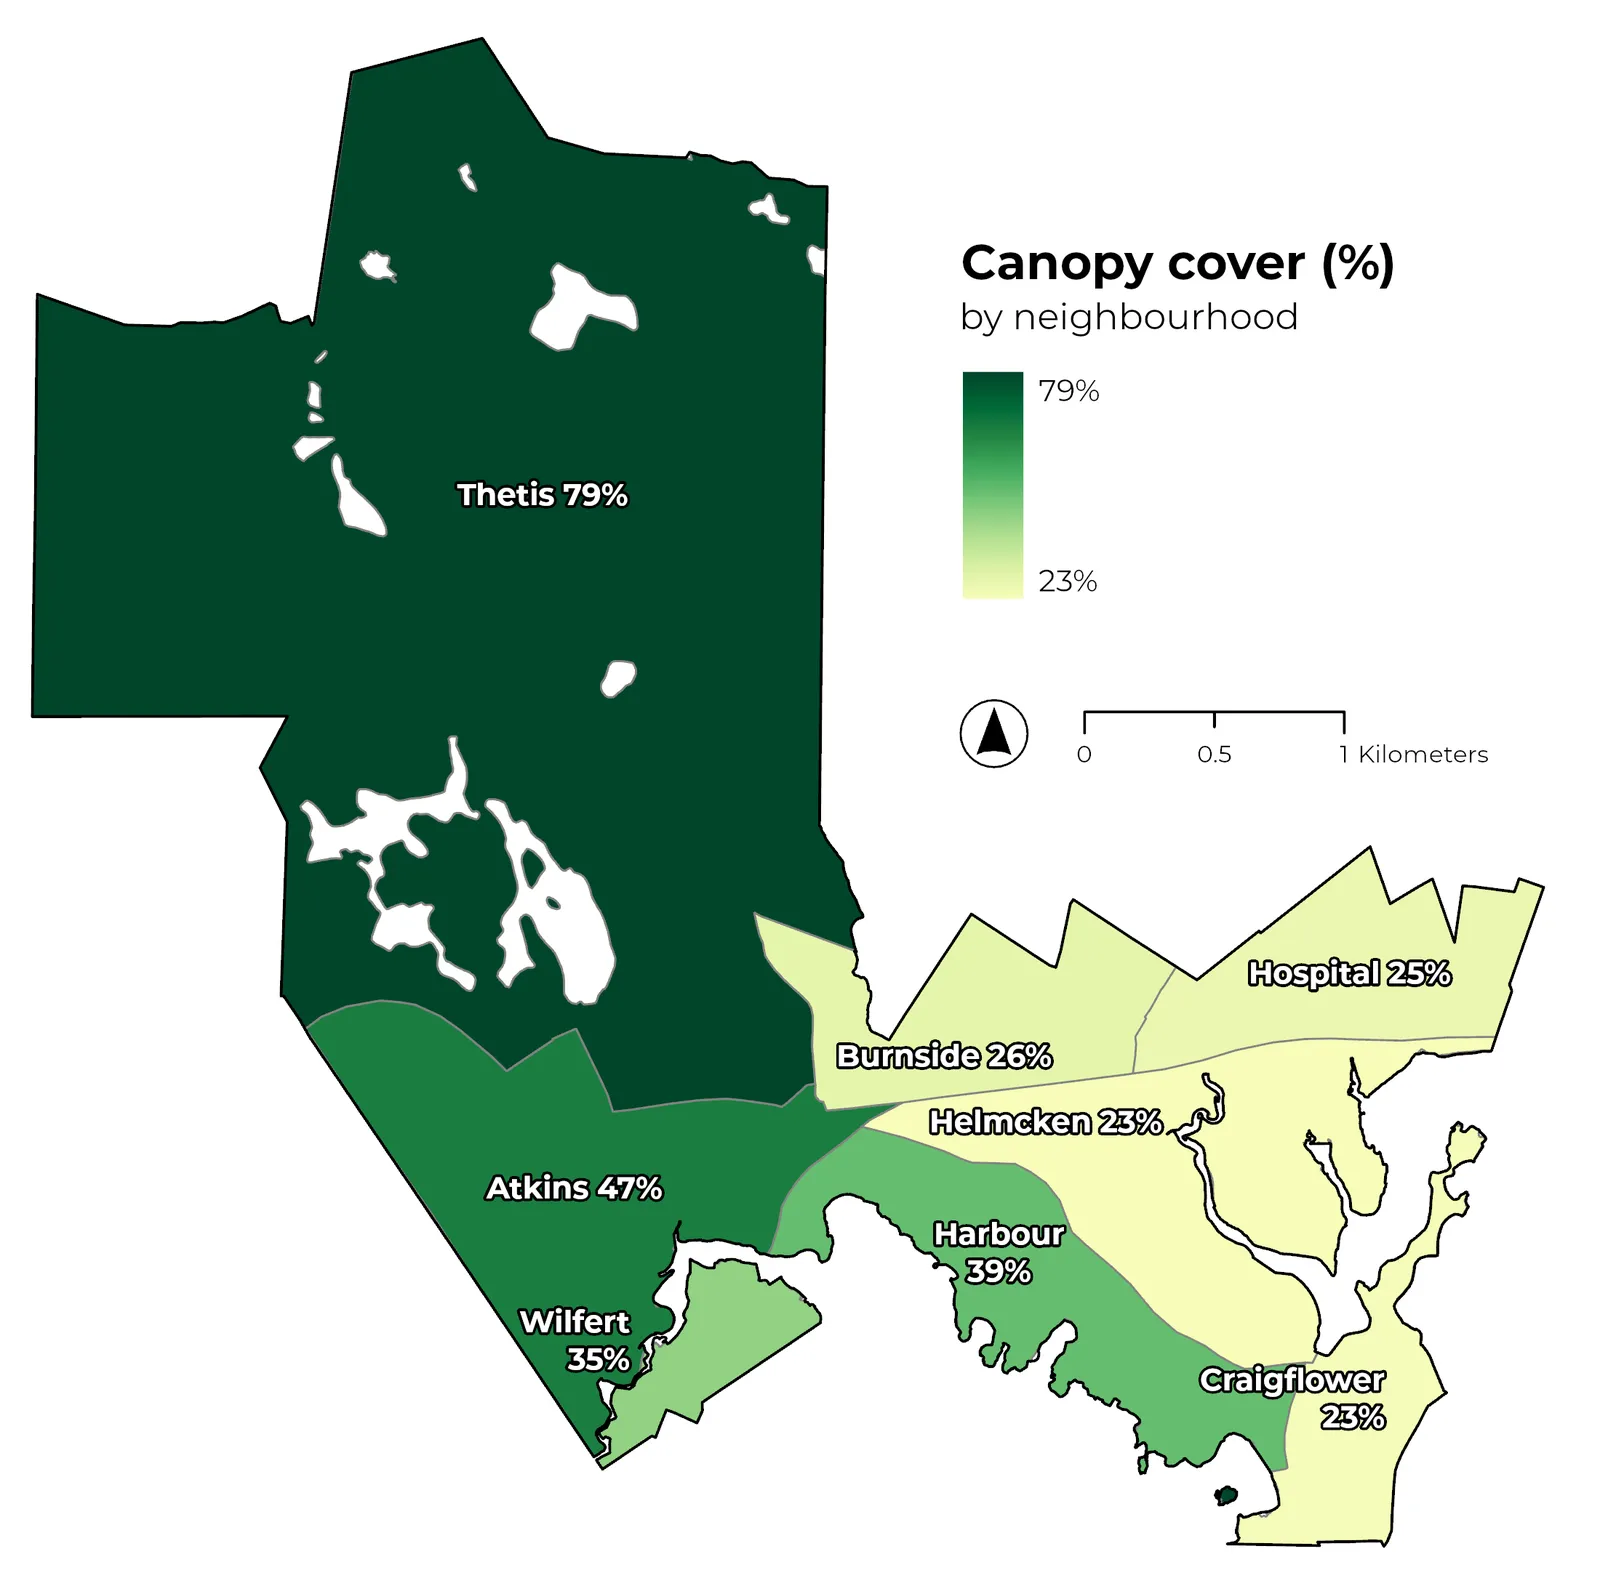
Canopy cover varies widely, from 79% in Thetis—due to extensive parkland—to 23% in Craigflower and Helmcken, which are more urbanized and have fewer trees (Figure 8). Thetis (79%) and Atkins (47%) maintain high cover due to nearby Regional Parks. Harbour also shows relatively high canopy (39%) due to larger, older residential lots that support mature trees. In contrast, Craigflower and Helmcken, developed more recently with more intensive land use, show lower canopy.
From 2019 to 2023, canopy declined in all neighbourhoods within the UCB. Most saw reductions of 3–5%, but the Hospital neighbourhood experienced an 11% drop. Since most canopy cover lies outside the UCB in CRD-managed regional parks, small losses within the UCB significantly affect urban tree canopy—especially in residential areas where the loss is more noticeable and impactful to the public.
Map showing the 2023 canopy cover percentage for different neighborhoods in View Royal
Figure 8. Canopy cover by neighbourhood in 2023
Canopy Trends
View Royal has a community-wide canopy cover above that of many peer communities (60%), and slightly lower than average canopy cover (29%) within the Urban Containment Boundary (UCB) (Figure 9). High canopy coverage across the community is largely attributed to the extensive tree cover in Thetis Lake Regional Park and Mill Hill Regional Park (Figure 7). Within the UCB, the low canopy cover is due to urban land uses such as roads and housing, as well as commercial and institutional uses.
Figure 9. Citywide and UCB canopy cover comparison with municipalities in the region
City of Port Moody (2019): Urban: 45%, % Community-wide: 58%
City of Maple Ridge (2022): % Urban: 39%, Community-wide: 54%
City of Coquitlam (2022): Urban: 33%, Community-wide: 52%
City of Burnaby (2022): Urban: 32%, Community-wide: 32%
City of Langford (2023): Urban: 30%, Community-wide: 48%
Town of View Royal (2023): Urban: 29%, Community-wide: 60%
City of Victoria (2023): Urban: 28%, Community-wide: 28%
City of Vancouver (2022): Urban: 25%, Community-wide: 25%
City of North Vancouver (2021): Urban: 20%, Community-wide: 20%
Canopy Change
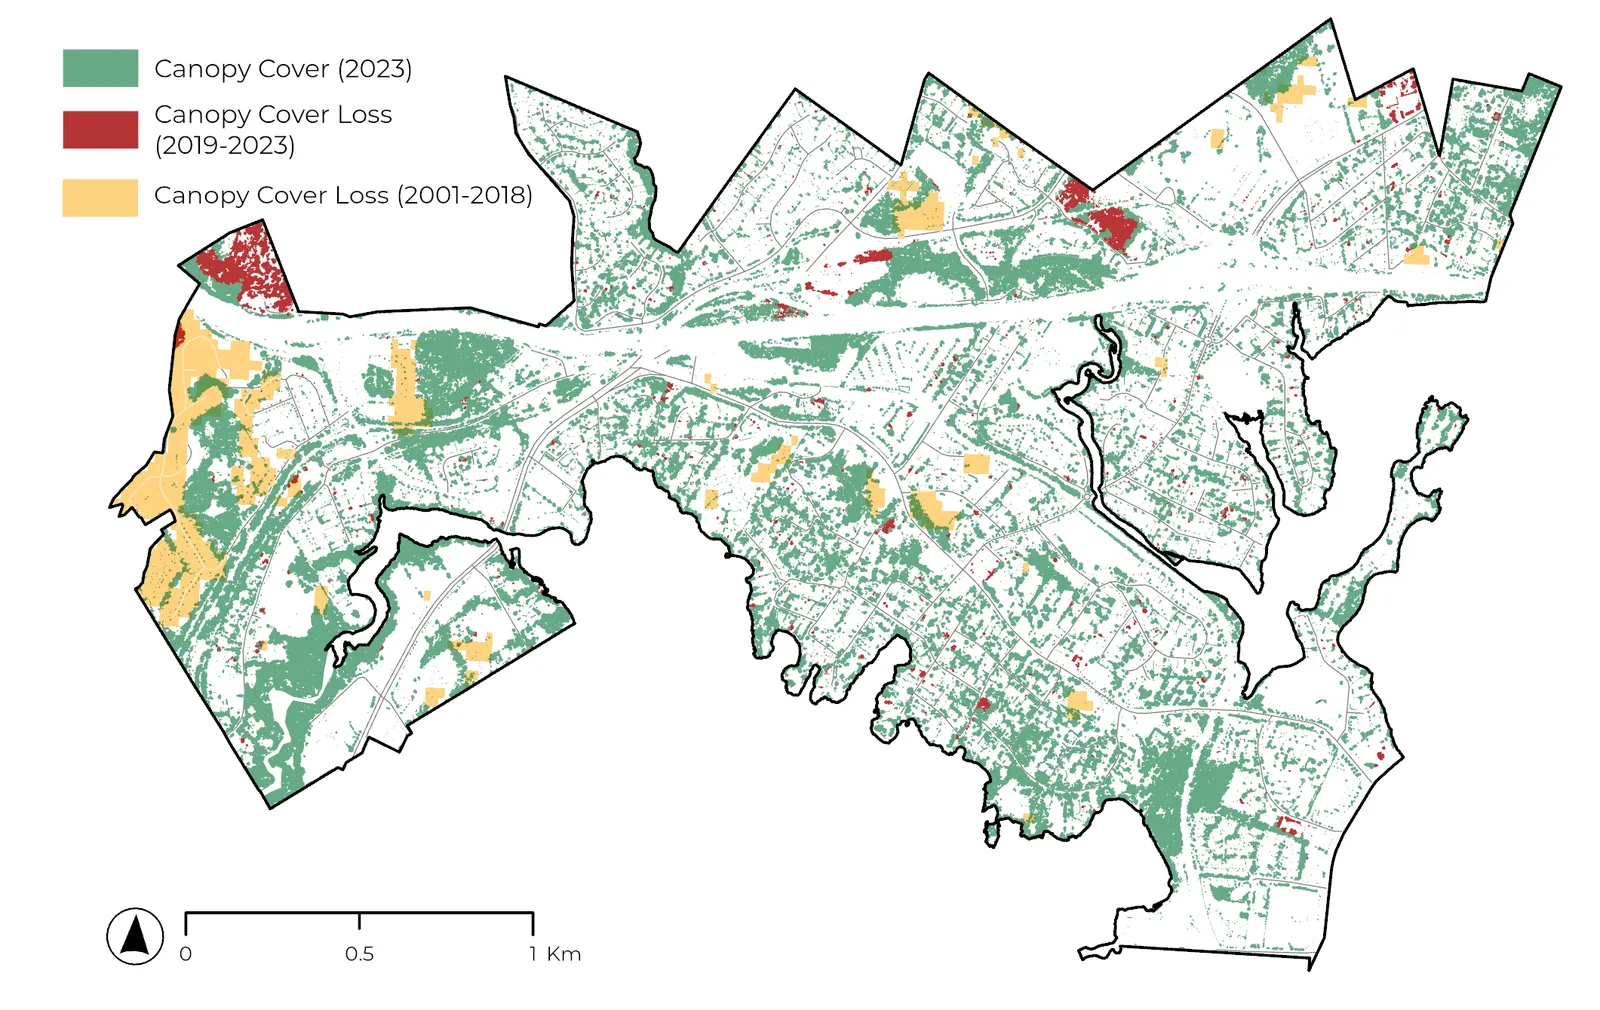
Most canopy cover loss in View Royal between 2019 and 2023 has occurred within the UCB, which does not include Thetis Lake Regional Park. Its canopy cover declined from 31% in 2019 to 29% in 2023 (Figure 10). This amounts to a compounding annualized rate of loss of roughly 1.1% over that period. Loss was generally consistent across neighbourhoods, ranging from 3–5%, and was typically localized, tied to specific large development projects rather than community-wide changes.
The Hospital neighbourhood experienced a sharper decline (11%) due to significant recent developments. Greenfield development in Mixed Residential areas saw even higher losses (22%). Together, large greenfield projects and smaller infill developments have contributed to notable canopy loss within the UCB over the past two decades.
As View Royal is now largely built out within the UCB, future growth—including 585 mandated housing units for over 3,200 new residents (a 25% increase over 25 years, or 0.9% annually)—will rely on urban intensification. This represents an acceleration from the past five years, during which canopy cover fell by 2%. Without intervention, increasing development may further erode canopy cover.
Tree removal to support the achievement of View Royal’s housing target will occur, but development and canopy retention are not mutually exclusive. Careful design, policy interventions, and strong urban forest management will be required to preserve or restore canopy cover. The Town will need to prioritize not only tree protection but also initiatives that support tree canopy within new development following construction.
Map of View Royal's Urban Containment Boundary showing areas of canopy cover and canopy loss
Figure 10. Canopy cover loss within the Urban Containment Boundary from 2001 - 2023
3-30-300 Rule
The 3-30-300 rule has been proposed as an intuitive target that can be used by municipalities to increase access to the benefits that the urban forest provides. It states that each building should have at least three trees within view, that canopy cover in temperate climates should be at least 30%, and that all residents should have access to greenspace within 300m of their homes.
By Ownership
More than half of View Royal’s total canopy cover is in Thetis Lake and Mill Hill Regional Parks, managed by the Capital Regional District (CRD). These protected parks will continue providing sizable canopy contributions to View Royal’s urban forest in years to come. Within the UCB, over 58% of all canopy cover is located on private property, which is an ownership that makes up 59% of the Town’s land base (Figure 11). This statistic highlights the critical role of private landowners in shaping the Town’s canopy future, whether through loss or regeneration.
Page 61–81
Municipal lands support above-average canopy cover. Though they make up 28% of the UCB land area, they account for 31% of its canopy cover—driven largely by the Town’s Parks system. Provincial lands, including the Trans-Canada Highway, Victoria General Hospital (VGH), and schools, cover a notable portion of the Town but feature low canopy cover. Although the Town has limited influence over these lands, they represent important opportunities for future canopy expansion, especially in settings where trees offer proven public benefits.
Figure 11. Proportion of View Royal’s urban (UCB) canopy cover and land area by ownership type (left), and canopy cover within that ownership type (right) in 2023
Ownership
UCB Canopy Cover
UCB Land Area
Ownership Canopy Cover
Private
58%
59%
28%
Municipal
31%
28%
32%
Provincial
10%
12%
24%
Regional
1%
1%
29%
By Land Use
View Royal’s Official Community Plan (OCP) provides a high-level vision for growth, shaping land use and development patterns that affect tree retention and planting potential. The UCB’s largest land uses—residential, parks, road rights-of-way (ROWs), large-lot and mixed residential, and community facilities—also host most of the Town’s canopy cover (Figure 12). Residential areas make up 24% of the UCB and hold an equal share (24%) of canopy. Parks, while only 9% of the land, contribute 19% of canopy. ROWs, with lower average canopy (19%), still provide 16% of the total due to their extensive reach.
Higher-density land uses such as Intensive and Neighbourhood Mixed Use provide just 4% of total canopy cover, reflecting their smaller land footprint. Commercial areas, often dominated by surface parking, average 13% canopy cover and contribute just 2% to the total. Analyzing canopy by land use helps identify where policy changes or development regulations could most effectively increase future canopy across the Town.
Figure 12. Proportion of View Royal’s urban (UCB) canopy cover and land area by land use (left), and canopy cover within that land use (right) in 2023
Land Use
UCB Canopy Cover
UCB Land Area
Land Use Canopy Cover
Residential
23%
24%
27%
Park
19%
9%
59%
Right-of-Way
16%
24%
19%
Large Lot Residential
14%
9%
42%
Mixed Residential
12%
13%
26%
Community Facility
9%
9%
29%
Rural
2%
1%
47%
Intensive Mixed Use
2%
3%
18%
Neighbourhood Mixed Use
2%
3%
19%
Commercial
2%
4%
13%
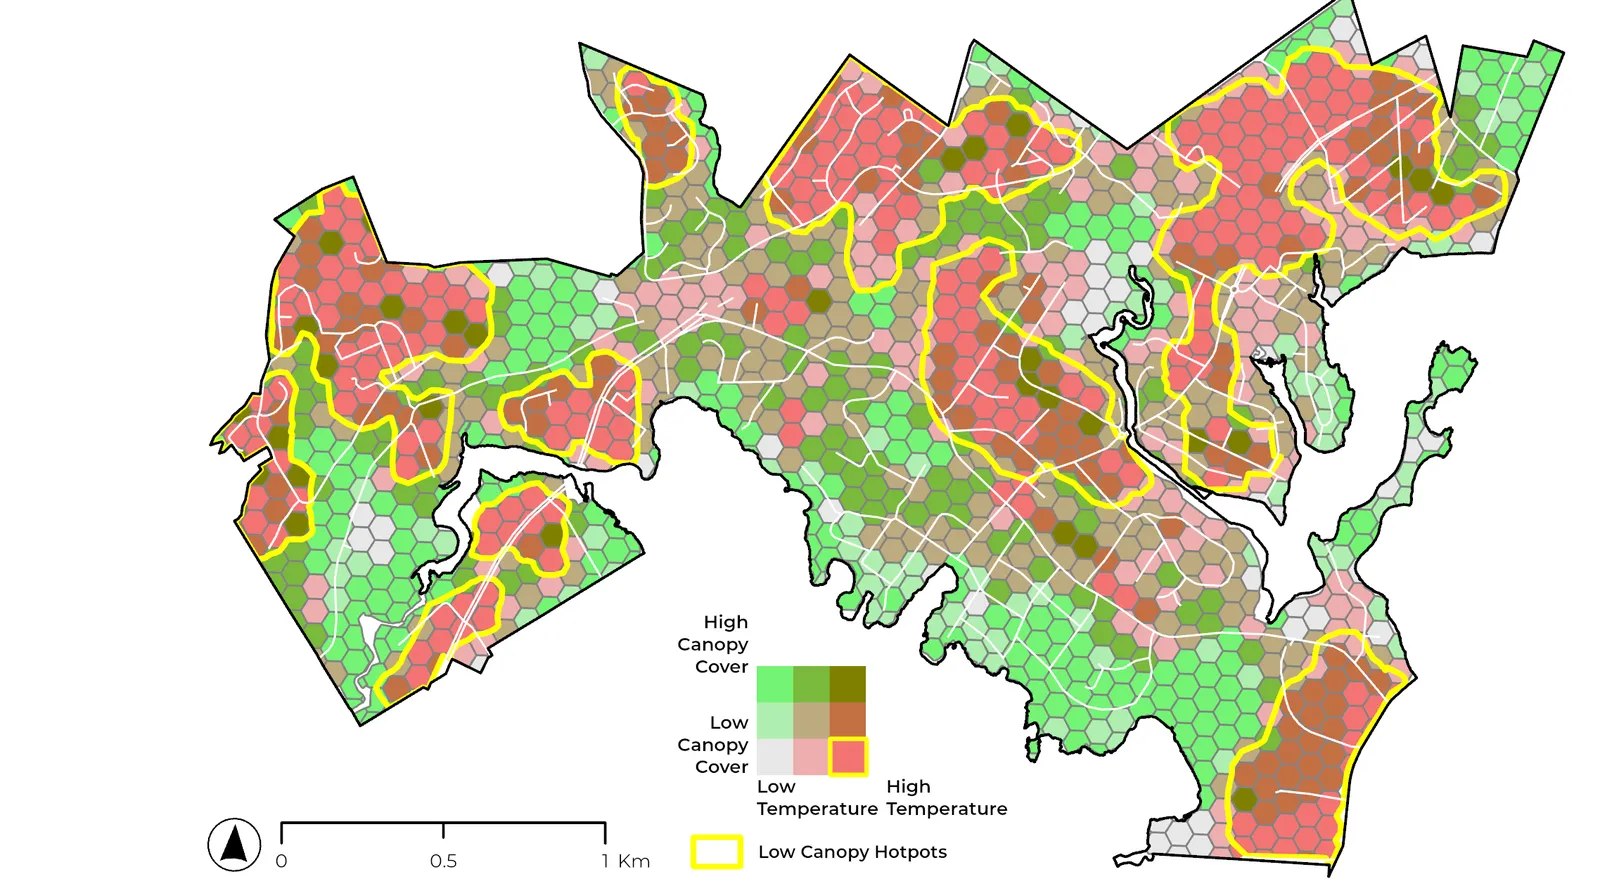
Urban Heat
Reducing the urban heat island (UHI) effect is a particularly important ecosystem service, yet it is difficult to assign a fiscal value to because its impacts extend across human health, biodiversity, and infrastructure. Urban trees help mitigate the UHI effect by providing shade and through transpiration. In contrast, impervious surfaces such as roads and buildings — which dominate in urbanized neighbourhoods with limited canopy —absorb heat during the day and release it gradually overnight.
In View Royal, some neighbourhoods experience higher land surface temperatures than others. Figure 13 highlights the Town’s Low Canopy Hotspots: areas with both limited tree cover and elevated surface temperatures. These hotspots are often associated with large expanses of surface parking (e.g., in commercial or institutional areas) or with newer, denser residential subdivisions where smaller lot sizes limit available space for tree planting.
Map of View Royal showing Low Canopy Hotspots in yellow over a hexagonal grid of canopy cover and temperature
Figure 13. Low Canopy Hotspot (LCH) mapping within View Royal
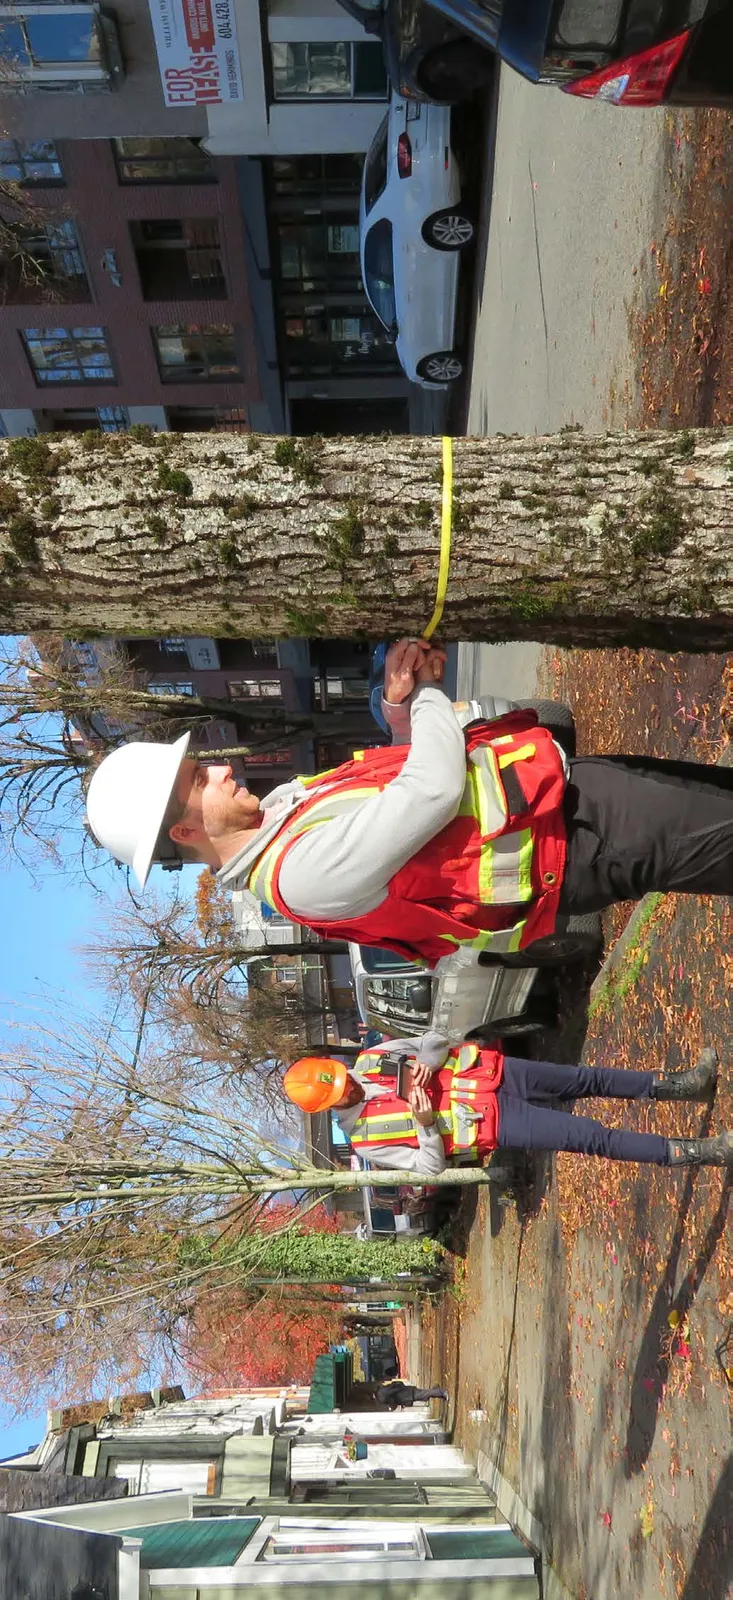
Street Tree Inventory
The Town of View Royal maintains an inventory of more than 1,200 municipal boulevard trees (i.e., trees located within the Town’s right-of-ways/roads), including the location and genera of those trees. View Royal’s inventory encompasses 35 genera and 46 species, of which roughly one in three trees are presently maple (Figure 14). Most are red maple specifically (25%), and cherries and plums (9%), dogwoods (8%), and oaks (8%) are also common.
While the inventoried boulevard trees only represent a small proportion of all trees in View Royal, the dominance of maples is common within North American municipalities and is likely reflective of the broader planted tree population. Overuse of a single genus, and certainly a single species, is typically thought to reduce the resilience of a tree population through increasing exposure to singular pests, disease, and/or stressors. Eastern Canada has seen the consequences of limited urban tree diversity through the fallout of emerald ash borer and Dutch elm disease before it. By prioritizing diversification of planting stock, communities can build passive resilience by decreasing the representation of any single species or genus, and therefore the impact of the pests and diseases that they may host.
The value of a current and quality public tree inventory system cannot be overstated. Real insights into the condition, composition, and health of the Town’s trees are invaluable to operational planning and would help shape a data-driven approach to urban forest management.
30-20-10 Rule
The 30-20-10 rule is a species diversity recommendation that is used to help increase the resilience of the urban forest. It states that no family should compose more than 30% of the urban forest, that no genus more than 20%, and that no species should occupy more than 10%. This helps build resilience to pests and diseases which often target individual species or genera, or a small subset of them.
Man in a hard hat and safety vest measuring a tree trunk with a tape measure while another worker looks on
Figure 14. The relative proportion of genera included in the Town’s inventory of street trees (1222)
Maple: 33%
Cherries & Plums: 9%
Unknown: 8%
Dogwoods: 8%
Oaks: 8%
Pseudotsuga: 4%
Magnolias: 4%
Spruces: 4%
Cedars (Thuja): 3%
Sweetgums: 3%
Katsuras: 2%
Pines: 2%
Firs: 2%
Horse Chestnuts: 2%
Linden: 2%
Forested Areas
View Royal is home to native forest ecosystems unique to Canada, including the Coastal Douglas-fir and Garry oak meadow ecosystems. Thetis and Mill Hill Regional Parks alone contain more than half of the community’s urban forest canopy, underscoring the critical role of forested areas in maintaining the Town’s canopy cover. View Royal’s forested areas presently face various pressures, including the spread of invasive plants, climate change, and development.
View Royal is situated within the Coastal Douglas-fir Moist Maritime Biogeoclimatic subzone (CDFmm). The CDFmm is a unique set of ecosystems that occur in south-east Vancouver Island, portions of the Gulf Islands, and pockets along the south coast and mainland of British Columbia. Vancouver Island’s rain shadow, which supports a Mediterranean-like climate allows for a rich flora and fauna to thrive.
Page 61–81
The CDFmm’s namesake tree is the coastal Douglas-fir, which is the dominant species in much of View Royal’s forests. Douglas-fir tolerates a variety of site conditions and can be found in association with most native tree and understory species present in View Royal. Understory plants like Oregon-grape, oceanspray, salal, snowberry, honeysuckle, saskatoonberry, sword fern, bracken, and bald hip rose, along with mosses, lichens, mushrooms, give colour and life to these forests. The Town’s largest, and likely oldest, trees tend to be found on sites with deeper soil horizon or where water is abundant (e.g., riparian zones), and on sites afforded the long-term protections offered by parks and protected land uses (e.g., Thetis Lake and Mill Hill Regional Parks, and Knockan Hill Park). It is important to recognize that the CDFmm includes far more than just Douglas-fir forests. In addition to those forests, the zone includes endangered Garry oak ecosystems, wetlands, and shorelines— all of which can be found in View Royal.
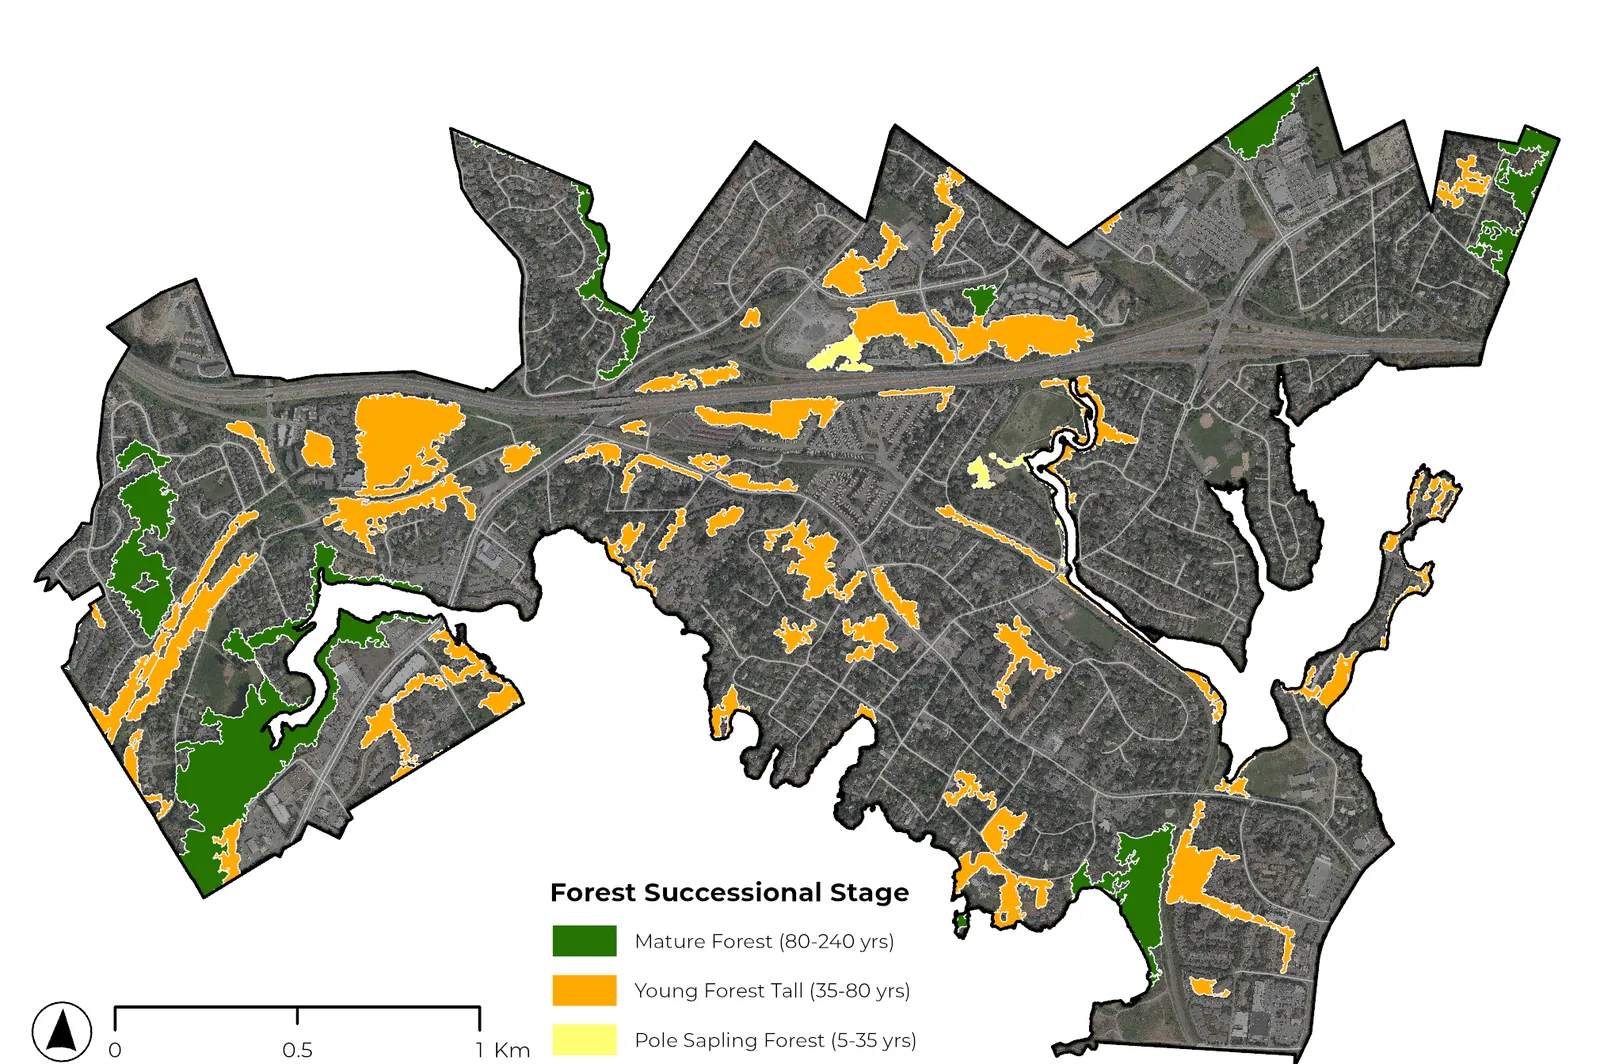
Most of View Royal’s forested areas are mature, primarily coniferous forests that have regenerated after historical land clearings in the 19th and early 20th centuries (Figure 15). However, some early successional stands are also present. Early successional forests often consist of deciduous species such as red alder, cottonwood, and big leaf maple, typically found in more recently disturbed areas, riparian zones, or on marginal lands previously used for agriculture or industry.
View Royal’s forested areas face significant challenges as the climate deviates from historical norms. Three of the last five years have seen record-breaking wildfires and temperatures in British Columbia. Remote sensing analysis conducted as part of this background review has identified more than 4,800 open grown or overstory trees exhibiting signs of decline or dieback in their crowns, an increase of 1120 (30%) since 2019. These trees are predominantly located in Thetis Lake Regional Park. Native species like western red cedar, western hemlock, and grand fir are struggling with the drier summers caused by climate change. The Park is managed by the CRD, so the Town does not have direct control over its management. However, increased fuel loading due to the decline of trees in the Park could increase the risk of wildfire in Town.
Incursions from invasive species are present to some degree in most of View Royal’s forested parks and natural areas. English Ivy is a prolific understory plant in some locations, such as in Portage Park, however the efforts of View Royal’s Invasive Species Coordinator and community volunteers have helped keep their tendrils off of overstory trees and the forest floor. Invasive blackberries, scotch broom, periwinkle, and several other common offenders to southeastern Vancouver Island were also confirmed present during spring 2024 field observations. Endangered ecosystems, such as those associated with Garry oak, should be prioritized in a monitoring a program to support early detection and treatment.
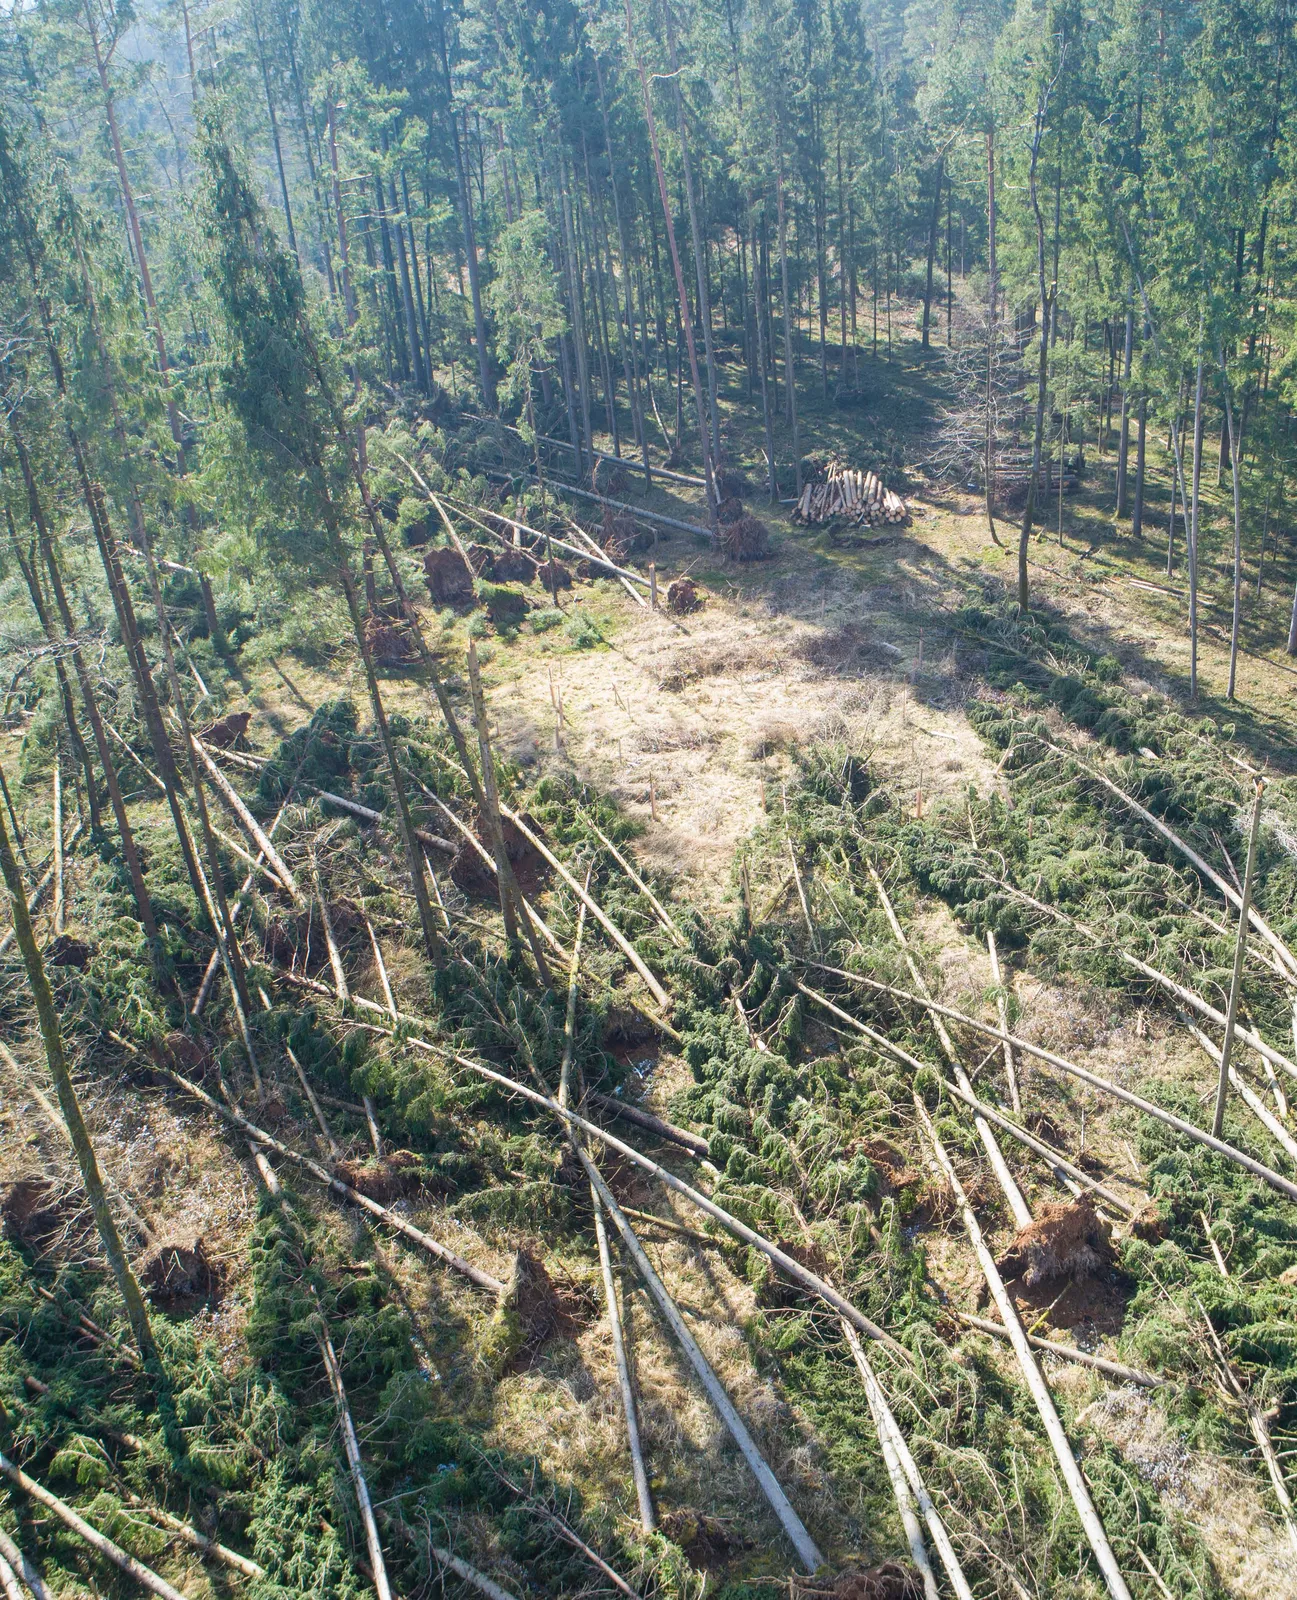
Where development creates new forest edges, or otherwise interfaces with existing ones, processes should ensure the integrity of that edge is preserved during construction and after development. A Registered Professional Forester can assess the risk of windthrow and recommend measures to address that risk.
Tree failures caused by wind, or windthrow, can occur when new forest edges are created, potentially damaging forest values of parks and riparian areas. The likelihood of windthrow depends on the stand and individual trees’ natural ability to withstand winds, the site’s position on the landscape and its exposure to storm winds, and how well the trees’ roots are anchored in the soil. Clearings made for development can create new forest edges, which may expose previously sheltered trees and are not well adapted to that environment, thus increasing the likelihood of tree failure. In View Royal, some parks like Nursery Hill Park feature poorly adapted trees that have recently been exposed to stronger winds along a new edge.
Map showing the successional stages of View Royal's urban forested areas
Figure 15. Successional stage of View Royal’s urban forested areas (right)
Page 61–81
ESTABLISHING A WINDFIRM FOREST EDGE
Under BC's Riparian Areas Protection Regulation, a QEP must be contacted when works may impact vegetation within an identified riparian setback (typically 30m for fish bearing streams) to ensure site works don't pose elevated risk to the stream feature - this generally involves windthrow hazard assessment.
Anchor trees: Large, structurally sound, dominant trees that have developed structural adaptations like good rooting systems, large buttress roots, and strong taper. These adaptations result from growing above other trees in the stand, which exposes anchor trees to wind throughout their life. Retention and protection of anchor trees helps maintain the most stable forest edge available, and reduces the overall likelihood of windthrow.
Moderately windfirm trees: Moderately windfirm trees are not well adapted to exposure and may fail if exposed to strong winds at a new forest edge. They have always grown in a closed forest stand and may need several years to adapt to the new conditions. The stability of the stand depends on these trees being sheltered by the strong anchor trees.
Danger/Potential danger trees: Trees with defects or structural qualities that mean they pose a current hazard or would be expected to pose a hazard once the new edge is created. These trees have significant structural defects, such as decay or major injury, weak rooting, or very slender stems. Trees in this category are often the smaller trees that may have never faced strong winds and are likely to fail if exposed. Removing these trees prior to development helps mitigate the risk of windthrow.
New forest edge: This is a boundary drawn by a forester to delineate where a fortified new edge would exist adjacent a proposed development considering anchor and moderately windfirm trees.
Root protection zone: The root protection zone is also delineated by a forester to identify the line beyond which no site works should occur toward protecting the root zones of anchor and moderately windfirm trees.
Riparian Setback
Aerial view of a forest area with many fallen trees scattered on the ground
Page 61–81
3. Looking Ahead
3.1 Where we are going
The UFS is meant to guide the management of View Royal’s urban forest in the face of a changing community and climate. Using data sets from BC Stats, the Canadian Census, and the Town’s 2024 Interim Housing Needs Report, the Town is expected to see an approximate population increase of 9,500 people between 2025 and 2050; to a population of more than 22,000 people within the life of this plan. New residents demand more homes and infrastructure, leading to increasingly tight urban spaces. At the same time climate change will bring with it conditions, including storms and extreme heat, different from those we and our urban forest have known in the past.
View Royal’s Urban Forest Strategy takes guidance from the Town’s Official Community Plan, and proposes strategies and actions meant to further the sustainable management of the urban forest in light of the range of threats it faces. In the pages following, we reflect both on the strengths and challenges experienced by the Town’s urban forest management program, and the insights gleaned through community engagement, so that we can weave these issues, opportunities, and critical insights into a comprehensive management framework.
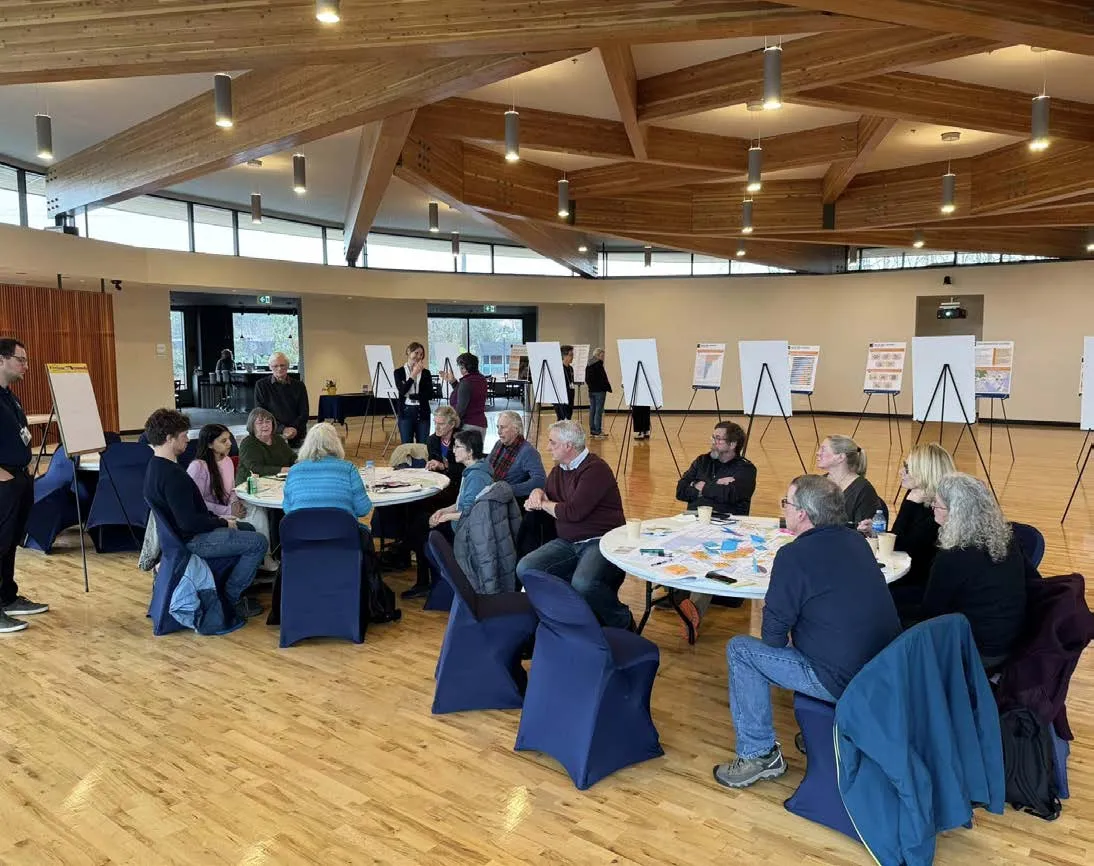
Group of people gathered around tables in a large room for an official plan open house
3.2 What We Heard
Two phases of public engagement will inform the development of this UFS. The first phase included an online survey open throughout October 2024. It focused on identifying community values and preferences for urban forest management to shape the draft UFS’ vision, principles, and objectives. The second phase of engagement began in June 2025 and included the opportunity to review the draft UFS, and identify priority actions for its implementation.
One-hundred-and-twenty (120) respondents participated in the phase 1 online survey. They indicated three benefits they would like the UFS to prioritize:
Ecological: Such as habitat for native (local) plants and animals,
Environmental: Including stormwater management, air purification, and wind protection, and
Climate resilience: Like cooling, flood protection, carbon capture and carbon storage.
Eighty-five (85%) of respondents were concerned about tree loss, 80% would like to see an increase in Town-wide canopy cover, and over 75% believe that the protection of native trees, habitats, and biodiversity are high priorities. Over half of respondents (54%) are willing to support the Town increasing funding to its urban forest program to improve service levels.
Thirty-six (36) respondents completed the Phase 2 online survey. Respondents identified Goal 4. Protect as the top priority, followed by Goal 1. Plan. Each strategy received at least 70% support, and each action received at least 75% support. Additionally, 88% of respondents are willing to pay to support the community’s urban forest through avenues such as property tax.
WHAT WE HEARD OVERVIEW
View Royal’s Urban Forest Vision
Survey respondents were asked to describe their vision of the urban forest. The most common words in their responses were trees (115 mentions), urban (35), and forest (28).
120 Online Survey Respondents
#1 Ecological benefits were most highly valued by survey respondents
85% of survey respondents were concerned about tree loss
80% of survey respondents would like to see View Royal’s canopy cover increase
54% of survey respondents support increased program funding
Respondent Comments:
“Minimize tree loss during new development.”
“I would like more information on how many trees are being planted by the Town each year.”
“Increasing funding to protect native biodiversity should be very high priority.”
“I would like to see the town adopt a volunteer program similar to Saanich Pulling Together.”
“Provide more education to residents on how to care for their trees.”
Timeline:
Fall 2024: Background Review. Engagement Phase 1: Community Vision & Values.
Strategic Direction & Policy Integration: This Strategy outlines a vision and actionable goals for managing the urban forest through 2045. Its goals are reinforced by the Town’s other strategic policy documents, including its Strategic and Official Community Plans, and reflect an institutional awareness of the urban forest’s importance.
Biodiversity:Reflection of trees and a shoreline in a very calm lake View Royal’s urban forest is home to the endangered Garry oak ecosystem which is among Canada’s most biodiverse and threatened plant communities. These meadows, once maintained by Indigenous cultural burning practices, now face pressure from urban development and Douglas-fir encroachment due to fire suppression. Efforts like the Town’s land transfer to Mill Hill Regional Park in 2022 support the protection of species at risk highlight its ongoing commitment to conservation.
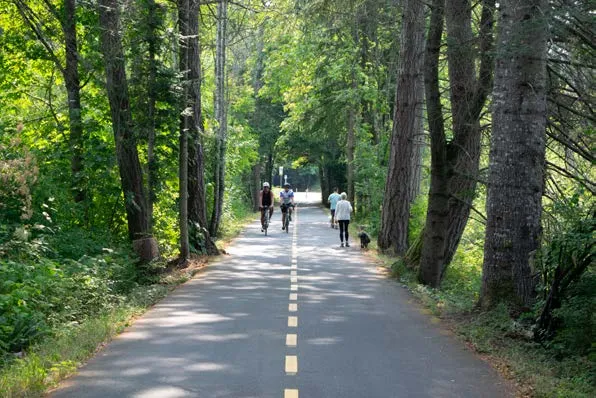
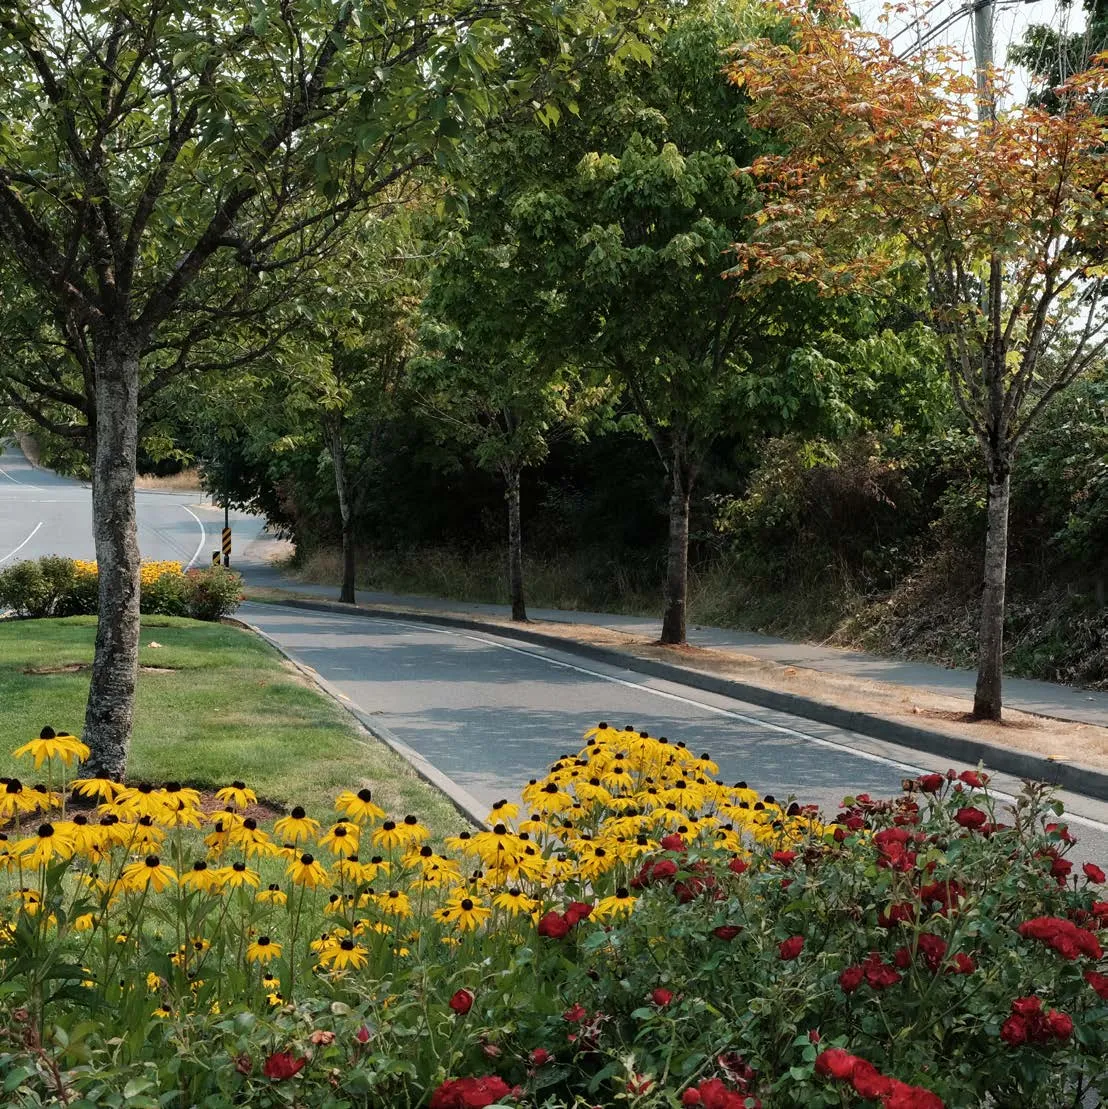
Municipal Woodland Park Network:Narrow paved path lined with tall, dense trees and green foliage View Royal’s large park system ranges from Community Parks, such as Edwards Park and Robin Hill Park, to Natural Greenspace, Linear Parks like Portage Inlet Linear Park, and Regional Parks such as Eagle Creek Park.
Reconciliation: The Town of View Royal has the opportunity to strengthen relationships with the Xwesepsum (Esquimalt Nation) and Songhees Nation, whose ancestors have stewarded the area for thousands of years. Despite the significant loss of access to traditional territories, View Royal’s native forests and waterways remain critical to Host Nations’ cultural practices. The Town is committed to enhancing dialogue with Host Nations and recognizes urban forest management as an opportunity to integrate Indigenous values, traditional knowledge, and culturally sensitive practices.
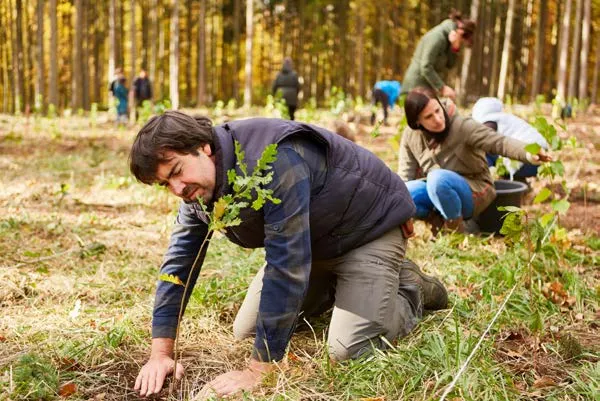
Stewardship:Group of people planting saplings in a forested area Programs like the Resident Tree Planting Program and the Greater Victoria Green Team foster strong community stewardship of the urban forest, enhancing public involvement and support for tree-related initiatives.
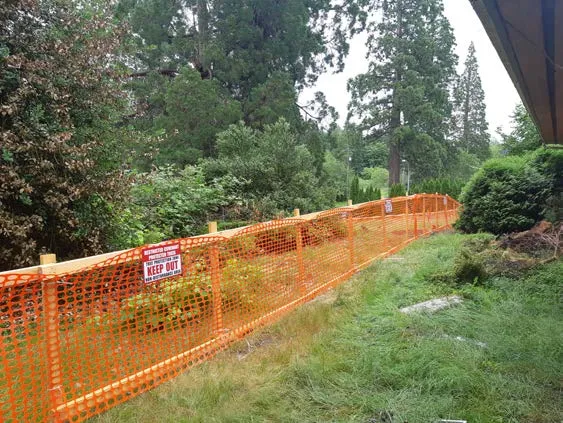
Protection:Orange safety fence protecting a wooded area near a construction site Existing regulations safeguard trees on both public and private lands, and most of the Town’s urban forest is protected within Thetis Lake and Mill Hill Regional Parks. These areas act as vital reservoirs of biodiversity and ecosystem services.
Page 61–81
Challenges
Urbanization:Two tall construction cranes against a blue sky with soft white clouds As with most Canadian communities, growth in View Royal over the past two decades has resulted in net loss of the community’s canopy cover. The losses that have contributed to this exchange will continue to amplify as the community looks forward to more than 2,800 new housing units and thousands more residents over the next 20 years. Processes and planning must adapt and diverge from historic patterns of growth and design if View Royal would like to maintain or increase its urban forest, rather than face continued loss.
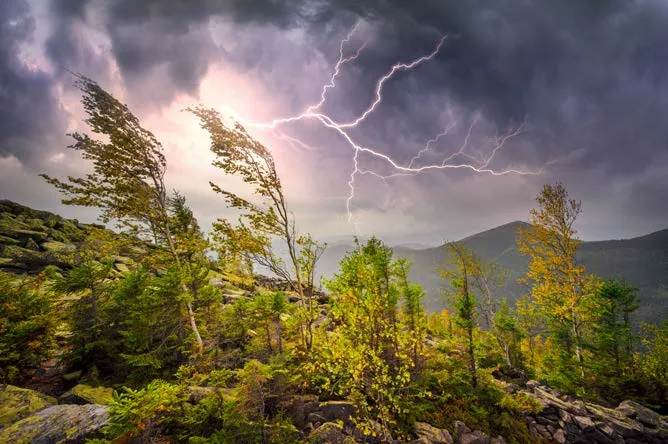
Climate & Extreme Weather:Dramatic lightning strike during a storm over a forested mountain landscape The impacts of climate change are being felt more with each passing year; extreme heat, drought, and wildfire. Additional challenges include flooding risks from sea level rise and increased rainfall. These pressures will not subside, and in fact, climate change may manifest as a source of underlying stress, that will erode the resilience of the urban trees to resist a number of other urban stressors. Management practices can help adapt to climate change, but it is now something we must plan for, rather than hope to avoid.
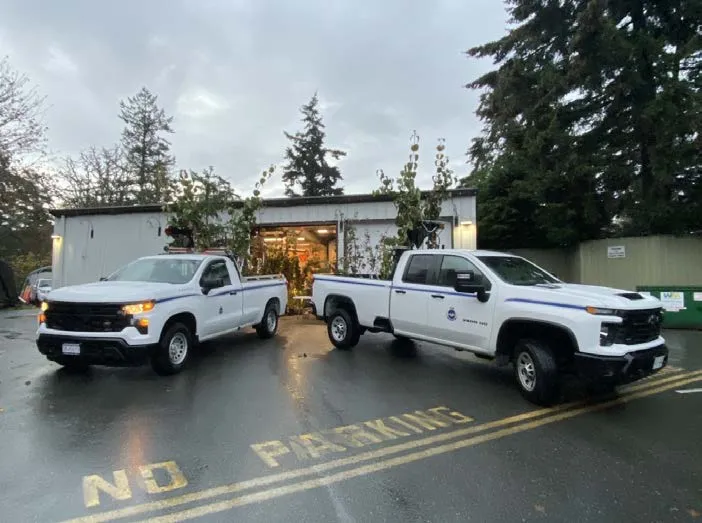
Program Capacity:Two white municipal pickup trucks with "Town of View Royal" logos parked in a lot Urban forest management responsibilities are divided among various departments, generally assigned to staff as a small part of their larger role within the municipality. This lack of dedicated capacity and very limited program funds restricts program capacity at present and would not facilitate meaningful implementation of this plan.
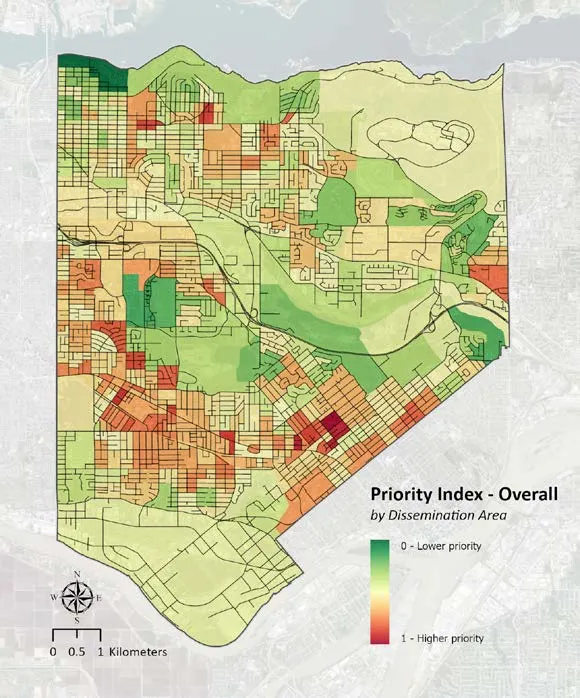
Data-Driven Decision Making:Map of a city area with color-coded priority indices for different blocks The Town has a partial street tree inventory that would benefit from being updated and completed with key attributes. Current datasets like a complete inventory support data-driven decision-making and support program monitoring efforts.
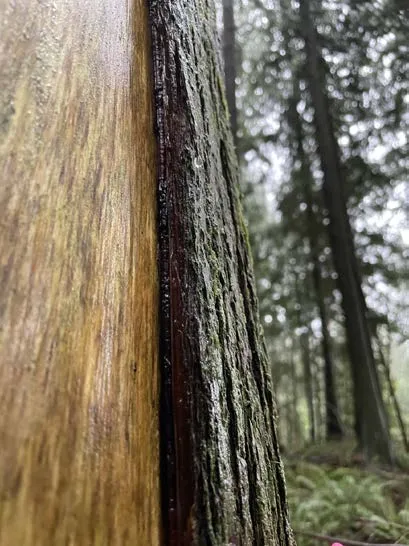
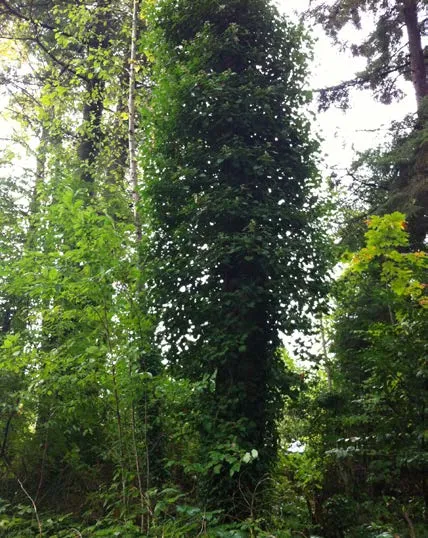
Woodland Health & Invasive Species:Large tree trunk in a forest completely covered by thick, green climbing ivy View Royal's forests are increasingly challenged by the range of threats faced. Remote sensing has detected a 30% increase in declining trees since 2019, especially in Thetis Lake Regional Park. Invasive plants such as English ivy, Himalayan blackberry, Scotch broom, and periwinkle are widespread, despite management efforts.
Page 61–81
BY THE 2080s, PROJECTED CHANGES* TO:
TEMPERATURES: More extreme heat events with days above 25°C tripling. Milder winters. Summer extremes of 38°C (1-in 20 hottest day).
EVAPOTRANSPIRATION: Increased rates of evaporation and transpiration from waterbodies, soil and plants.
PRECIPITATION: Heavier rainfalls and more rain except in summer. Longer droughts and decreasing snowpack.
SNOWMELT: Faster snowmelt. Earlier peak spring flows and flooding. Lower late-summer flows.
GROWING SEASONS: Longer and warmer growing season, increasing by 83 days.
VARIABILITY: More frequent and unseasonal extreme weather.
WILL LIKELY CAUSE
SPECIES DISTRIBUTION SHIFTS: Forest species may shift northward and upslope as heat and moisture conditions exceed their tolerances.
LESS MOISTURE AVAILABILITY: Evapotranspiration will increase relative to precipitation, limiting water available to trees reducing growth, potentially leading to decline.
LONGER FIRE SEASONS AND LARGER FIRES: Fires may occur more often and burn larger areas because of hotter drier summers and vegetation.
MORE PESTS AND INVASIVE SPECIES: Some pests could reproduce more rapidly and more often. Water stressed trees and ecosystems are more vulnerable to attack and invasion.
LONGER, WARMER GROWING SEASONS: Longer growing seasons may support more growth, species diversity and potentially more carbon sequestration where growing conditions are suitable.
MORE EXTREME WEATHER EVENTS:Large, bright sun low on the horizon at sunset with birds on a power line Extreme heat, precipitation, freezing rain, heavy wet snow, flooding, landslides, windstorms and other events may happen more often leading to more tree stress and damage.
* Projected changes based on modeling for the Capital Regional District using the Intergovernmental Panel on Climate Change’s Representative Concentration Pathway 8.5 scenario (RCP8.5), which represents a high emissions pathway with limited mitigation of greenhouse gas emissions by the end of this century (or “Business as Usual”).
Page 61–81
4. Strategic Framework
The Town of View Royal’s urban forest strategic framework is grounded by a community-based vision and guided by five overarching goals. The urban forest vision reflects our community’s urban forest aspirations for 2045:
In 2055, our Town’s urban forest is celebrated for its diverse, mature trees and interconnected green spaces. It provides vital habitat for native plants, pollinators, and wildlife, mitigates the impacts of climate change and enhances community resilience, health, and well-being. By protecting the existing urban forest and making space for new trees, we have enhanced and expanded our urban forest and strengthened our sense of place. We are stewards of our environment, and the trees we plant today will benefit our community for generations.
The five goals of the strategy work together to provide a clear and cohesive roadmap for managing View Royal’s urban forest. Each goal is supported by specific strategies and actions that offer targeted guidance for implementation. Progress will be measured through defined indicators and sustained by cross-departmental coordination and partnerships with external stakeholders.
Several ‘quick start’ actions will enable View Royal to begin rapidly working towards positive urban forest outcomes within the early stages of the Strategy’s life. In parallel, ‘priority actions’ will require more time and resourcing to implement but will have the most significant impact on the success of View Royal’s urban forest program.
Ultimately, the strategic framework will allow the Town of View Royal to ensure that its urban forest continues to meaningfully contribute to the community’s livability, identity, and resilience for generations to come.
Beautiful sunset over calm water with islands and hills in the distance
Strategic Framework
Vision: View Royal’s Urban Forest
5 Goals
14 Strategies
51 Actions
30% Canopy Cover Target (2045)
Goal 1. Plan
1.1 Ensure planting standards support long-term tree growth
1.2 Ensure land use planning supports the urban forest
1.3 Ensure rates of tree planting support net new outcomes
1.4 Consider equity and community need through program decision-making
Goal 2. Manage
2.1 Improve urban forest governance
2.2 Prioritize program monitoring and reporting
2.3 Sustainably resource urban forest management and the implementation of this Strategy.
Goal 3. Maintain
3.1 Use best practices and industry benchmarks in the Town’s maintenance regime
3.2 Maintain forested areas to a reasonable standard of care
Goal 4. Protect
4.1 Enhance regulatory tools and processes to achieve the right balance between tree protection and community growth.
4.2 Support the resilience of both View Royal as a community and its urban forest.
Goal 5. Partner
5.1 Build relationships with Host Nations and Indigenous Peoples living in View Royal
5.2 Build community knowledge of and participation in urban forest management
5.3 Develop strategic partnerships
(!) 19 Core Actions: Are essential to program performance and no net loss of canopy cover.
Page 61–81
5. Action Plan
Goal 1. Planning and design processes facilitate the growth of the urban forest.
Strategy 1.1. Ensure planting standards are supporting long-term tree growth.
The best tree outcomes are often decided well in advance of the tree being planted. In constrained urban growing environments it is often the case that the qualities of planting sites dictate the success and longevity of the trees planted within them. Planting area, stock selection, soil qualities and volumes, spacing, irrigation and a range of other considerations all influence which trees are likely to survive on a site. By incorporating arboricultural best practices into development regulation and planting processes, trees planted are expected to have longer life-cycles and provide more benefits.
KEY INDICATOR(S): M3. Average DBH of boulevard trees at time of removal
BASELINE (2025): Unknown
TARGET (2045): >20 cm
Action 1. Ensure trees entering the boulevard inventory are inspected to verify compliance with stock and establishment standards prior to their acceptance by the Town.
Action 2. (!) Update View Royal’s Subdivision and Development Servicing Bylaw and standard details to enhance tree planting conditions in right-of-ways, including minimum soil volume, irrigation, boulevard width and soil depth requirements.
Action 3. Review tender specifications and warranty inspection standards for contracted tree planting.
Action 4. Review the Town’s details for boulevards, tree planting, tree protection, and tree pits. Ensure design is aligned with best practices, and would support full tree life-cycles.
Action 5. Spatially define the areas across the Town where the use of native vegetation is to be prioritized given biodiversity preservation objectives within or adjacent to those areas (e.g. shoreline parks, park natural areas, and ESA buffers).
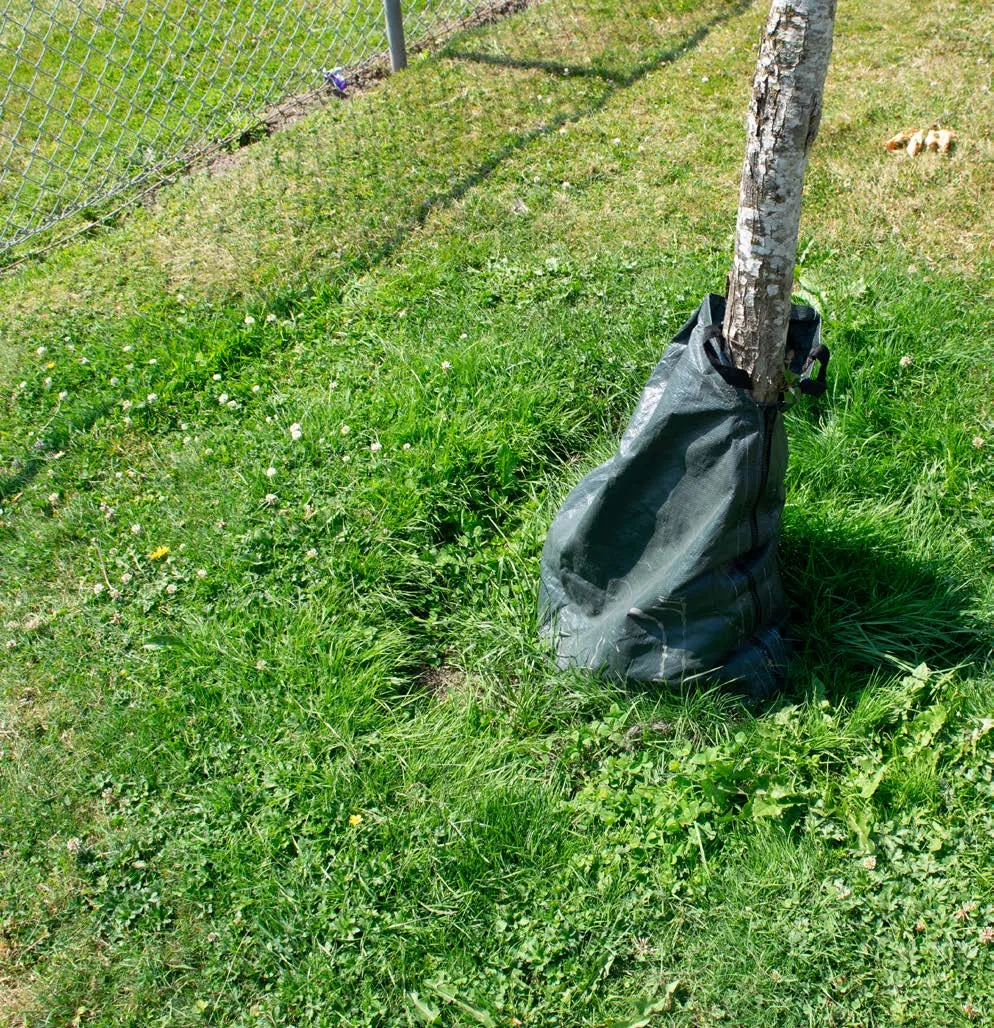
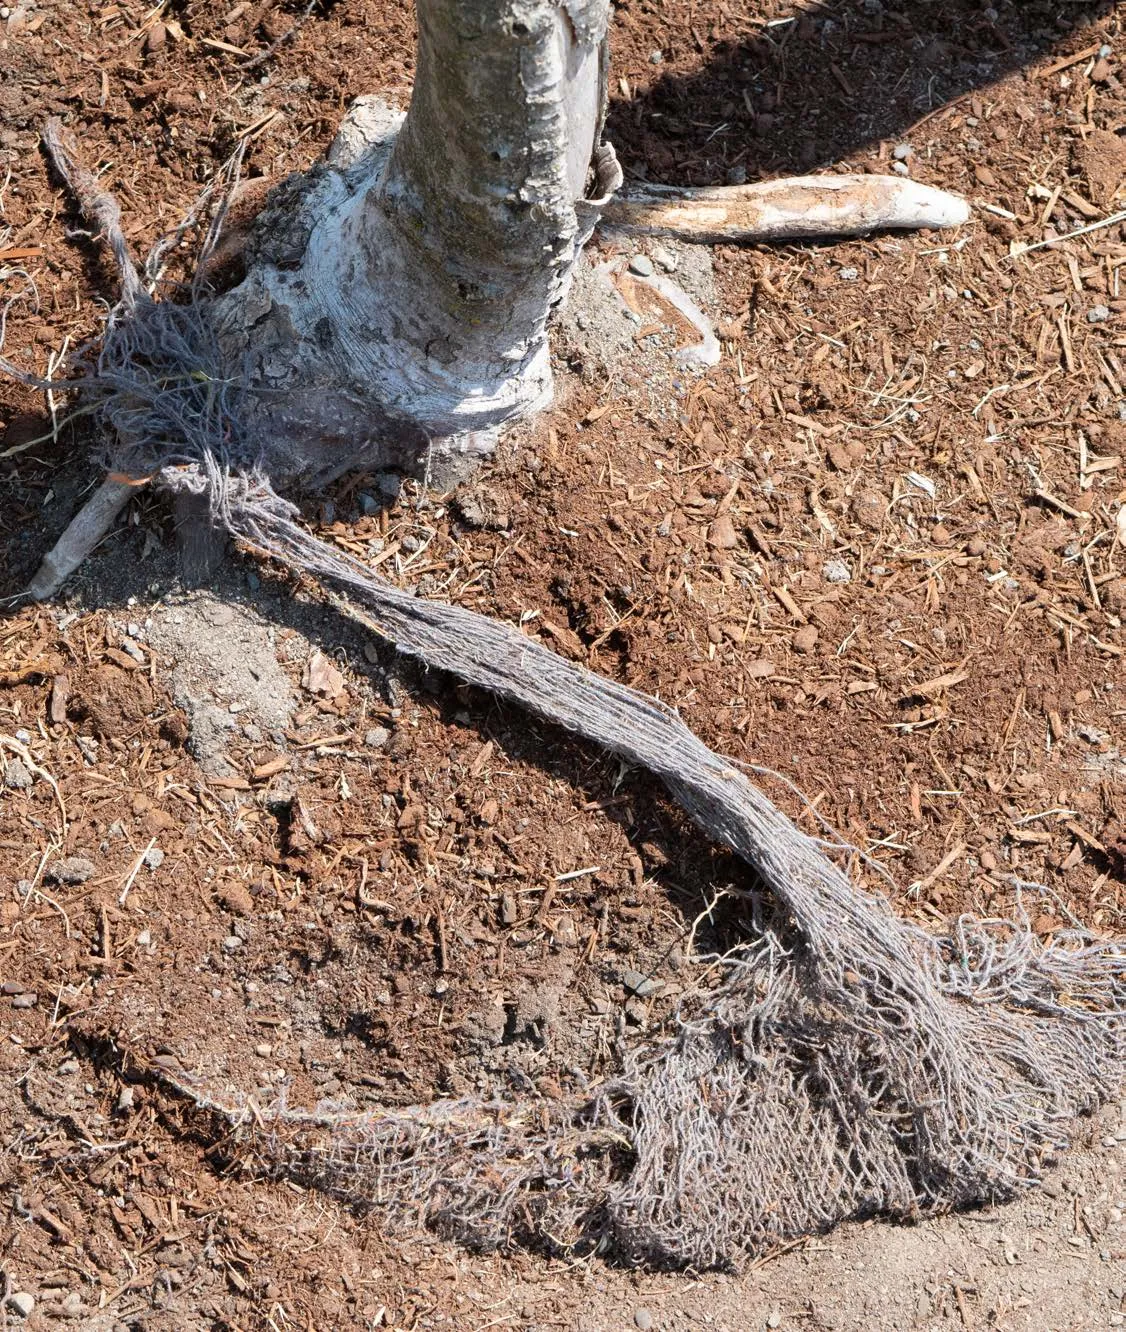
Exposed base of a tree trunk with roots partially covered by grey landscaping fabric
Poor planting practices (above) and land clearing (right) can be mitigated through thoughtful land use planning, planting standards and design.
Strategy 1.2. Ensure land use planning is supporting the urban forest.
Nearly 60% of View Royal’s urban land base is under private ownership. Land use planning policy and tools such as the OCP and zoning regulation play a significant role in shaping our community’s urban forest through determining the amount of space available for tree planting on private property. This is significant because the planting opportunities, or lack thereof, created during development are likely to persist for decades.
Updates to land use planning policy and regulations can help ensure that as the Town grows to meet housing and infrastructure needs, it is also supporting urban forest goals. Maintaining, and certainly growing the urban forest canopy, will not be attainable otherwise.
Action 6. (!) Adopt OCP policy supporting the urban forest and UFS that provides enhanced direction on the handling of View Royal’s urban forest within the community’s guide to growth.
Action 7. (!) Review View Royal’s Zoning Bylaw to ensure performance criteria, including surface parking, landscaped open space, setbacks, and lot coverage, are supporting consistent inclusion of trees on development sites.
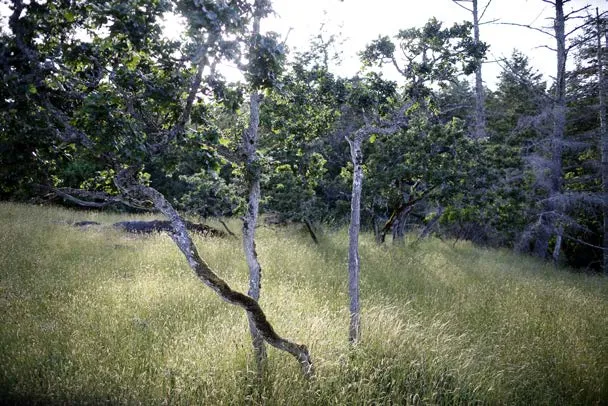
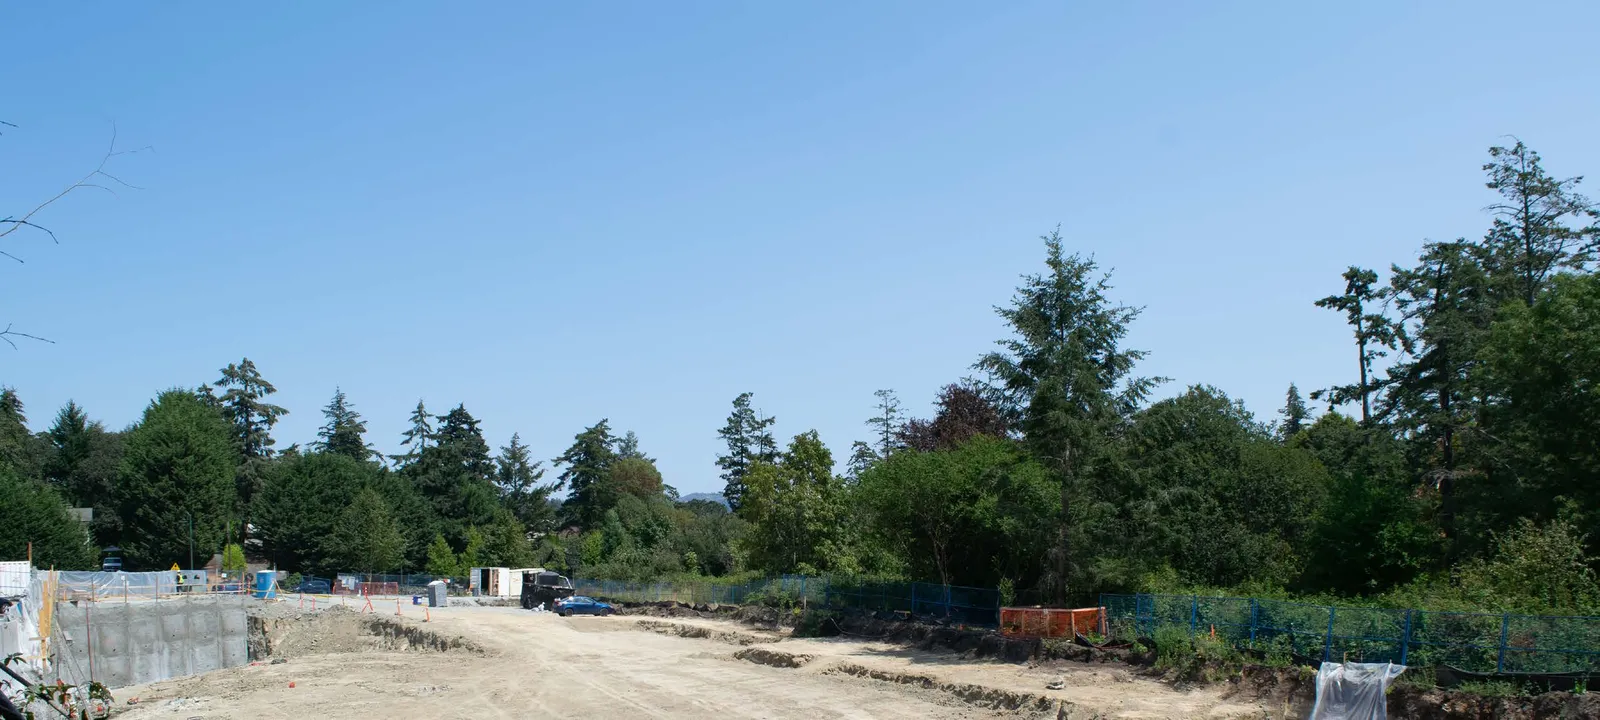
Large construction site with several cranes working near existing green trees under a bright blue sky
Canopy Cover Pathways
Through the development of this document, the Town has prepared three canopy cover scenarios: canopy growth, canopy net neutrality, and status quo.
Under a “canopy growth” scenario
View Royal’s canopy would increase to at least 30% (+1%) over the coming two decades. Trends beginning over the past two decades would be reversed despite historic rates of loss and projected future population growth. New processes, resources, and procedures would build resilience to climate change and other developing forest health concerns. Rates of tree planting would not only offset loss, but would be sufficient to increase canopy cover.
~730 trees planted/replaced annually within the Town (est. 100 on municipal property, 2000 by 2045)
$250,000 - $500,000 (2045)
15,000 - 25,000 Residents
Under a “net neutral” scenario
View Royal’s canopy would remain at its current coverage (29%) over the coming two decades. Trends beginning over the past two decades would be reversed, to the extent that canopy loss is not continued despite forecasted growth. Actions marked as core (!) may be enough to realize this pathway.
~430 trees planted/replaced annually within the Town (est. 50 on municipal property, 1000 by 2045)
$150,000 - $250,000 (2045)
15,000 - 25,000 Residents
Under a “status quo” scenario
There would be no changes to the Community’s existing program, structure, or meaningful change in level of resourcing. Trends beginning over the past two decades would be expected to continue over the next two decades.
~ rates of canopy loss reflective of 20-year average
No assumed budgetary commitments
15,000 - 25,000 Residents
Strategy 1.3. Ensure rates of tree planting are supporting net new outcomes.
If View Royal desires to maintain its urban forest canopy over the coming two decades, more than 8,600 new and replacement trees will need to be planted (roughly 430 trees per year). This number is even higher, at 14,600 (roughly 730 per year) if the Town wishes to grow its canopy cover to 30%.
KEY INDICATOR(S): M5. Net new public trees planted
BASELINE (2025): Net negative (2001-2023)
TARGET (2025-2045): 730 (1% growth); 50 - 100 on municipal property
Action 8. Prepare five-year tree planting plans to direct short-term tree planting programming toward the Town maintaining the desired net new tree planting.
Action 9. (!) Municipal tree planting targeting 50 - 100 trees per year between parks and boulevards and desired canopy cover pathways.
Action 10. Leverage restoration and afforestation to grow urban forest canopy within forested areas and in naturalization sites.
Action 11. (!) Establish an adopt-a-tree program where the Town will plant trees in underutilized boulevard or park space in exchange for resident-led care through establishment.
Case Study: Burnaby’s Tree4Free Program
Burnaby’s Tree4Free program offers residents a chance to help grow the city’s urban forest by having a free boulevard tree planted in front of their property. While the city handles the planting and general maintenance, the program encourages residents to take an active stewardship role by watering the young trees.
Strategy 1.4. Consider equity and community need through program decision-making.
Often, the negative impacts associated an uneven urban forest distribution disproportionately impacts vulnerable populations within a community. There are processes View Royal can initiate to ensure its urban forest remains accessible to all members of the community.
Action 12. Explore opportunities for improving urban forest access and education in areas with concentrations of vulnerable populations.
Action 13. Ensure community engagement and outreach programming is broadly accessible to any interested members of the community.
Action 14. Explore requiring dedicated tree corridors, boulevards clear of active transportation facilities or any other community infrastructure along priority right-of-ways.
View from below of an elderly couple standing close together, looking up into the leafy canopy of a large tree
Page 61–81
Goal 2. Program governance supports the Town in meeting its urban forest aspirations.
Urban forest governance involves both administrative structures and cultural norms that influence how decisions about urban trees are made and implemented.
KEY INDICATOR(S): M7. Working group meetings
BASELINE (2025): None
TARGET (2045): Twice annually
Action 15. Prepare and adopt a Town Tree policy to formalize: green infrastructure within the Town’s broader asset management program, risk management procedures, integrated pest management, public tree protection, replacement, and compensation requirements.
Action 16. (!) Establish dedicated tree maintenance and planting budgets within parks. Establish initial budgets based on a life-cycle costing approach.
Action 17. (!) Establish an interdepartmental Urban Forestry working group and meet biannually to review progress on implementation.
Young, newly planted tree in a park supported by stakes and a green "Gator" watering bag at its base
Strategy 2.2. Prioritize program monitoring and reporting.
Completing and maintaining a comprehensive street tree inventory will allow the Town to track improvements in urban forest health and prioritize maintenance efforts.
KEY INDICATOR(S): M8. Tree condition rating; M4. Urban core canopy cover
BASELINE (2025): Unknown; 29%
TARGET (2030): < 10% in ‘Poor’ or worse condition; 30%
Action 18. Undertake a review of the Urban Forest Strategy every five years.
Action 19. (!) Establish and maintain a GIS-based boulevard tree inventory featuring a technical design aligned with industry best practices.
Action 20. (!) Produce a new urban tree canopy dataset, derived from current LiDAR and imagery datasets, on a five-year interval.
Action 21. (!) Produce a State of the Urban Forest report on a five-year interval to report on key program metrics.
Strategy 2.3. Sustainably resource urban forest management and the implementation of this Strategy.
Establishing a full-time urban forestry position will develop critical in-house arboriculture expertise, serving ranging utility in urban forest management efforts.
KEY INDICATOR(S): M10. Program budget
BASELINE (2025): ~$6.50 per capita
TARGET (2045): $10 per capita
Action 22. Access external employment funding, such as Canada Summer Jobs wage subsidies.
Action 23. (!) Establish a Town arborist or urban forester position within Parks to broadly enhance urban forest outcomes.
Action 24. Transition the Town’s Invasive Species Volunteer Coordinator to a full-time equivalent and expand community outreach.
Action 25. (!) Access external funding opportunities to support tree planting, such as the Growing Canada’s Community Canopies (GCCC) initiative.
UFS Monitoring Approach
Table 2. Monitoring framework to track the implementation of View Royal’s Urban Forest Strategy.
Indicator
Method
Frequency
Baseline
Target
M1. Average DBH of boulevard trees
Inventory
Annual
Not Tracked
20 - 40 cm
M2. Interdepartmental working group meetings
Calendar
Twice Annual
None
Twice Annual
M3. Average DBH of boulevard trees at removal
Inventory
Ongoing
Not Tracked
>20 cm
M4. Urban core canopy cover
LiDAR + Orthoimagery
2 years
29%
30% by 2045
M5. Net new public trees planted
Inventory
Annual
Not Tracked
513
M6. Spatial heat disparity
Thermal + Orthoimagery
5 years
15°C
5°C
M7. Working group meetings
-
Annual
Not Tracked
2
M8. Tree condition rating
Inventory
5 years
Not Tracked
<15% in ‘Poor’ or worse condition
M9. Inventory update cycle
Inventory
Annual
Ad hoc
7 years, iterative
M10. Program budget
Operating
Annual
$6.50 / capita
$10 / capita
M11. Cyclical pruning cycle
Inventory
7 years
Reactive
7 years, iterative
M12. Forest stand condition ratings
Inventory
Ongoing
Not Tracked
<20% ‘Poor’ or worse condition
M13. Genus and species diversity
Inventory
5 years
33% maple, 25% red maple
< 30% Genera, < 20% Species
M14. Program budget
Capital Budget
Annual
$184,000
$250,000
M15. Annual volunteer hours
-
Annual
Not Tracked
> 100 hours
Two white Town of View Royal pickup trucks parked in front of a service building, one carrying several tall saplings in its bed
Goal 3. Urban forest maintenance regimen are aligned with industry best practices.
Strategy 3.1. Utilize best practices and industry benchmarks through the Town’s maintenance regimen.
Younger trees often benefit from watering, structural pruning, and protection through establishment, and mature trees can benefit from pruning, integrated pest management, and various other life-cycle activities.
Action 26. Expand the Town’s watering program to water newly planted trees weekly in the growing season for a period of 3 to 5 years after planting.
Action 27. Transition to a seven-year cyclical pruning cycle for all inventoried boulevard trees.
Strategy 3.2. Maintain forested areas to a reasonable standard of care.
A proactive forest management approach is essential to maintaining the health and function of these ecosystems. Strategic, long-term planning allows View Royal to protect its natural heritage while building a more resilient and sustainable future.
KEY INDICATOR(S): M12. Forest stand condition ratings
BASELINE (2025): Unknown
TARGET (2030): <20% of stands ‘poor’ or worse condition
Action 28. Prepare forest management plans for flagship parks including Nursery Hill Park, Kelvin Grove/Wilfert Park, Eagle Creek, Robin Hill, Portage Park.
Action 29. Prepare a biodiversity strategy to guide the management of View Royal’s natural ecosystems, including rare ecosystems and species (e.g. Garry oak ecosystems), habitat hubs and corridors.
Serene sunset over a lake with silhouettes of trees on small rocky islands and mountains in the far distance