Engage View Royal Form Results Summary - Budget 2026
Community survey results summarizing citizen satisfaction levels with various municipal services.
Engage View Royal
Form Results Summary
Mar 19, 2026 - Mar 31, 2026
Project: Budget 2026 Form: 2026 Budget & Five-Year Financial Plan - Survey Tool Type: Form Activity ID: 62 Exported: Apr 01, 2026, 01:55 PM Exported By: KKorki Filter By: No filters applied.
Attachment B - 2026 Budget Survey Results
2026 Budget & Five-Year Financial Plan - Survey Budget 2026 40 Contributors 40 Contributions
Contribution Summary
1. Do you live in View Royal?
Multi Choice | Skipped: 0 | Answered: 40 (100%)
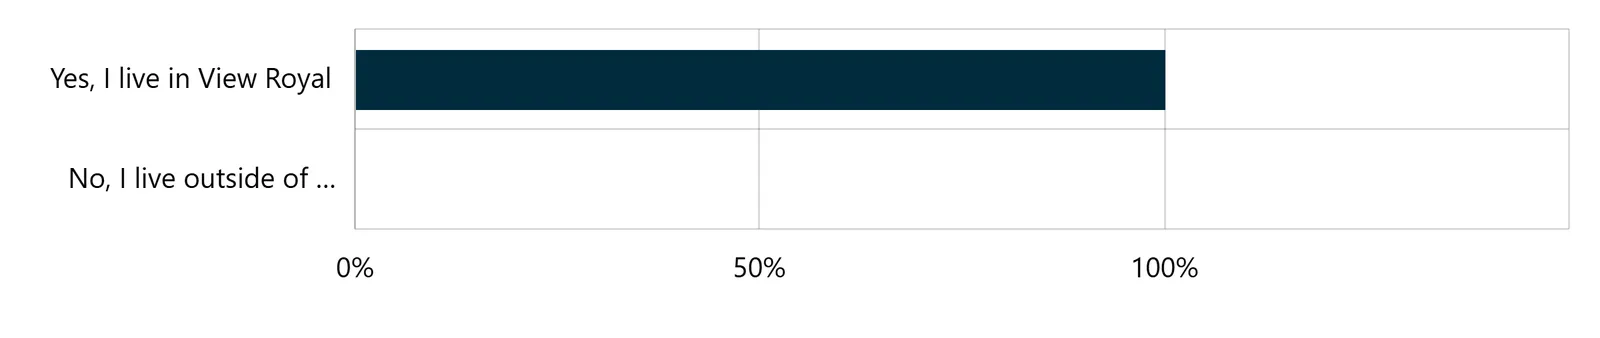
| Answer choices | Percent | Count |
|---|---|---|
| Yes, I live in View Royal | 100.00% | 40 |
| No, I live outside of View Royal | 0% | 0 |
| Total | 100.00% | 40 |
2. How satisfied are you with the level of service you receive for Policing Services?
Multi Choice | Skipped: 0 | Answered: 40 (100%)
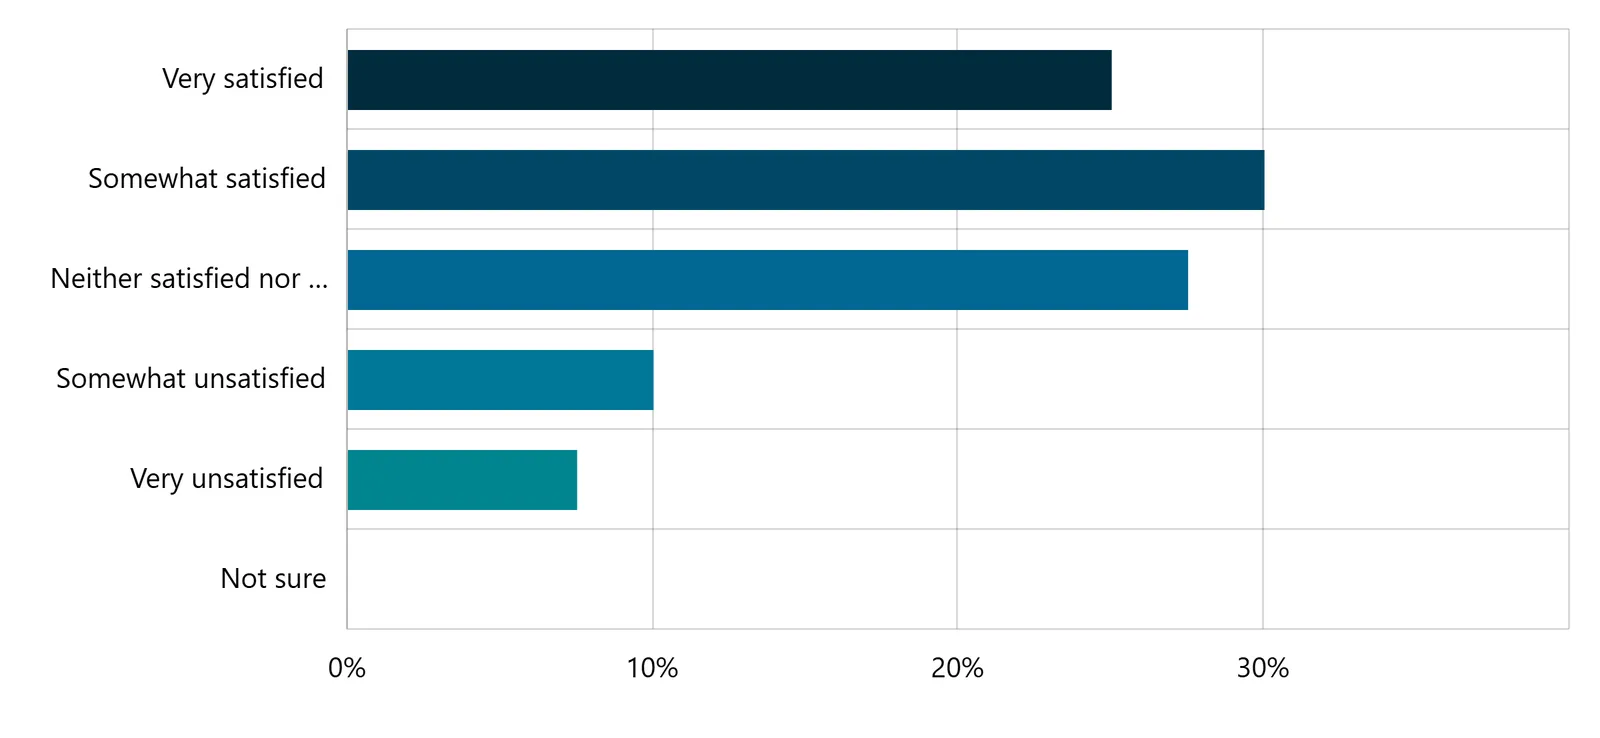
| Answer choices | Percent | Count |
|---|---|---|
| Very satisfied | 25.00% | 10 |
| Somewhat satisfied | 30.00% | 12 |
| Neither satisfied nor unsatisfied | 27.50% | 11 |
| Somewhat unsatisfied | 10.00% | 4 |
| Very unsatisfied | 7.50% | 3 |
| Not sure | 0% | 0 |
| Total | 100.00% | 40 |
3. How satisfied are you with the level of service you receive for Fire and Emergency Services?
Multi Choice | Skipped: 0 | Answered: 40 (100%)
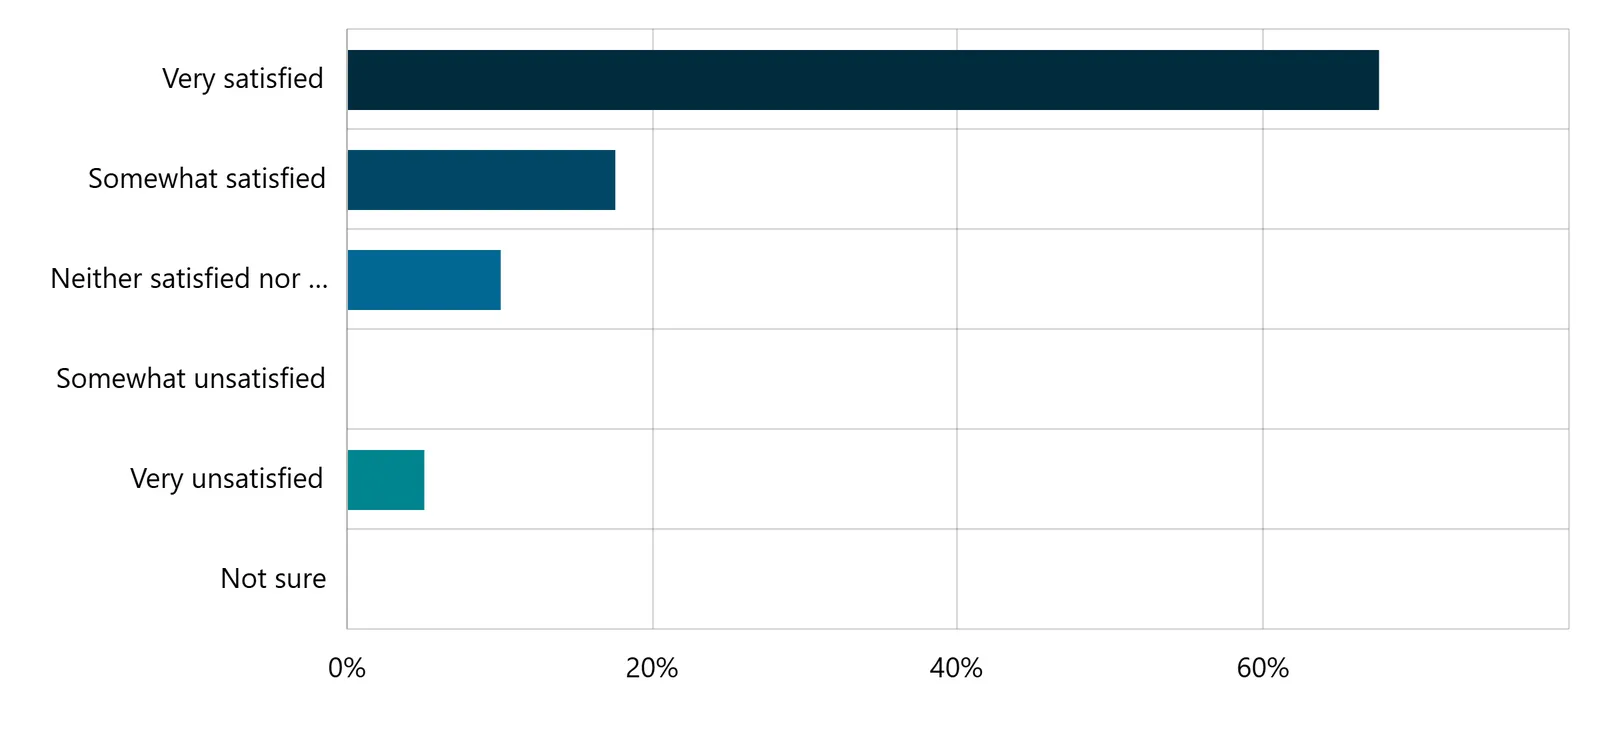
| Answer choices | Percent | Count |
|---|---|---|
| Very satisfied | 67.50% | 27 |
| Somewhat satisfied | 17.50% | 7 |
| Neither satisfied nor unsatisfied | 10.00% | 4 |
| Somewhat unsatisfied | 0% | 0 |
| Very unsatisfied | 5.00% | 2 |
| Not sure | 0% | 0 |
| Total | 100.00% | 40 |
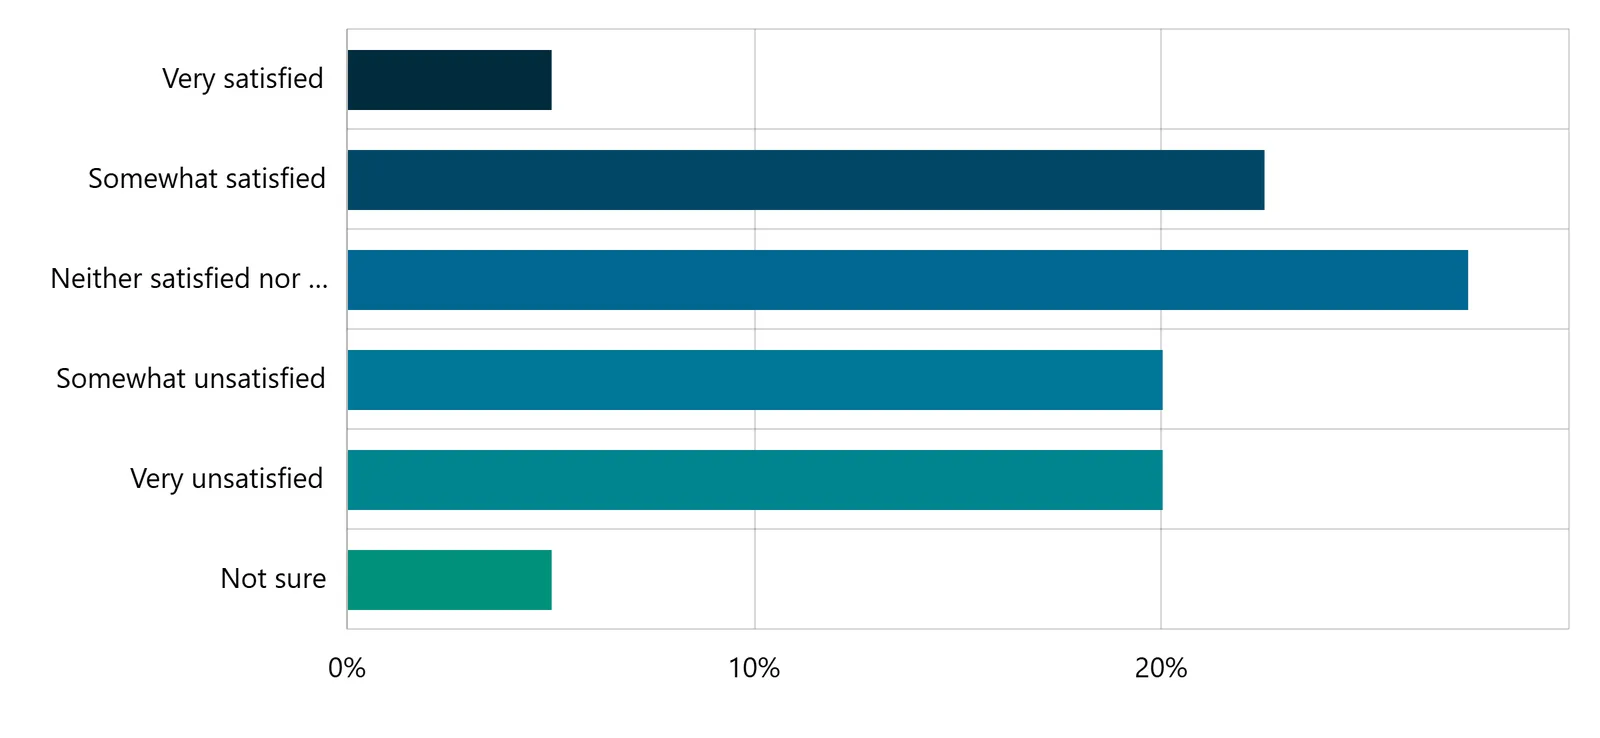
4. How satisfied are you with the level of service you receive for Transportation Services?
Multi Choice | Skipped: 0 | Answered: 40 (100%)
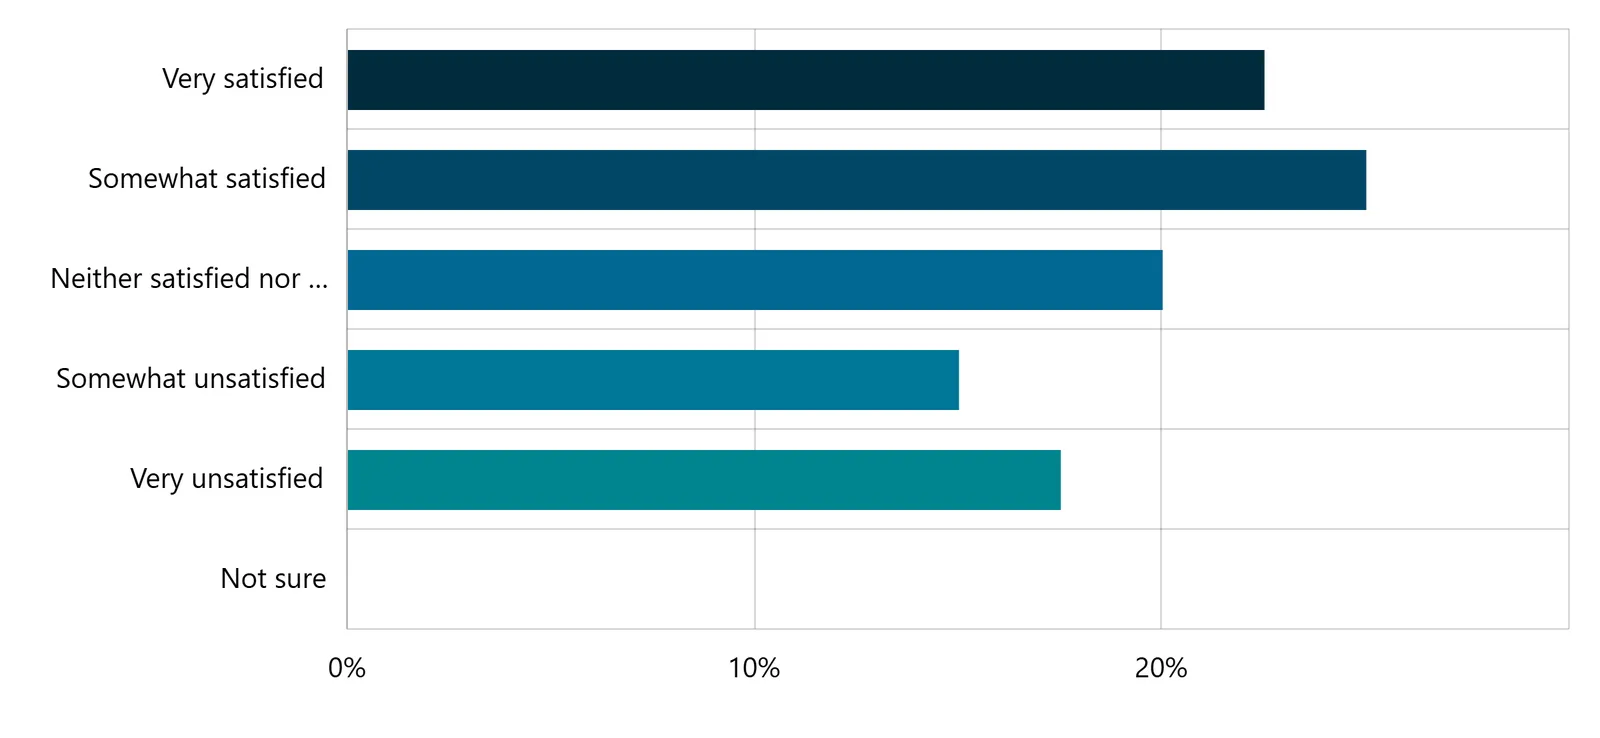
| Answer choices | Percent | Count |
|---|---|---|
| Very satisfied | 22.50% | 9 |
| Somewhat satisfied | 25.00% | 10 |
| Neither satisfied nor unsatisfied | 20.00% | 8 |
| Somewhat unsatisfied | 15.00% | 6 |
| Very unsatisfied | 17.50% | 7 |
| Not sure | 0% | 0 |
| Total | 100.00% | 40 |
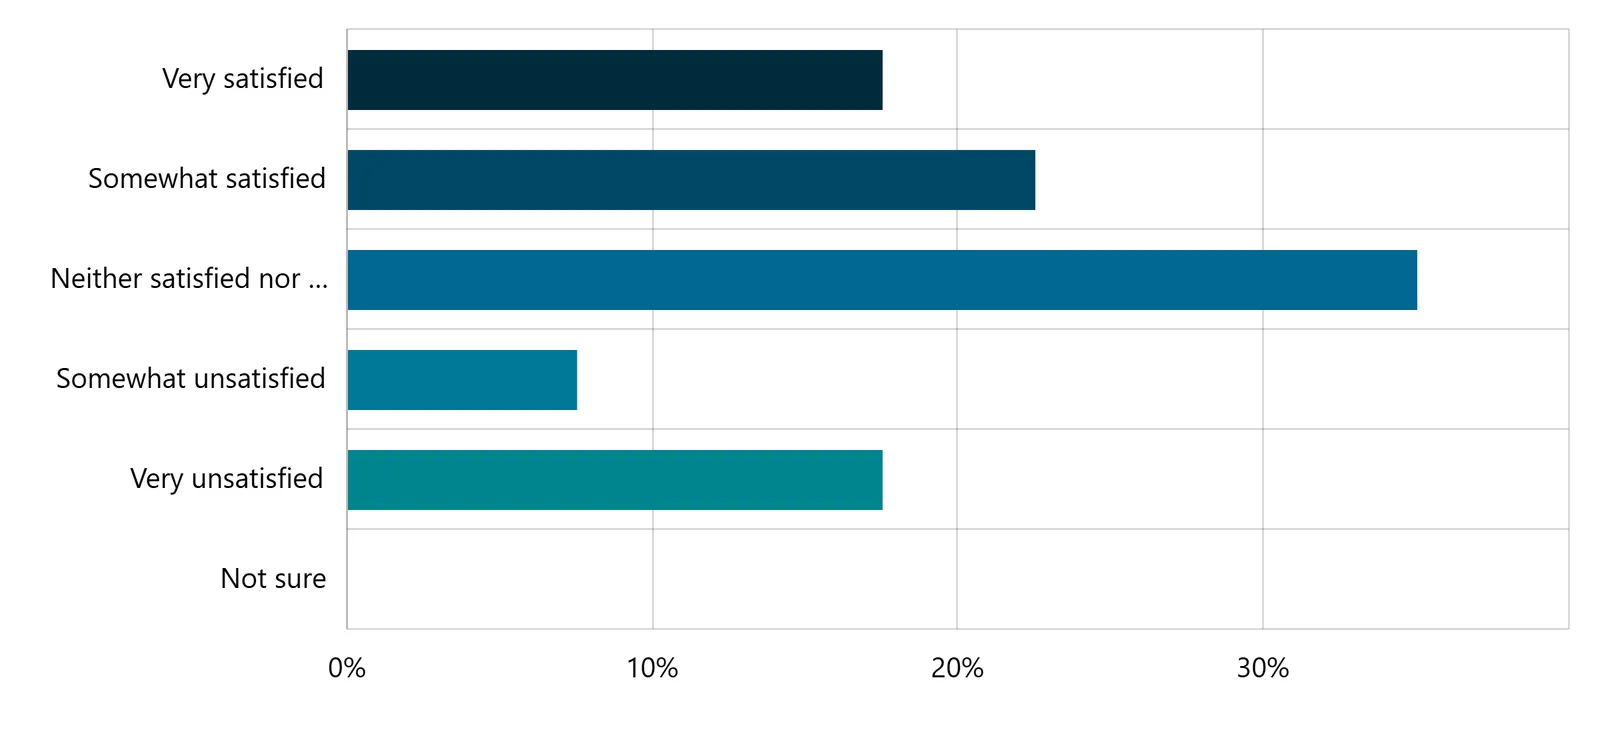
5. How satisfied are you with the level of service you receive from View Royal for garbage and household food waste collection?
Multi Choice | Skipped: 0 | Answered: 40 (100%)
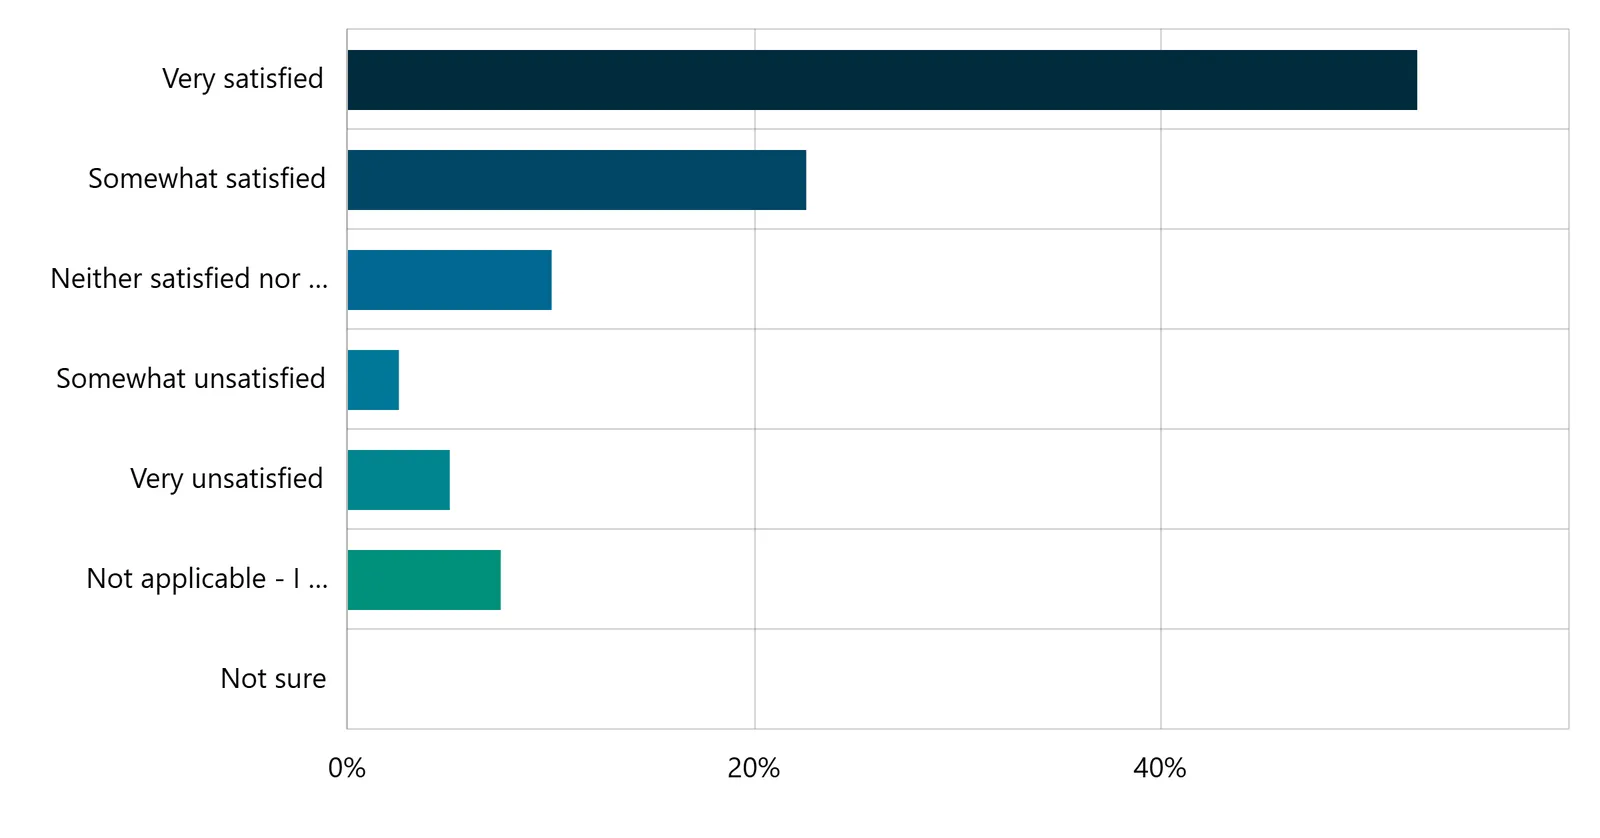
| Answer choices | Percent | Count |
|---|---|---|
| Very satisfied | 52.50% | 21 |
| Somewhat satisfied | 22.50% | 9 |
| Neither satisfied nor unsatisfied | 10.00% | 4 |
| Somewhat unsatisfied | 2.50% | 1 |
| Very unsatisfied | 5.00% | 2 |
| Not applicable - I do not receive garbage and household food waste collection from View Royal. | 7.50% | 3 |
| Not sure | 0% | 0 |
| Total | 100.00% | 40 |
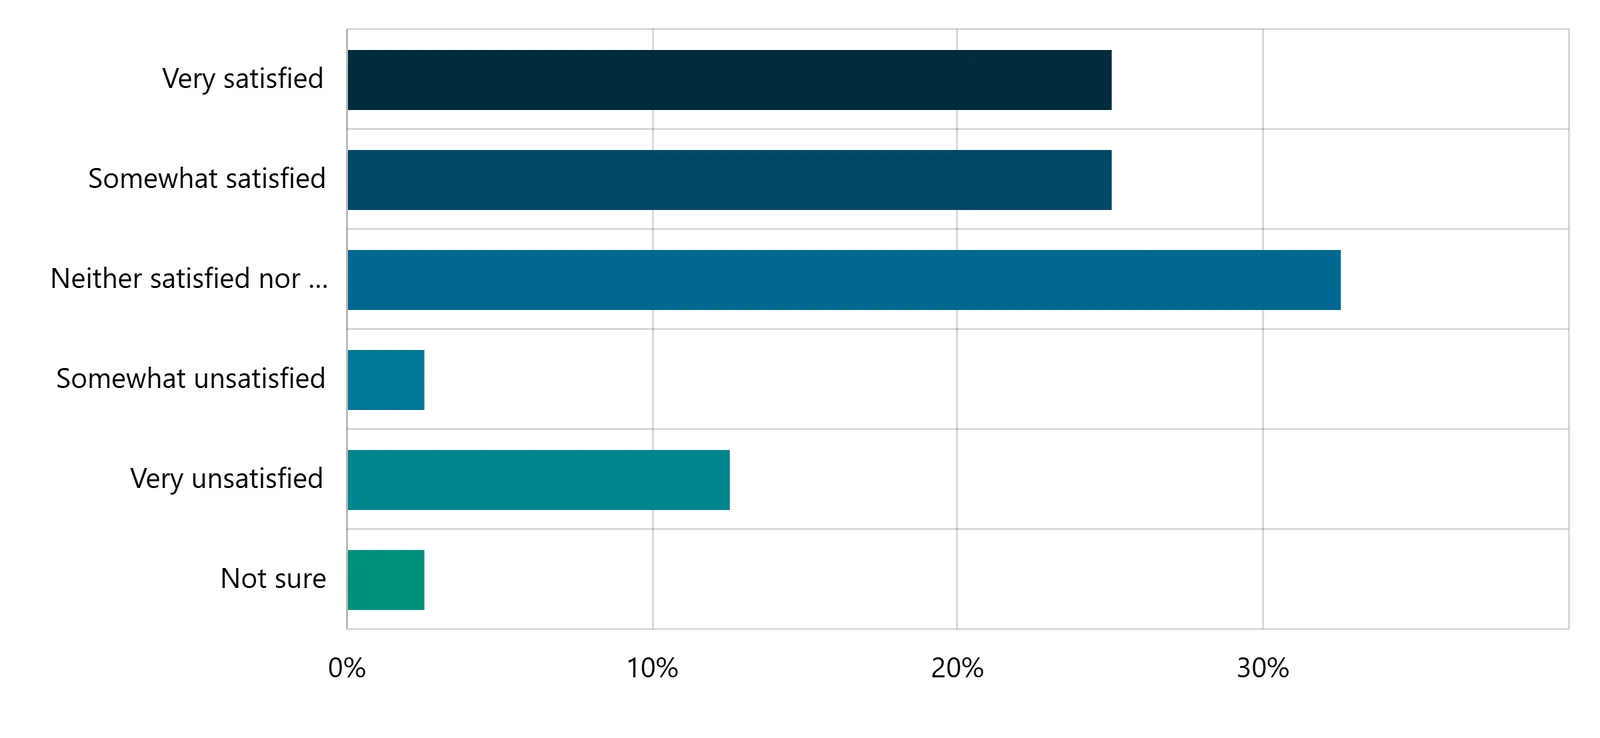
6. How satisfied are you with the level of service you receive for parks and amenities in the Town?
Multi Choice | Skipped: 0 | Answered: 40 (100%)
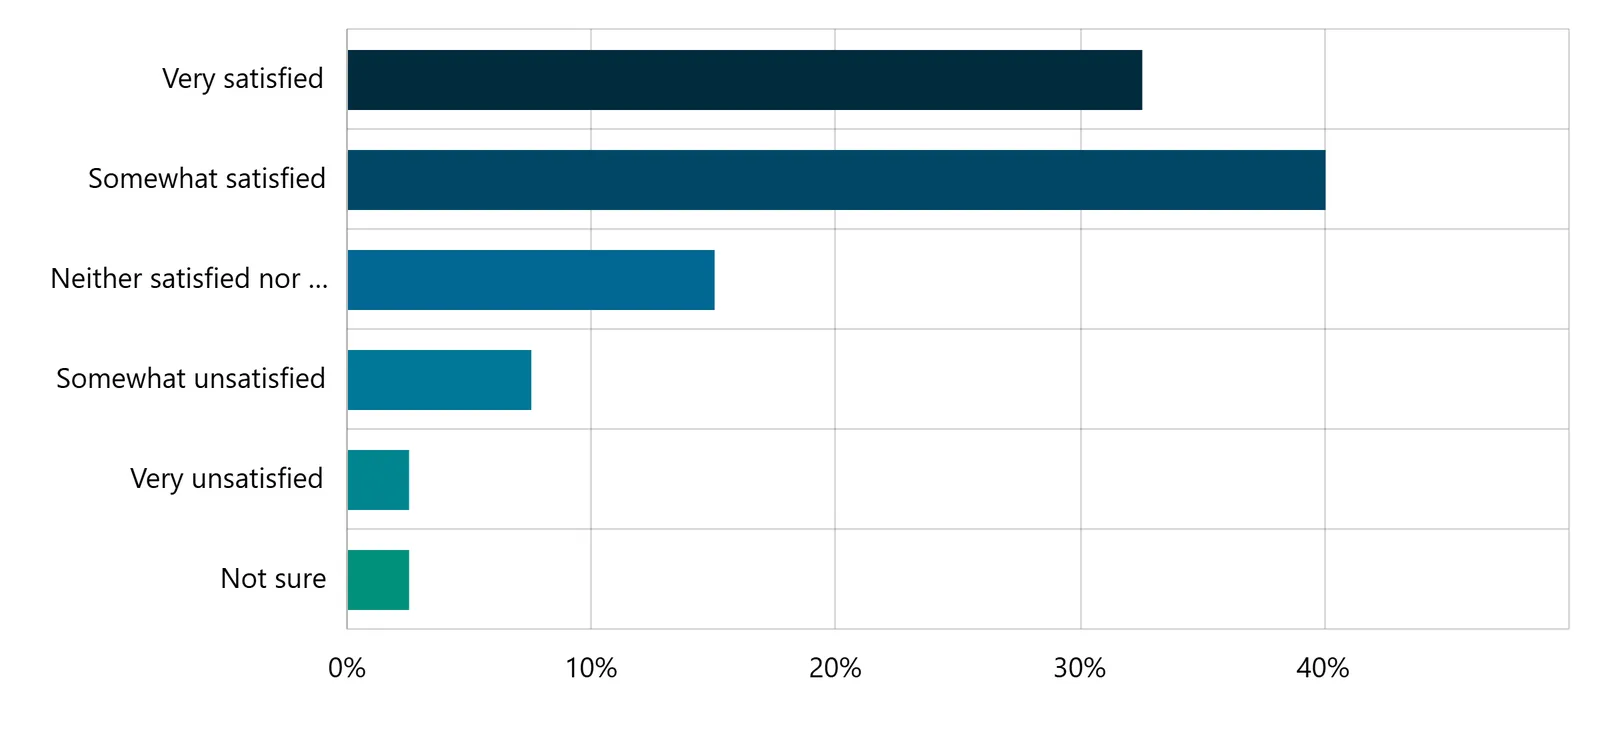
| Answer choices | Percent | Count |
|---|---|---|
| Very satisfied | 32.50% | 13 |
| Somewhat satisfied | 40.00% | 16 |
| Neither satisfied nor unsatisfied | 15.00% | 6 |
| Somewhat unsatisfied | 7.50% | 3 |
| Very unsatisfied | 2.50% | 1 |
| Not sure | 2.50% | 1 |
| Total | 100.00% | 40 |
7. How satisfied are you with the level of Recreation services?
Multi Choice | Skipped: 0 | Answered: 40 (100%)
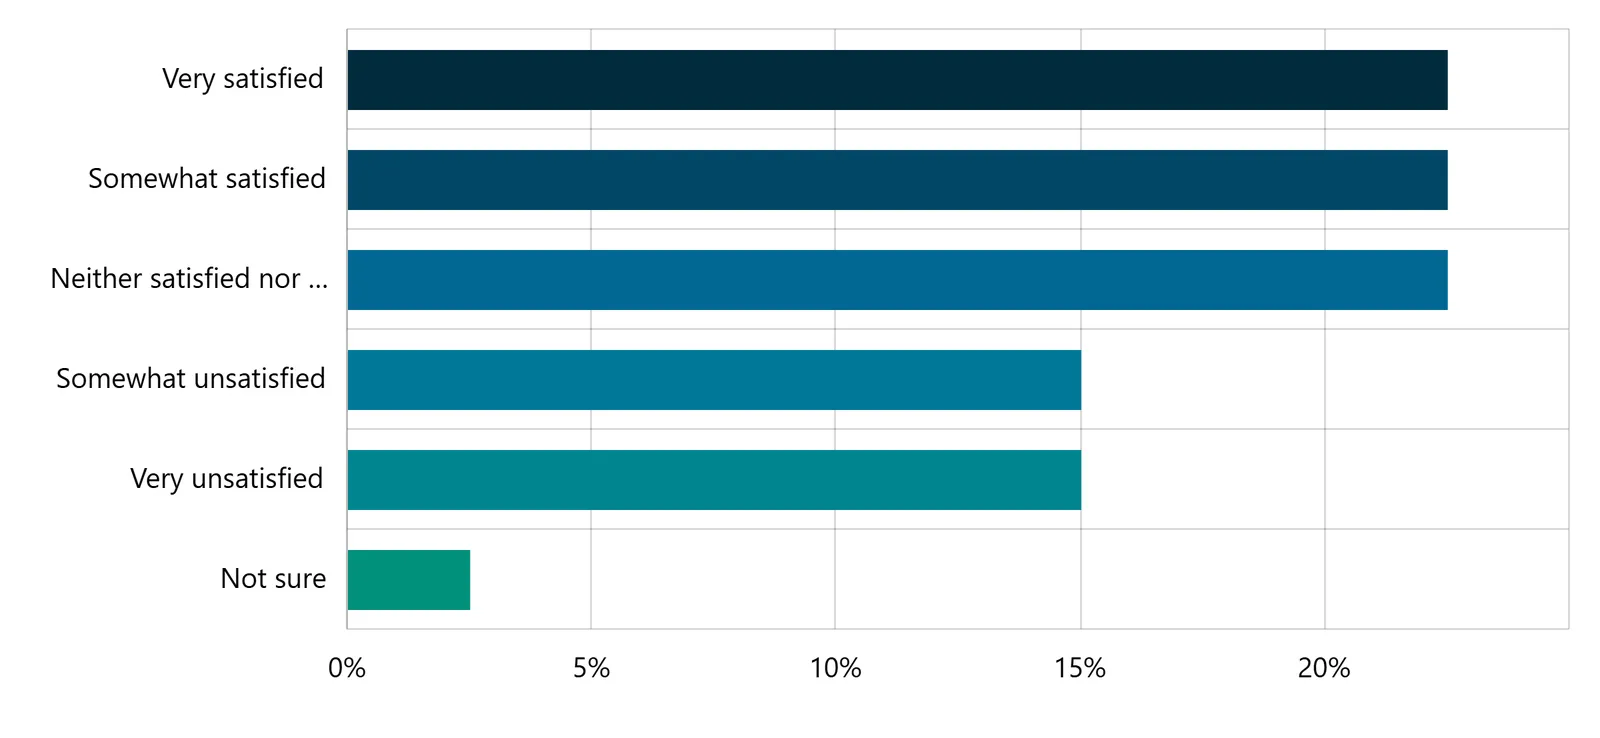
| Answer choices | Percent | Count |
|---|---|---|
| Very satisfied | 22.50% | 9 |
| Somewhat satisfied | 22.50% | 9 |
| Neither satisfied nor unsatisfied | 22.50% | 9 |
| Somewhat unsatisfied | 15.00% | 6 |
| Very unsatisfied | 15.00% | 6 |
| Not sure | 2.50% | 1 |
| Total | 100.00% | 40 |
Document Images
(4)