HOUSING NEEDS - Appendix A
An analysis of housing and employment land needs in View Royal, projecting growth and unit requirements through 2050.
HOUSING NEEDS
Extreme Core Housing Need
As defined by the Canada Mortgage and Housing Corporation and the University of British Columbia’s Housing Assessment Resource Tools, a household is deemed to be in core housing need if they are spending over 30% of its before-tax income on median shelter costs and if housing does not meet one or more of the following standards:
- Adequacy – does not require any major repairs.
- Suitability – has enough bedrooms for the household’s residents.
Extreme Core Housing Need has the same standards as Core Housing Need, except a household is considered to be in extreme core housing need if it is spending over 50% of their before-tax household income on shelter costs.
Table A9 below identifies the total number of owner (with a mortgage) and renter households in Extreme Core Housing Need in 2021, along with the forecasted number of units required for View Royal to provide suitable, affordable, and adequate housing for this group in a 20-year time period.
Table A9. Number and Proportion of Owner and Renter Households in Extreme Core Housing Need^32
| Total Households | 2021 Households | Average Extreme Core Housing Need Rate | Households in Extreme Core Housing Need |
|---|---|---|---|
| Owners | 3,315 | N/A | N/A |
| Owners with a Mortgage | 0.90% | 30.00 | |
| Renters | 1,600 | 9.02% | 144.4 |
| Total New Units to Meet Extreme Core Housing Need – 20 Years | 174.4 |
Housing Supply: Units Required to Meet Housing Needs
Housing Needs: 2026 AND 2041
The following tables include information from the Interim Housing Needs Report, which projects the total number of new units required to meet household growth needs in the short- (5 year) and long- (20 year) term.
Table A10 below uses an average of the municipal and regional growth projections to determine the total new units required to meet anticipated household growth needs in 2041.
Table A10. New Units Needed to Meet Anticipated 20-Year Household Growth Needs^33
| Growth Scenarios | Regional Growth Rate | Households 2021 | Households 2041 | New Units |
|---|---|---|---|---|
| Local Household Growth | N/A | 4,915 | 7,198 | 2,283 |
| Regionally Based Household Growth | 37.6% | 4,915 | 6,761.5 | 1,846.5 |
| Scenario Average | 2,064.8 | |||
| Total New Units to Meet Household Growth Needs – 20 Years | 2,064.8 |
The above information informs the summary of new units in Table A11 (the total from Table A10 is a line item below). Altogether, the Interim Housing Needs Report indicates that a total of 842 units would be required over 5 years and 2,889 over 20 years to 2041 to meet housing needs related to extreme core housing, persons experiencing homelessness, suppressed household formation, anticipated growth, rental vacancy rate adjustment, and local demand in View Royal.
Table A11. Total Number of New Units Needed in the Short- and Long-Term^34
| Housing Need Component | 5 Year Need (2026) | 20 Year Need (2041) | 29 Year Need (2050) |
|---|---|---|---|
| Extreme Core Housing Need | 43.59 | 174.36 | 252.8 |
| Persons Experiencing Homelessness | 28.32 | 56.65 | 82.1 |
| Suppressed Household Formation | 35.56 | 142.24 | 206.2 |
| Anticipated Growth | 621.66 | 2,064.76 | 2993.9 |
| Rental Vacancy Rate Adjustment | 11.57 | 46.28 | 67.0 |
| Additional Local Demand | 101.11 | 404.44 | 586.3 |
| Total New Units – 5 Years | 842 | ||
| Total New Units – 20 Years | 2,889 | ||
| Total New Units – 29 Years | 4,189 |
^32 Information sourced from: Town of View Royal, Housing Needs Assessment Report & Interim Housing Needs Report (Link: Housing Needs Assessment Report & Interim Housing Needs Report). ^33 Information sourced from: Town of View Royal, Housing Needs Assessment Report & Interim Housing Needs Report (Link: Housing Needs Assessment Report & Interim Housing Needs Report). ^34 Information sourced from: Town of View Royal, Housing Needs Assessment Report & Interim Housing Needs Report (Link: Housing Needs Assessment Report & Interim Housing Needs Report).
The Interim Housing Needs Report was completed in September 2024. As of November 2024, a total of 706 new dwelling units are expected to be completed by the end of 2026, which includes 471 rental units and 235 strata units. At that time, two multi-unit buildings totalling 158 dwelling units were partially occupied. When all are summed together, a total of 864 new units are anticipated to be completed by the end of 2026, therefore supporting the Town in meeting its short-term housing need of 842 units (as noted in Table A11 above).
Housing Needs In 2050
Using Table A11 as a reference point, the Interim Housing Needs Report identifies a need for 842 units over 5 years (to 2026) and 2,889 units over 20 years (to 2041). Since the Interim Housing Needs Report timeframe does not align with the Official Community Plan horizon to 2050, these figures were adjusted to estimate housing needs over the longer period.
To do this, the 20-year total of 2,889 units was converted into an average annual housing demand by dividing by 20. This annual rate was then applied to different time periods to align with Official Community Plan milestones:
- 29 years (2021–2050): used to estimate total housing needs to 2050, resulting in an additional 4,189 units beyond the Interim Housing Needs Report timeframe.
- 10 years (2041–2050): used to isolate the additional housing need beyond 2041, resulting in 1,300 units required in addition to the 2,889 units already identified for 2021–2041.
A housing capacity analysis completed for View Royal showed the projected uptake of small-scale multi-unit housing alone will be insufficient to meet long-term housing needs in View Royal by 2050; it is estimated that 2,580-2,703 units will be introduced through these legislative changes. Additional action is necessary to create favourable conditions to address View Royal’s forecasted long-term housing need.
Based on the projected uptake of small-scale multi-unit housing developments in View Royal, housing developments currently under construction, and the selection of test site scenarios from land economics studies completed in 2025 with high development potential and higher permitted densities than what is permitted in the 2011 Official Community Plan and Zoning Bylaw No. 900, it is estimated that approximately 5,366 new dwelling units will be constructed in View Royal over the next 25 years.
If this holds true, View Royal will meet and exceed its projected long-term housing need of 4,189 units. Further discussion on the type of housing (market vs. affordable rental housing) is provided in the following sections.
Note that these numbers are subject to fluctuations based on evolving market conditions, policy decisions, global economic changes, and unforeseen circumstances that could impact housing needs and development trends.
Affordable Rental Housing Need
Three types of affordable rental housing are needed in View Royal to meet the housing need identified in Table A11 and the housing targets issued by the Province in 2024:^35 below-market, market, and supportive. A breakdown of the number of units required for each housing type by the year 2029 (the timeframe identified in the Province’s housing targets) and the year 2050 (the life span of this Official Community Plan), is provided in Table A12 below. This breakdown assumes the following based on the classifications of housing need as discussed in the Interim Housing Needs Report:
- Those experiencing Extreme Core Housing Need require below-market rental housing
- Those experiencing homelessness require supportive housing
The Interim Housing Needs Report does not clearly dictate a number of new affordable market rental units that may be required.
Table A12. Affordable Rental Housing Need by Type for the Years 2029 and 2050
| Rental Housing Type | 2029 | 2050 |
|---|---|---|
| Below-Market | 185 | 252 |
| Market | 236 | N/A |
| Supportive | 11 | 82 |
Approximately 9 below-market units and 3 supportive housing units are needed per year to meet View Royal’s need for these types of housing by the year 2050.
^35 Information sourced from Province of British Columbia Housing Unit Breakdown as Guidance for the Town of View Royal
Market Housing Need
Based on the data provided in Table A11, approximately 3,852 market rental or ownership units are needed in View Royal by the year 2050. This equates to ~133 units per year.
EMPLOYMENT LANDS PROJECTIONS
Commercial Projections
Retail and Service Projections
A market demand study was completed in 2021 that provided locally oriented retail and service space demand projections for View Royal. Projections were calculated under two scenarios:
- Lower Capture Scenario: View Royal captures about 50% of the future trade area,^36 local-oriented retail, and service growth throughout the projection period from 2025 to 2050.
- Higher Capture Scenario: The higher scenario assumes that the proportion of future trade area local-oriented retail and service growth by View Royal increases from 50% in 2025 to 75% from 2030 onwards.
These projections have been updated accordingly to reflect the current market context of View Royal, with results shown in Table A13 and Table A14 below.
^36 Trade area refers to two:
- The local trade area, which includes View Royal, Esquimalt, and Vic West. This area captures spending from residents of these communities who will likely conduct most of their day-to-day shopping (i.e., spending at supermarkets, pharmacies, services) within this trade area.
- The subregional commercial trade area, which includes View Royal, Esquimalt, Vic West, Colwood, Langford, Highlands, and Metchosin. This area is created to understand demand for retail spaces within the local trade area, as well as demand for larger or specialized businesses that will draw in residents from outside of the local trade area.
Table A13. Local Oriented Retail/Service Demand Projections - Lower Scenario^37
| 2025-2030 | 2030-2035 | 2035-2040 | 2040-2045 | 2045-2050 | 2025-2050 | |
|---|---|---|---|---|---|---|
| View Royal Projected Supportable Local Oriented Retail Floor Space Growth (square feet) | 13,500 | 17,500 | 17,000 | 15,000 | 17,500 | 80,500 |
| View Royal Projected Subregional Orientated Retail Floor Space Growth (square feet) | 11,000 | 10,900 | 7,100 | 5,450 | 10,750 | 45,200 |
| View Royal Projected Total Retail/Service Floor Space Growth (square feet) | 24,500 | 28,400 | 24,100 | 20,450 | 28,250 | 125,700 |
| Average Projected Yearly Retail/Service Growth Per Time Period (square feet) | 4,900 | 5,680 | 4,820 | 4,090 | 5,650 | 5,028 |
| 2025 | 2030 | 2035 | 2040 | 2045 | 2050 | |
|---|---|---|---|---|---|---|
| View Royal Supportable Retail/Service Floorspace (square feet) | 528,950 | 553,300 | 581,700 | 605,800 | 626,250 | 654,500 |
^37 Information sourced from: Town of View Royal, Official Community Plan Land Economics Memo (April 14, 2025).
Table A14. Local Oriented Retail/Service Demand Projections - Higher Scenario^38
| 2025-2030 | 2030-2035 | 2035-2040 | 2040-2045 | 2045-2050 | 2025-2050 | |
|---|---|---|---|---|---|---|
| View Royal Projected Supportable Local Orientated Retail Floor Space Growth (square feet) | 20,250 | 26,250 | 25,500 | 22,500 | 26,250 | 120,750 |
| View Royal Projected Subregional Orientated Retail Floor Space Growth (square feet) | 22,000 | 21,800 | 14,200 | 10,900 | 21,500 | 90,400 |
| View Royal Projected Total Retail/Service Floor Space Growth (square feet) | 42,250 | 48,050 | 39,700 | 33,400 | 47,750 | 211,150 |
| Average Projected Yearly Retail/Service Growth Per Time Period (square feet) | 8,450 | 9,610 | 7,940 | 6,680 | 9,550 | 8,446 |
| 2025 | 2030 | 2035 | 2040 | 2045 | 2050 | |
|---|---|---|---|---|---|---|
| View Royal Supportable Retail/Service Floorspace (square feet) | 528,950 | 571,200 | 619,250 | 658,950 | 692,350 | 740,100 |
^38 Information sourced from: Town of View Royal, Official Community Plan Land Economics Memo (April 14, 2025).
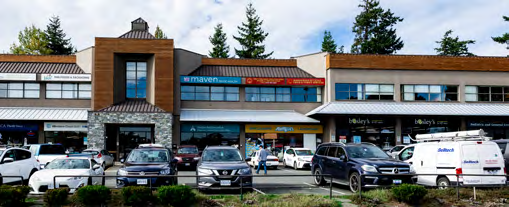
The projections show that the supportable total retail and service floorspace in View Royal could increase by about 125,700 square feet (11,678 square metres) and 211,150 square feet (19,616 square metres) between 2025 and 2050. This is equivalent to annual retail and service growth of about 5,030 square feet to 8,450 square feet per year on average.
Office Space Projections
Recent development indicates that the suburban share of Greater Victoria’s office space is down from 35% in 2019 to 33% (as it was in 2006). Trends in office development suggest that the Town should re-evaluate office space growth to 2031 to a much lower share of growth, and a more modest growth rate thereafter to 2050. Based on this information, two projection scenarios were prepared:
- Lower Growth Scenario (Table A15): Suburban office growth share is 33%, with View Royal’s remaining at 7.7% (as it was in 2001)—both figures are consistent between 2025 and 2050.
- Higher Growth Scenario (Table A16): Same 7.7% of suburban growth for the 2025-2030 period and increasing by 1% for each subsequent 5-year period beyond 2030 to 2050.
Across both scenarios, the overall growth in floor space will remain the same; according to Colliers, the Greater Victoria market saw approximately 150,000 sq. ft. (13,945 square metres) of new office space under development in 2024, a figure confirmed by the net annual growth in office space between 2019 and 2023 prepared by CoStar.
Table A15. Office Space Projections, Lower Growth Scenario^39
| Average Annual Office Development (square feet) | 2019-2025 | 2025-2030 | 2030-2035 | 2035-2040 | 2040-2045 | 2045-2050 |
|---|---|---|---|---|---|---|
| Greater Victoria | 135,000 | 135,000 | 135,000 | 135,000 | 135,000 | 135,000 |
| Suburban Office Market Share | 33.0% | 33.0% | 33.0% | 33.0% | 33.0% | 33.0% |
| Suburban Office Market | 44,000 | 44,000 | 44,000 | 44,000 | 44,000 | 44,000 |
| View Royal Share | 0.0% | 7.7% | 7.7% | 7.7% | 7.7% | 7.7% |
| View Royal | - | 3,400 | 3,400 | 3,400 | 3,400 | 3,400 |
| Projected Total Office Floorspace | 2019 | 2025 | 2030 | 2035 | 2040 | 2045 | 2050 |
|---|---|---|---|---|---|---|---|
| Greater Victoria^40 | 12,898,405 | 13,708,405 | 14,383,405 | 15,058,405 | 15,733,405 | 16,408,405 | 17,082,405 |
| Suburban Office Market Share | 35.3% | 35.1% | 35.0% | 34.9% | 34.8% | 34.7% | 34.6% |
| Suburban Office Market^41 | 4,551,601 | 4,815,601 | 5,035,601 | 5,255,601 | 5,475,601 | 5,695,601 | 5,915,601 |
| View Royal Share | 3.2% | 3.1% | 3.3% | 3.4% | 3.6% | 3.8% | 3.9% |
| View Royal | 146,910 | 146,910 | 163,910 | 180,910 | 197,910 | 214,910 | 231,910 |
| View Royal Growth from 2025 (square feet) | n/a | - | 17,000 | 34,000 | 51,000 | 68,000 | 85,000 |
^39 Information sourced from: Town of View Royal, Official Community Plan Land Economics Memo (April 14, 2025). ^40 British Columbia Assessment ^41 The suburban office market is the Greater Victoria office market, excluding the City of Victoria
Table A16. Office Space Projections, Higher Growth Scenario^42
| Average Annual Office Development (square feet) | 2019-2025 | 2025-2030 | 2030-2035 | 2035-2040 | 2040-2045 | 2045-2050 |
|---|---|---|---|---|---|---|
| Greater Victoria | 150,000 | 150,000 | 150,000 | 150,000 | 150,000 | 150,000 |
| Suburban Office Market Share | 33.0% | 33.0% | 34.0% | 35.0% | 36.0% | 37.0% |
| Suburban Office Market | 49,000 | 49,000 | 51,000 | 52,000 | 54,000 | 55,000 |
| View Royal Share | 0.0% | 7.7% | 8.7% | 9.7% | 10.7% | 11.7% |
| View Royal | - | 3,800 | 4,400 | 5,000 | 5,800 | 6,400 |
| Projected Total Office Floorspace | 2019 | 2025 | 2030 | 2035 | 2040 | 2045 | 2050 |
|---|---|---|---|---|---|---|---|
| Greater Victoria^43 | 12,898,405 | 13,798,405 | 14,548,405 | 15,298,405 | 16,048,405 | 16,798,405 | 17,548,405 |
| Suburban Office Market Share | 35.3% | 35.1% | 35.0% | 34.9% | 34.9% | 35.0% | 35.0% |
| Suburban Office Market^44 | 4,551,601 | 4,845,601 | 5,090,601 | 5,345,601 | 5,605,601 | 5,875,601 | 6,150,601 |
| View Royal Share | 3.2% | 3.0% | 3.3% | 3.5% | 3.8% | 4.1% | 4.5% |
| View Royal | 146,910 | 146,910 | 165,910 | 187,910 | 212,910 | 241,910 | 273,910 |
| View Royal Growth from 2025 (square feet) | n/a | - | 19,000 | 41,000 | 66,000 | 95,000 | 127,000 |
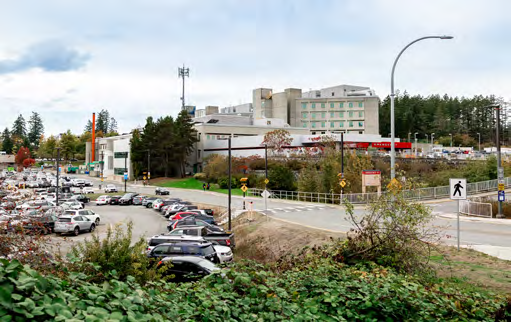
Overall, it is anticipated that office floorspace growth in View Royal could increase by 85,000 square feet (7,897 square metres) to 127,000 square feet (11,799 square metres) between 2025 and 2050. Due to View Royal’s proximity to the Victoria General Hospital, it is anticipated that this demand will be for medical-related office space (e.g., professional and personal services).
^42 Information sourced from: Town of View Royal, Official Community Plan Land Economics Memo (April 14, 2025). ^43 British Columbia Assessment ^44 The suburban office market is the Greater Victoria office market, excluding the City of Victoria
Industrial Projections
Since 2011, the Town has not seen any new building permits for industrial development, except for one building addition that is a mixed-use commercial and industrial development. Given historic building permit and construction trends, Town regulations, and the current market conditions for industrial development in View Royal, it is anticipated that there will be little to no growth in industrial land uses if the current conditions remain.
Accommodations in this Official Community Plan have been made to enhance the permissiveness of light industrial uses within the Western Gateway Employment District Corridor designation, as outlined in section 5.2. If approximately 30% of the developable area of parcels with this land use designation are built out for industrial purposes within the lifespan of this plan, approximately 862,819 square feet (80,158 square metres) of industrial development could be added to View Royal.
Institutional Projections
Based on historic building permit data for public/institutional land uses from 2011 to 2024, it is anticipated that there will be approximately 8,008 square feet (744 square metres) of institutional development constructed in the Town each year, or an estimated total of 200,112 square feet (18,591 square metres) of new institutional development over a 25-year period. Examples of potential institutional developments include new or expanded hospital facilities, medical offices or clinics, BC Transit facilities, public utility and service buildings, and educational facilities.