Exhibits 1-11: Traffic Performance Data and Volumes
Visual exhibits depicting traffic performance, volumes, and mitigation scenarios for the Christie Point development.
Christie Point TIA Exhibits
Exhibit 1: Christie Point PM Total (2018) Using Observed Trip Rates Operations - No Mitigation
April 2017 | Scale NTS
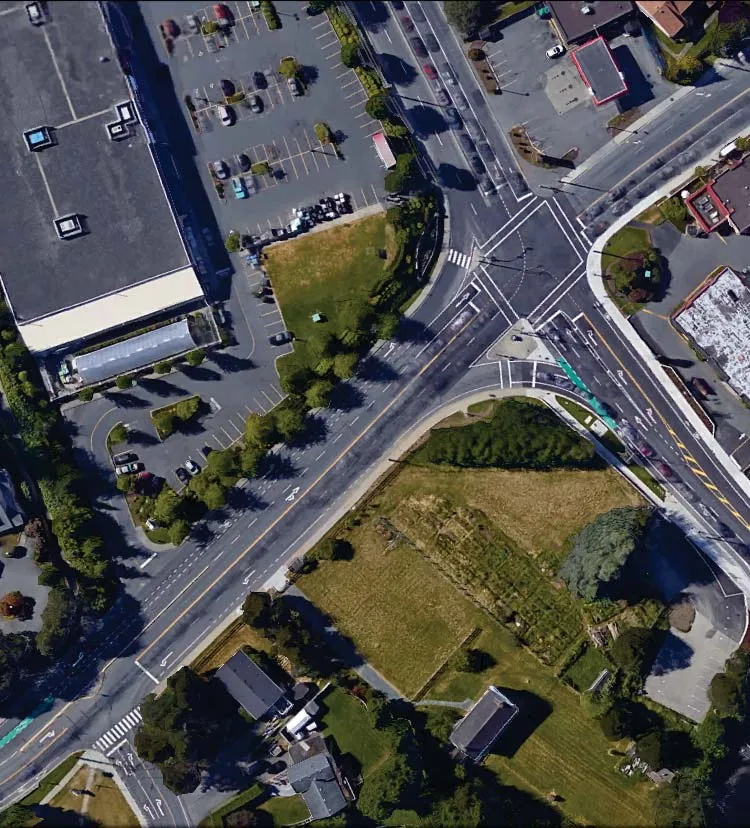
Traffic Performance Data (Synchro 9.0 HCM):
- Shoreline Drive & Island Highway: Overall V/C 0.57, Overall LOS F
- Admirals Road & Island Highway: Overall V/C 0.89, Overall LOS D
Legend:
- LOS A to D: V/C ≤ 0.85
- LOS E: 0.85 < V/C ≤ 0.90
- LOS F: V/C > 0.90
- *: 95th % Queue exceeds available storage
Exhibit 2: Christie Point PM Total (2018) Using ITE Trip Rates Operations - No Mitigation
April 2017 | Scale NTS
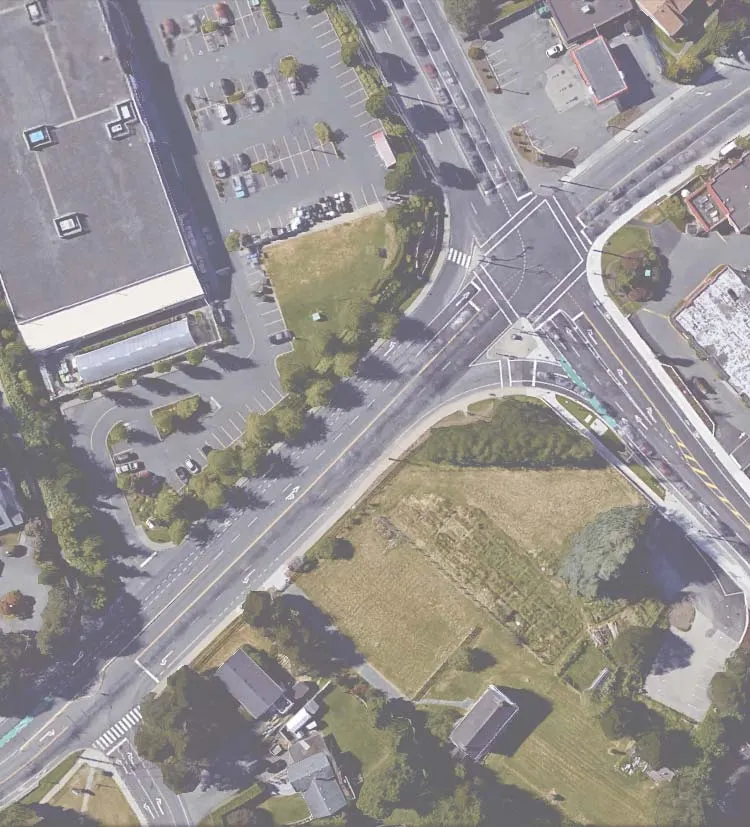
Traffic Performance Data (Synchro 9.0 HCM):
- Shoreline Drive & Island Highway: Overall V/C 0.78, Overall LOS F
- Admirals Road & Island Highway: Overall V/C 0.99, Overall LOS E
Exhibit 3: Christie Point PM Background 2028 Traffic Performance - No Mitigation
April 2017 | Scale NTS
Traffic Performance Data (Synchro 9.0 HCM):
- Shoreline Drive & Island Highway: Overall V/C 0.97, Overall LOS F
- Admirals Road & Island Highway: Overall V/C 1.05, Overall LOS E
Exhibit 4: Christie Point PM Total (2028) Using Observed Trip Rates Traffic Operations - No Mitigation
April 2017 | Scale NTS
Traffic Performance Data (Synchro 9.0 HCM):
- Shoreline Drive & Island Highway: Overall V/C 1.12, Overall LOS F
- Admirals Road & Island Highway: Overall V/C 1.18, Overall LOS F
Exhibit 5: Christie Point PM Total (2028) Using ITE Rates Traffic Performance - No Mitigation
April 2017 | Scale NTS
Traffic Performance Data (Synchro 9.0 HCM):
- Shoreline Drive & Island Highway: Overall V/C 1.76, Overall LOS F
- Admirals Road & Island Highway: Overall V/C 1.23, Overall LOS F
Exhibit 6: Christie Point PM Total 2028 Performance - ITE Rates + Traffic Signal and Extension of Two Westbound Lanes
April 2017 | Scale NTS
Staff Analysis Note: Introducing a Traffic Signal at Shoreline Drive in conjunction with the extension of two westbound through lanes to a point west of Shoreline Drive is shown to result in improved operating conditions at this intersection and is also expected to reduce spill back impacts to the Admirals Road intersection.
Traffic Performance Data (Synchro 9.0 HCM):
- Shoreline Drive & Island Highway: Overall V/C 0.71, Overall LOS A
- Admirals Road & Island Highway: Overall V/C 0.86, Overall LOS D
Exhibit 7: Christie Point AM Existing Peak Hour Volumes
April 2017 | Scale NTS
Traffic Performance Data (Synchro 9.0 HCM):
- Peak Hour was 8:00 to 9:00 AM
Exhibit 8: Christie Point AM Existing (2017) Operations - No Mitigation
April 2017 | Scale NTS
Traffic Performance Data (Synchro 9.0 HCM):
- Shoreline Drive & Island Highway: Overall V/C 0.09, Overall LOS F
- Admirals Road & Island Highway: Overall V/C 0.79, Overall LOS D
Exhibit 9: Christie Point AM Background 2028 Operations - No Mitigation
April 2017 | Scale NTS
Traffic Performance Data (Synchro 9.0 HCM):
- Shoreline Drive & Island Highway: Overall V/C 0.14, Overall LOS F
- Admirals Road & Island Highway: Overall V/C 1.00, Overall LOS E
Exhibit 10: Christie Point AM Total 2028 Using ITE Rates Operations - No Mitigation
April 2017 | Scale NTS
Traffic Performance Data (Synchro 9.0 HCM):
- Shoreline Drive & Island Highway: Overall V/C 0.43, Overall LOS F
- Admirals Road & Island Highway: Overall V/C 1.05, Overall LOS E
Exhibit 11: Christie Point AM Total 2028 Using ITE Rates Operations - Signal at Shoreline + WB Lane Extension
April 2017 | Scale NTS
Traffic Performance Data (Synchro 9.0 HCM):
- Shoreline Drive & Island Highway: Overall V/C 1.00, Overall LOS C
- Admirals Road & Island Highway: Overall V/C 1.05, Overall LOS E
Document Images
(1)