Town of View Royal 2024 Consolidated Financial Statements Highlights (Presentation)
Staff presentation providing visual highlights of the town's financial position, revenue sources, and expenses for 2024.
Town of View Royal
2024 Consolidated Financial Statements Highlights
Steven Vella, Director of Finance May 13, 2025
Contents
- Management’s responsibility for financial reporting
- Auditor’s report
- Consolidated Statements:
- Financial Position
- Operations
- Net Financial Assets
- Cash Flows
- Notes
- Segment Disclosures
- Tangible Capital Assets
Who does what?
Management’s responsibility
- To prepare compliant financial statements that are objective, consistent and have integrity
Auditor’s responsibility
- Conduct independent examination
- Evaluate the systems of internal control
- Express an opinion on the financial statements – do they fairly represent the actual position of the Town?
Mayor and Council’s responsibility
- Make sure management does its job
- Meet with management and auditors to review and discuss matters
Financial Position
| 2024 | 2023 | |
|---|---|---|
| Financial Assets | $55,425,824 | $51,259,372 |
| Liabilities (excluding MFA Debt) | 20,312,272 | 19,240,856 |
| Municipal Finance Authority Debt | 3,688,412 | 4,146,384 |
| Net financial assets | 31,425,140 | 27,872,132 |
| Tangible capital assets | 123,278,43 | 122,183,649 |
Revenues - $26.1 Million - Comparison of Budget to Actuals
[Chart: Bar chart comparing Budget, 2024 Actuals, and 2023 Actuals for the following revenue categories: Taxes for municipal purposes, User charges and sales of services, Government grants and transfers, Contributions from developers and others, Development charges earned, Investment income, and Other revenue from own sources]
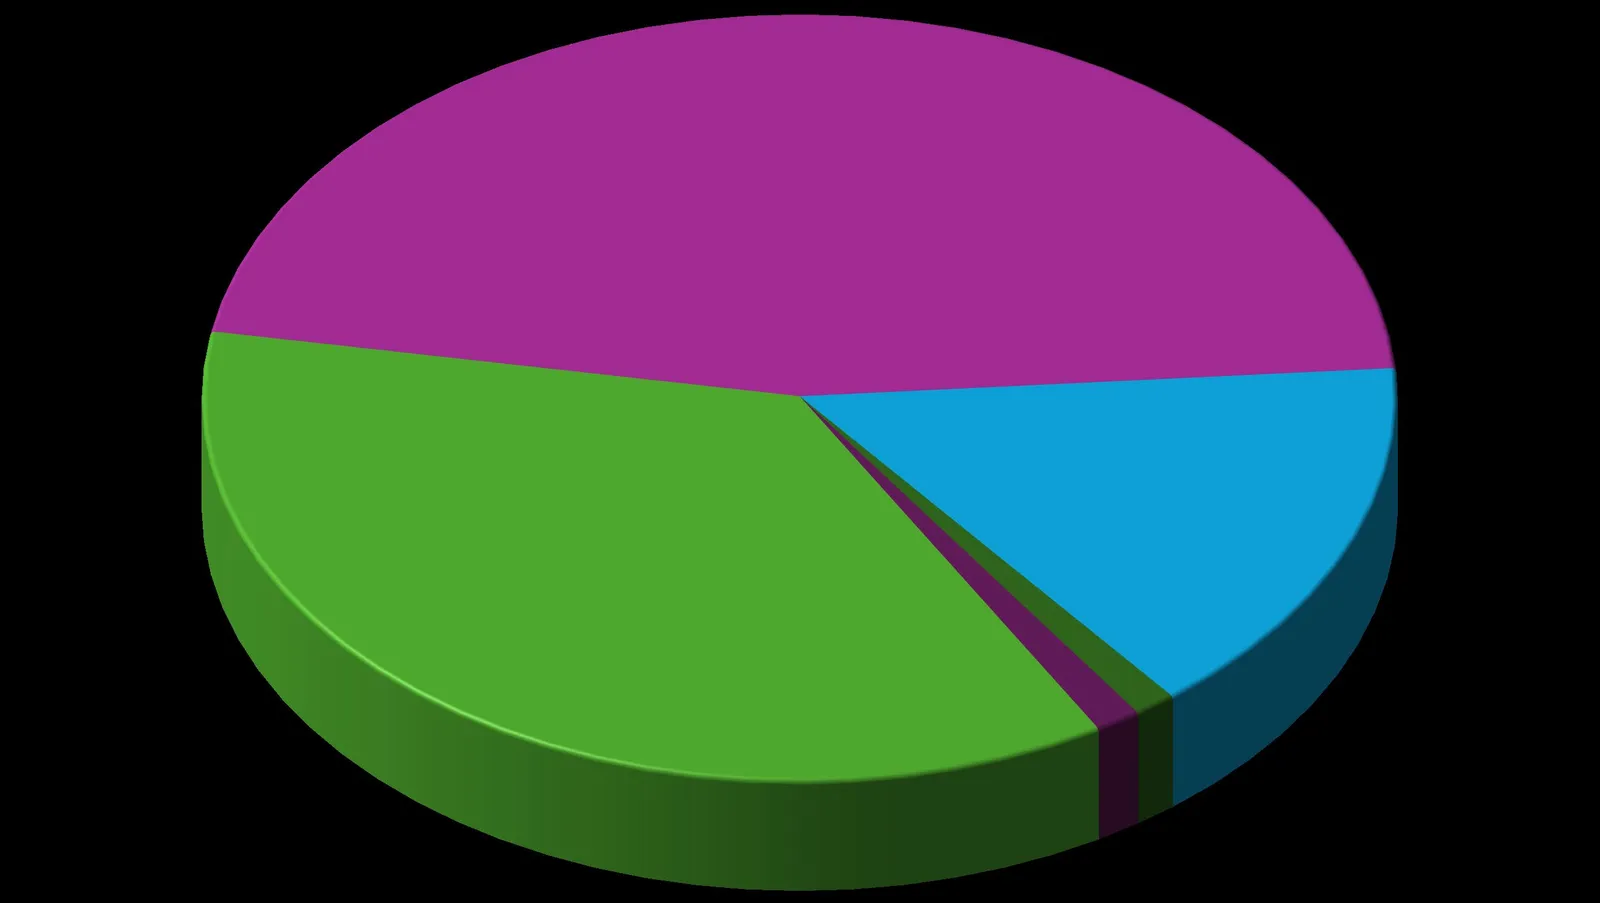
Revenues – $26.1 Million - Breakdown by Source

- Taxes for municipal purposes: $12,209,528 (47%)
- User charges and sales of services: $5,842,294 (22%)
- Government grants and transfers: $3,883,449 (15%)
- Investment income: $2,059,442 (8%)
- Contributions from developers and others: $1,049,550 (4%)
- Other revenue and miscellaneous: $1,070,431 (4%)
Expenses - $21.4 Million - Comparison of Budget to Actuals
[Chart: Bar chart comparing Budget, 2024 Actuals, and 2023 Actuals for the following expense categories: Protective services, Transportation services, Recreation and cultural services, General government services, Environmental health services, and Development services]
Expense – $21.4 Million - Breakdown by Type
- Goods and services: $9,891,306 (46%)
- Labour and benefits: $7,729,589 (36%)
- Amortization: $3,314,066 (16%)
- Debt interest: $266,198 (1%)
- Change in proportionate share of WSPR: $245,655 (1%)
Changes in Net Financial Assets
| 2024 | 2023 | |
|---|---|---|
| Annual Surplus (Statement of Operations) | $4,667,880 | $7,356,529 |
| Acquisition of tangible capital assets | (4,753,869) | (2,780,314) |
| Amortization of tangible capital assets | 3,314,066 | 3,164,434 |
| Other items | 324,931 | 248,301 |
| Change in net financial assets | $3,553,008 | $7,988,950 |
Accumulated Surplus (Note 10)
| Accumulated Surplus | 2024 | 2023 |
|---|---|---|
| Equity in physical assets | $119,662,495 | $118,108,469 |
| Appropriated surplus | 7,725,420 | 7,707,420 |
| Unrestricted accumulated surplus | 8,409,814 | 7,043,418 |
| Restricted surplus | 19,073,220 | 17,343,762 |
| Total Accumulated Surplus | $154,870,949 | $150,203,069 |
Accumulated surplus
Restricted surplus
| Restricted surplus | 2024 | 2023 |
|---|---|---|
| Capital Renewal | $1,864,669 | $ 1,162,286 |
| Capital Works and Land Acquisition | 1,538,966 | 1,412,971 |
| Cash in lieu of Parking | 521,335 | - |
| Community Amenity Contributions | 2,270,697 | 1,623,239 |
| Fire Department Equipment | 193,381 | 159,125 |
| Future Operating Expenditures | 1,465,086 | 1,244,334 |
| Growing Communities | 3,805,285 | 4,879,515 |
| Machinery and Equipment Depreciation | 219,031 | 288,161 |
| Parks and Open Space | 1,584,354 | 1,505,786 |
| Parks Improvements | 766,039 | 612,952 |
| Police Equipment, Property and Contract | 382,675 | 365,896 |
| Police Operation and Maintenance | 2,890,775 | 2,218,321 |
| Sewer System Capital | 1,201,652 | 1,509,998 |
| West Shore Parks and Rec. Society reserves | 369,275 | 361,178 |
| Total | 19,073,220 | $17,343,762 |
Document Images
(1)