Town of View Royal Land Economics Study Update (2025)
Urban Systems memorandum updating demand projections for retail, office, and hotel space and assessing development viability.
MEMORANDUM
DATE: April 14, 2025 TO: Leanne Taylor, Director of Development Planning, Town of View Royal FROM: Urban Systems Ltd. FILE: 2032.0009.01 SUBJECT: Town of View Royal Land Economics Study Update (2025)
1.0 INTRODUCTION
Urban Systems was retained by the Town of View Royal to update the Official Community Plan which will set out the community’s land use vision for 2025 to 2050. As part of the project, Urban Systems was retained to prepare high-level market opportunity assessments for retail / commercial, office and hotel uses, and to prepare case study financial feasibility assessments for mixed-use development, including light industrial uses. Each is intended to inform land use and related policy within the OCP. All analyses are intended as updates to a report prepared by Coriolis Consulting for View Royal in 2021, entitled Land Economics Study: Evaluation of the Prospects for New Urban Development.
The purpose of this memo is to present:
- Updates to the commercial space demand projections for View Royal for 2025 to 2050 based on most recent population projections of municipalities and relevant trade area geographic extent;
- Updates to the office space demand projections for View Royal for 2025 to 2050 based on recent office development trends;
- Update the hotel demand projections based on recent hotel development trends for 2025 to 2050; and
- Assess the development viability of different mixed-use scenarios (retail, office, and light industrial) across case study sites in View Royal.
As this is an update to the 2021 study, many of the assumptions from the original study were retained. Where it was deemed necessary, and to the extent made feasible by allotted time and budget, market inputs were updated based on Urban Systems’ (USL) conversations with local developers and brokers. These updated inputs, and data or methodological limitations, are called out throughout the memorandum.
2.0 RETAIL, OFFICE, AND HOTEL DEMAND PROJECTIONS
This section presents the demand projections for retail, office, and hotel space for View Royal for the next 25 years from 2025 to 2050.
2.1 POPULATION PROJECTION UPDATE
Following the approach adopted by Coriolis Consulting in the 2021 report, the population projections for the Town of View Royal and the Capital Region have been updated and adopted as the base for commercial-retail demand projections, focusing on the following geographic areas:
- Town of View Royal
- Local trade area for View Royal
- Subregional trade area for View Royal
- Capital Regional District (i.e., Greater Victoria Area)
The population projections are updated based on the most current BC Stats population projections at the municipal level (February 2025). The results are shown in Table 1 below.
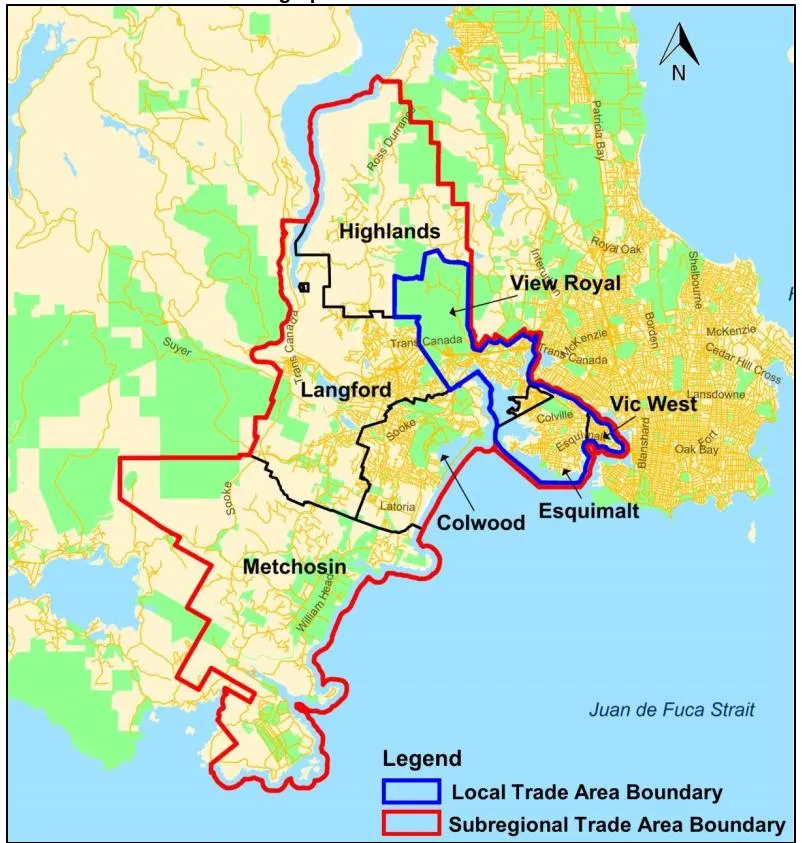
Following the approach adopted in the 2021 report by Coriolis, the commercial trade area for View Royal is divided into “local” and “subregional” trade areas:
- The local trade area includes View Royal, Esquimalt and Vic West. This trade area captures spending from residents of these communities who will likely conduct most of their day-to-day shopping (i.e., spending at supermarkets, pharmacies, services) within this trade area.
- The subregional trade area is a broader geography and includes View Royal, Esquimalt, Vic West, Colwood, Langford, Highlands and Metchosin. This is intended to understand demand for retail spaces within the local trade area, as well as demand for larger or specialized businesses that will draw in residents from outside of the local trade area.
Table 1: Population Projections, View Royal and Commercial Trade Area, 2025-2050
| Estimate 2019 | Projected 2025 | Projected 2030 | Projected 2035 | Projected 2040 | Projected 2045 | Projected 2050 | Average Annual Growth Rate, 2025-2050 (%) | 2021 Coriolis Projected Average Annual Growth Rate, 2019-2040 (%) | |
|---|---|---|---|---|---|---|---|---|---|
| View Royal | 11,318 | 13,085 | 13,860 | 14,827 | 15,623 | 16,230 | 17,128 | 1.1% | 1.8% |
| Esquimalt¹ | 18,716 | 19,116 | 19,520 | 19,932 | 20,353 | 20,783 | 21,221 | 0.4% | 1.2% |
| Victoria West² | 8,138 | 8,744 | 8,839 | 9,138 | 9,536 | 9,957 | 10,286 | 0.7% | 1.8% |
| Local Trade Area | 38,172 | 40,945 | 41,269 | 42,489 | 43,802 | 44,983 | 46,347 | 0.5% | 1.5% |
| Langford | 42,653 | 60,407 | 72,625 | 83,755 | 89,512 | 93,073 | 103,695 | 2.2% | 3.3% |
| Colwood | 18,867 | 22,273 | 23,314 | 24,916 | 26,879 | 28,971 | 30,939 | 1.3% | 1.4% |
| Metchosin | 5,168 | 5,288 | 5,059 | 4,956 | 4,912 | 4,887 | 4,792 | -0.4% | 1.4% |
| Highlands | 2,481 | 3,018 | 3,207 | 3,409 | 3,599 | 3,753 | 3,963 | 1.1% | 0.4% |
| Subregional Trade Area | 107,341 | 131,931 | 145,474 | 159,525 | 168,704 | 175,667 | 189,736 | 1.5% | 2.2% |
| Greater Victoria Area | 418,262 | 465,807 | 478,193 | 498,776 | 517,401 | 534,088 | 552,668 | 0.7% | 1.2% |
¹ The projected population for Esquimalt is derived from the historical 20-year average compound annual growth rate (CAGR) from 2001 to 2021 to better reflect the long-term population trajectory and the recent population and development growth observed in the community compared to the BC Stats projection. ² Victoria West population projection numbers are derived from applying the same proportion of Victoria West in 2019 reported in the Coriolis report relative to population estimates in Community Health Service Area (CHSA) 4111 Downtown Victoria / Vic West from BC Stats in 2019 to the population projection for the same CHSA area.
The new population projections show that overall growth in the region will be slower than indicated in the previous 2021 report. The slower growth is driven by the projected regional trend overall as a result of slower immigration forecasted by BC Stats. The following projected trends from 2025 to 2050 are most notable:
- The local trade area population is expected to grow at an average annual rate of 0.5%, reaching about 46,350 by 2050. This is down from an average annual rate of 1.5% in the 2021 report.
- The subregional trade area population will grow at an average annual rate of 1.5%, reaching around 189,740 by 2050. This is down from 2.2% in the 2021 report.
- As a comparison, the Greater Victoria Area is projected to grow at an average annual rate of 0.7%. This is down from 1.2% in the 2021 report.
2.2 RETAIL AND SERVICE DEMAND ANALYSIS
As outlined in the 2021 report, retail and service businesses are divided into two broad categories for the purposes of this forecast:
- Local oriented retail and service businesses – defined as businesses that meet the day-to-day needs of residents. Examples of local retail and service businesses include food stores, restaurants and cafes, drycleaners, hair salons, pharmacies, liquor stores, dollar stores, convenience stores, fitness outlets, local hardware stores, and bank branches.
- Regional oriented retail and service businesses – defined as regional businesses that draw customers in from a broader geography (i.e., ‘destination’ shoppers). The spending at these businesses are typically higher as they offer more specialized goods and services that draw customers from further afield. Examples of this type of business include clothing and department stores, home décor and large building supply stores, jewelers, chain restaurants.
The supportable retail and service floorspace in each trade area is derived based on benchmark supportable retail and service floorspace per capita metrics, for each of the above respective broad retail categories. The parameters identified in the 2021 Coriolis report were based on retail floorspace data by municipality as derived from BC Assessment Authority data in 2019³. These adopted as follows:
- A supportable “local oriented retail and service” space of 21 square feet per capita among residents within the local trade area.
- A supportable “regional oriented” retail and service space of 15 square feet per capita within the region (Based on the derivation of 19 square feet per capita of regional oriented retail space across the Capital Regional District, where 4 square feet per capita will be exported to other parts of the region such as Downtown Victoria and regional malls).
It should be noted that the supportable retail and service floorspace per capita parameters are derived based on 2019 commercial floorspace data from BC Assessment, which may not reflect the most recent local and regional trends in retail and commercial service floorspace. More recent retail inventory data from nearby comparable municipalities (e.g. Colwood) indicates similar prevailing retail floorspace per capita figures as those adopted for View Royal in this analysis; this check provides some further evidentiary basis for the floorspace per capita parameters presented in 2021 and adopted for this analysis. Should future inventory data from BC Assessment become available, or if an ‘on the ground’ inventory can be completed (preferable), then it is recommended that this analysis be updated. Further, a stand-alone retail demand analysis that delves into specific retail categories and category-specific shopping patterns could be undertaken at a future date, to provide greater insights into supportable floor area extent and tenant mix for View Royal as a whole, and for each of the Town’s retail nodes and corridors individually. Such an analysis could be used as the basis for developing retail attraction and retention strategies.
³ There are significant methodological limitations to using BC Assessment data for establishing an accurate retail inventory due to the way the leasable area is treated and coded in the dataset.
2.2.1 Local Oriented Retail and Service Space Projection
Per the 2021 Coriolis report, the local oriented retail and service space demand projection is broken out into lower and higher capture scenarios for View Royal:
- Lower Capture Scenario: View Royal captures about 50% of future trade area local oriented retail and service growth throughout the projection period from 2025 to 2050. The results are shown below in Table 2 below.
- Higher Capture Scenario: The higher scenario assumes that the proportion of future trade area local oriented retail and service growth by View Royal increases from 50% in 2025 to 75% from 2030 onwards. The results are shown in Table 3 below.
Table 2: Local Oriented Retail/Service Demand Projections – Lower Scenario
| Estimated 2025 | Projected 2030 | Projected 2035 | Projected 2040 | Projected 2045 | Projected 2050 | |
|---|---|---|---|---|---|---|
| Local Area Trade Population | 40,945 | 42,219 | 43,897 | 45,512 | 46,970 | 48,635 |
| Local Trade Area Retail/Service Floorspace Per Person (SF) | 21 | 21 | 21 | 21 | 21 | 21 |
| Supportable Local Oriented Retail/Service Floorspace (SF) | 860,000 | 887,000 | 922,000 | 956,000 | 986,000 | 1,021,000 |
| Potential Growth in Local Trade Area Retail/Service Floorspace (SF) | n/a | 27,000 | 35,000 | 34,000 | 30,000 | 35,000 |
| View Royal Share | 50% | 50% | 50% | 50% | 50% | 50% |
| Potential Growth in View Royal Retail/Service Floorspace (SF) | n/a | 13,500 | 17,500 | 17,000 | 15,000 | 17,500 |
| View Royal Supportable Retail/Service Floorspace (SF) | 430,000 | 443,500 | 461,000 | 478,000 | 493,000 | 510,500 |
| Cumulative Local Oriented View Royal Retail/Service Growth From 2025 (SF) | n/a | 13,500 | 31,000 | 48,000 | 63,000 | 80,500 |
Table 3: Local Oriented Retail/Service Demand Projections – Higher Scenario
| Estimated 2025 | Projected 2030 | Projected 2035 | Projected 2040 | Projected 2045 | Projected 2050 | |
|---|---|---|---|---|---|---|
| Local Area Trade Population | 40,945 | 42,219 | 43,897 | 45,512 | 46,970 | 48,635 |
| Local Trade Area Retail/Service Floorspace Per Person (SF) | 21 | 21 | 21 | 21 | 21 | 21 |
| Supportable Local Oriented Retail/Service Floorspace (SF) | 860,000 | 887,000 | 922,000 | 956,000 | 986,000 | 1,021,000 |
| Potential Growth in Local Trade Area Retail/Service Floorspace (SF) | n/a | 27,000 | 35,000 | 34,000 | 30,000 | 35,000 |
| View Royal Share | 50% | 75% | 75% | 75% | 75% | 75% |
| Potential Growth in View Royal Retail/Service Floorspace (SF) | n/a | 20,250 | 26,250 | 25,500 | 22,500 | 26,250 |
| View Royal Supportable Retail/Service Floorspace (SF) | 430,000 | 450,250 | 476,500 | 502,000 | 524,500 | 550,750 |
| Cumulative Local Oriented View Royal Retail/Service Growth From 2025 (SF) | n/a | 20,250 | 46,500 | 72,000 | 94,500 | 120,750 |
Results in Table 2 and Table 3 show that the incremental potential supportable local oriented retail and service space in the Town of View Royal ranges from 80,500 to 120,750 square feet in the next 25 years, for an average supportable addition of 3,220 to 4,830 square feet of local retail per annum.
2.2.2 Regional Oriented Retail and Service Space Projection
The regional oriented commercial forecasts include a lower and a higher scenario for View Royal:
- Lower Capture Scenario: Assumes that View Royal captures about 5% of future trade area regional oriented retail and service growth from 2025 to 2050. The results are shown in Table 4 below.
- Higher Capture Scenario: The higher scenario assumes that the proportion of future trade area regional oriented retail and service growth increases from 5% in 2025 to 10% from 2030 onwards. The results are shown in Table 5 below.
Table 4: Regional Oriented Retail/Service Demand Projections – Lower Scenario
| Estimated 2025 | Projected 2030 | Projected 2035 | Projected 2040 | Projected 2045 | Projected 2050 | |
|---|---|---|---|---|---|---|
| Subregional Area Population | 131,931 | 146,424 | 160,933 | 170,414 | 177,654 | 192,024 |
| Subregional Orientated Retail/Service Floorspace Per Person (SF) | 15 | 15 | 15 | 15 | 15 | 15 |
| Supportable Subregional Area Retail/Service Floorspace (SF) | 1,979,000 | 2,196,000 | 2,414,000 | 2,556,000 | 2,665,000 | 2,880,000 |
| Potential Growth in Subregional Area Retail/Service Floorspace (SF) | n/a | 217,000 | 218,000 | 142,000 | 109,000 | 215,000 |
| View Royal Share | 5% | 5% | 5% | 5% | 5% | 5% |
| Potential Growth in View Royal Retail/Service Floorspace (SF) | n/a | 11,000 | 10,900 | 7,100 | 5,450 | 10,750 |
| View Royal Supportable Retail/Service Floorspace (SF) | 98,950 | 109,800 | 120,700 | 127,800 | 133,250 | 144,000 |
| View Royal Retail/Service Growth From 2025 (SF) | n/a | 11,000 | 21,900 | 29,000 | 34,450 | 45,200 |
Table 5: Regional Oriented Retail/Service Demand Projections – Higher Scenario
| Estimated 2025 | Projected 2030 | Projected 2035 | Projected 2040 | Projected 2045 | Projected 2050 | |
|---|---|---|---|---|---|---|
| Subregional Area Population | 131,931 | 146,424 | 160,933 | 170,414 | 177,654 | 192,024 |
| Subregional Orientated Retail/Service Floorspace Per Person (SF) | 15 | 15 | 15 | 15 | 15 | 15 |
| Supportable Subregional Area Retail/Service Floorspace (SF) | 1,979,000 | 2,196,000 | 2,414,000 | 2,556,000 | 2,665,000 | 2,880,000 |
| Potential Growth in Subregional Area Retail/Service Floorspace (SF) | n/a | 217,000 | 218,000 | 142,000 | 109,000 | 215,000 |
| View Royal Share | 5% | 10% | 10% | 10% | 10% | 10% |
| Potential Growth in View Royal Retail/Service Floorspace (SF) | n/a | 22,000 | 21,800 | 14,200 | 10,900 | 21,500 |
| View Royal Supportable Retail/Service Floorspace (SF) | 98,950 | 120,950 | 142,750 | 156,950 | 167,850 | 189,350 |
| View Royal Retail/Service Growth From 2025 (SF) | n/a | 22,000 | 43,800 | 58,000 | 68,900 | 90,400 |
Results in Table 4 and Table 5 show that the incremental potential supportable regional oriented retail and service space in the Town of View Royal ranges from 45,200 to 90,400 square feet (SF) in the next 25 years, for an average addition of between 1,810 to 3,620 square feet of regionally oriented space per annum.
2.2.3 Key Implications
Table 6 and Table 7 summarize the new overall lower and higher demand projections for retail and service area in View Royal.
Table 6: Overall Retail/Service Demand Projections – Lower Scenario
| 2025-2030 | 2030-2035 | 2035-2040 | 2040-2045 | 2045-2050 | 2025-2050 | |
|---|---|---|---|---|---|---|
| View Royal Projected Supportable Local Orientated Retail Floor Space Growth (SF) | 13,500 | 17,500 | 17,000 | 15,000 | 17,500 | 80,500 |
| View Royal Projected Subregional Orientated Retail Floor Space Growth (SF) | 11,000 | 10,900 | 7,100 | 5,450 | 10,750 | 45,200 |
| View Royal Projected Total Retail/Service Floor Space Growth (SF) | 24,500 | 28,400 | 24,100 | 20,450 | 28,250 | 125,700 |
| Average Projected Yearly Retail/Service Growth Per Time Period (SF) | 4,900 | 5,680 | 4,820 | 4,090 | 5,650 | 5,028 |
| 2025 | 2030 | 2035 | 2040 | 2045 | 2050 | |
| View Royal Supportable Retail/Service Floorspace (SF) | 528,950 | 553,300 | 581,700 | 605,800 | 626,250 | 654,500 |
Table 7: Overall Retail/Service Demand Projections – Higher Scenario
| 2025-2030 | 2030-2035 | 2035-2040 | 2040-2045 | 2045-2050 | 2025-2050 | |
|---|---|---|---|---|---|---|
| View Royal Projected Supportable Local Orientated Retail Floor Space Growth (SF) | 20,250 | 26,250 | 25,500 | 22,500 | 26,250 | 120,750 |
| View Royal Projected Subregional Orientated Retail Floor Space Growth (SF) | 22,000 | 21,800 | 14,200 | 10,900 | 21,500 | 90,400 |
| View Royal Projected Total Retail/Service Floor Space Growth (SF) | 42,250 | 48,050 | 39,700 | 33,400 | 47,750 | 211,150 |
| Average Projected Yearly Retail/Service Growth Per Time Period (SF) | 8,450 | 9,610 | 7,940 | 6,680 | 9,550 | 8,446 |
| 2025 | 2030 | 2035 | 2040 | 2045 | 2050 | |
| View Royal Supportable Retail/Service Floorspace (SF) | 528,950 | 571,200 | 619,250 | 658,950 | 692,350 | 740,100 |
The projection shows that the supportable total retail and service floorspace in View Royal could increase by between about 125,700 square feet and 211,150 square feet between 2025 and 2050. This is equivalent to average annual retail and service growth of about 5,030 square feet to 8,450 square feet per year on average.
The updated projection shows a slower pace of growth in achievable floorspace compared to the previous estimates, which projected retail and service floorspace growth ranging from 11,000 square feet to 18,000 square feet per year. This lower projected growth is primarily driven by the updated population projections from BC Stats, which show a faster population pace – peaking at 2035, before slowing due to adjusted immigration projections.
2.3 OFFICE SPACE PROJECTIONS
The June 2021 Land Economics Report prepared by Coriolis assessed the potential for office growth in View Royal assuming a constant share of office demand across Greater Victoria. Under Scenario 1, the lower share of growth, Coriolis forecasted modest amount of growth for office development in View Royal (relative to the average annual growth in space from 2001-2019). However, due to tempered demand for office following the COVID-19 Pandemic, the Coriolis Scenario 1 forecast shows an annual average growth for the 2019-2025 period to be significantly higher than what the market has delivered to date.
Using data on office space development in Greater Victoria available from CoStar⁴, the Victoria Suburban Office market (i.e., the market in the CRD beyond the City of Victoria) shows only 2 new office buildings constructed since 2018 (though the City of Victoria has seen modest office development). According to Colliers, there is no suburban office space currently under development in the Greater Victoria Suburban market as of Q3 2024, indicating that even the modest forecast for office development in View Royal as projected by Coriolis will be significantly tempered for the first forecast period to 2025.
As a result of significant pullback in overall office demand as a concentration of new office development within existing clusters, and an overall market sentiment that is gravitating towards ‘high amenity’ locations, the office space forecast for View Royal prepared by Coriolis requires a revision. The Scenario 2 High Forecast is infeasible in the near term, likely at least until 2030. Based on the last 10 years of office development in View Royal, the Scenario 1 Lower Growth outlook may even be considered aggressive.
Based on the above and recent trends in office development, the Town should re-evaluate office space growth to 2031 to a much lower share of growth, and more modest thereafter to 2050. Based on recent development, the suburban share of Greater Victoria's office space is down from 35% in 2019 based on the Coriolis analysis, to 33% (as it was in 2006). We propose tempering the suburban office growth share under Scenario 1 to 33%, and View Royal's to 7.7% (as it was in 2001), kept consistent during the forecast period from 2025-2050. For Scenario 2, we assume the same 7.7% of suburban growth for the 2025-2030 period and increasing by 1% for each subsequent 5-years to 2050. The overall growth in floor space will remain the same for both scenarios, as the Greater Victoria market saw approximately 150,000 square feet of new office space under development in 2024, according to Colliers, confirmed by the net annual growth in office space between 2019 and 2023 according to the Co-Star data.
Table 8: Office Space Projections, Lower Growth Scenario
| Average Annual Office Development (SF) | 2019 to 2025 | 2025 to 2030 | 2030 to 2035 | 2035 to 2040 | 2040 - 2045 | 2045-2050 |
|---|---|---|---|---|---|---|
| Greater Victoria | 135,000 | 135,000 | 135,000 | 135,000 | 135,000 | |
| Suburban Office Market Share | 33.0% | 33.0% | 33.0% | 33.0% | 33.0% | |
| Suburban Office Market | 44,000 | 44,000 | 44,000 | 44,000 | 44,000 | |
| View Royal Share | 0.0% | 7.7% | 7.7% | 7.7% | 7.7% | |
| View Royal | - | 3,400 | 3,400 | 3,400 | 3,400 | |
| Projected Total Office Floorspace | 2019 | 2025 | 2030 | 2035 | 2040 | 2045 |
| Greater Victoria¹ | 12,898,405 | 13,708,405 | 14,383,405 | 15,058,405 | 15,733,405 | 16,408,405 |
| Suburban Office Market Share | 35.3% | 35.1% | 35.0% | 34.9% | 34.8% | 34.7% |
| Suburban Office Market² | 4,551,601 | 4,815,601 | 5,035,601 | 5,255,601 | 5,475,601 | 5,695,601 |
| View Royal Share | 3.2% | 3.1% | 3.3% | 3.4% | 3.6% | 3.8% |
| View Royal | 146,910 | 146,910 | 163,910 | 180,910 | 197,910 | 214,910 |
| View Royal Growth from 2025 (sf) | n/a | - | 17,000 | 34,000 | 51,000 | 68,000 |
¹ BC Assessment ² The suburban office market is the Greater Victoria office market excluding the City of Victoria
⁴ We have interpreted CoStar’s data very cautiously, as a number of errors and inconsistencies have been identified; namely, the construction of 40,000 square feet of office in Esquimalt in 2022 and 80,000 square feet in Langford in 2023 were listed in the CoStar database as being within the City of Victoria. However, we utilize other sources of data to validate the trends as well (such as office market reports from Colliers and other commercial brokerage firms).
Table 9: Office Space Projections, Higher Growth Scenario
| Average Annual Office Development (SF) | 2019 to 2025 | 2025 to 2030 | 2030 to 2035 | 2035 to 2040 | 2040 to 2045 | 2045 to 2050 |
|---|---|---|---|---|---|---|
| Greater Victoria | 150,000 | 150,000 | 150,000 | 150,000 | 150,000 | 150,000 |
| Suburban Office Market Share | 33.0% | 33.0% | 34.0% | 35.0% | 36.0% | 37.0% |
| Suburban Office Market | 49,000 | 49,000 | 51,000 | 52,000 | 54,000 | 55,000 |
| View Royal Share | 0.0% | 7.7% | 8.7% | 9.7% | 10.7% | 11.7% |
| View Royal | - | 3,800 | 4,400 | 5,000 | 5,800 | 6,400 |
| Projected Total Office Floorspace | 2019 | 2025 | 2030 | 2035 | 2040 | 2045 |
| Greater Victoria¹ | 12,898,405 | 13,798,405 | 14,548,405 | 15,298,405 | 16,048,405 | 16,798,405 |
| Suburban Office Market Share | 35.3% | 35.1% | 35.0% | 34.9% | 34.9% | 35.0% |
| Suburban Office Market² | 4,551,601 | 4,845,601 | 5,090,601 | 5,345,601 | 5,605,601 | 5,875,601 |
| View Royal Share | 3.2% | 3.0% | 3.3% | 3.5% | 3.8% | 4.1% |
| View Royal | 146,910 | 146,910 | 165,910 | 187,910 | 212,910 | 241,910 |
| View Royal Growth from 2025 (sf) | n/a | - | 19,000 | 41,000 | 66,000 | 95,000 |
¹ BC Assessment ² The suburban office market is the Greater Victoria office market excluding the City of Victoria
2.3.1 Key Implications
Overall, we anticipate that office floorspace growth in View Royal is projected to be between 85,000 square feet to 127,000 square feet between 2025 to 2050. This is significantly lower than the figures indicated in the previous report due to the COVID-19 pandemic impacts and office market trends. Overall, due to View Royal’s proximity to the Victoria General Hospital, it is anticipated there will be demand for medical related office space (e.g., professional and personal services).
2.4 POTENTIAL HOTEL ROOM DEMAND IN VIEW ROYAL
The 2021 Coriolis Report provided hotel room demand projections based on the following assumptions:
- 15% of the total hotel rooms in the Greater Victoria Area are located in View Royal’s subregional trade area
- The subregional trade area will capture 15-20% of the hotel growth in the Greater Victoria Area
- View Royal will capture 25% of the subregional growth
- Overall total hotel room demand to grow by 2% a year
To update these projections, we corresponded with Destination Greater Victoria. Their data shows approximately 800 new hotel rooms are anticipated over the next 10 years in the Greater Victoria Area from 2025 to 2035. As of current, Destination Greater Victoria reports 6,200 rooms in the Victoria Greater Area.
Altogether this represents annual hotel room growth of 1.3%, which is lower than 2% annual growth assumption made in the Coriolis report in 2021. If we project a 1.2% growth trend forward, as shown in the table below, this results in 8,300 rooms by 2050.
Based on the assumption of market share capture used in 2021 Coriolis report, it is estimated 15% of the regional hotel room inventory is located in View Royal’s subregional trade area in 2025, which grows to 20% in 2050. Of this, it is estimated that View Royal could capture approximately 25% of the hotel demand in the subregional trade area. As such, it is projected that View Royal could capture 63 rooms between 2025 to 2050. However, if growth continues on a similar pace as previously projected (2% annually), then View Royal could capture up to 101 rooms.
According to hospitality consulting company HVS, the View Royal market has excellent potential for hotel development, owing to significant visitation potential generated by the Victoria General Hospital, the Canadian Forces Base in neighbouring Esquimalt, and Royal Roads University in neighbouring Colwood, plus strong demand for leisure travel across the Greater Victoria region. Hotels in the West Shore subregion, such as the 10-year old Holiday Inn in Colwood, are performing well; the latter has consistently high occupancy rates and an average daily rate (ADR) of $200. In addition, the subregion lacks decent quality rooms and very little of the existing inventory is branded other than the 4 Points Hotel in Langford and Westin in Bear Mountain.
Table 10 - Hotel Room Demand Projection
| Existing 2019 | Projected 2025 | Projected 2030 | Projected 2040 | Projected 2050 | |
|---|---|---|---|---|---|
| Number of Rooms in Greater Victoria | 4,141 | 6,200 | 6,600 | 7,000 | 7,500 |
| Greater Victoria Annual Growth | n/a | 7.0% | 1.3% | 1.3% | 1.3% |
| Increase in Greater Victoria Rooms | n/a | 2,059 | 400 | 400 | 500 |
| Study Area Share | n/a | 15.0% | 17.5% | 20.0% | 20.0% |
| Increase in Study Area Rooms | n/a | 309 | 70 | 80 | 100 |
| View Royal Share | n/a | 0% | 25% | 25% | 25% |
| Increase in View Royal Rooms | n/a | - | 18 | 20 | 25 |
| Total | 2019 | 2025 | 2030 | 2040 | 2040 |
| Number of Rooms in the Study Area | 595 | 930 | 1,000 | 1,080 | 1,180 |
| Number of Rooms in View Royal | - | - | 18 | 38 | 63 |
| View Royal Room Growth From 2025 | n/a | n/a | 18 | 38 | 63 |
3.0 ECONOMICS OF MIXED-USE DEVELOPMENT
As mentioned in Section 2.0, the updated population projections reveal modest need for new development in View Royal over the coming 10-20 years. View Royal can capture demand generated by a growing population and changing housing needs if new projects are financially feasible for developers, and if planning policies are supportive of new development.
Many of the areas in the Town designated for multifamily residential or mixed-use development already have existing structures. Consequently, new development will largely involve redeveloping and intensifying under-utilized properties. Our analysis includes a thorough evaluation of the economics of redevelopment and the implications for the uses, heights, and densities required to make these projects financially viable. Notably, our analysis is reflective of the motion Council passed on January 25th, 2025, to require all new buildings with four or more storeys to dedicate the entire first floor to commercial or public-use space. This section provides a summary of our financial analysis and the corresponding viability of multi-use development.
3.1 APPROACH TO ANALYSIS
Our analysis aims to determine whether redevelopment is financially feasible for private developers based on prevailing and near-term anticipated development economics. To determine whether redevelopment is viable on any given parcel, or parcel assembly, a standard land residual approach is used.
Land residual analysis is used by developers to price land (i.e., what they can afford to pay for a given parcel), and by planners and land economists to model land price variations, development viability and development financial capacity to support various policy goals (e.g., amenity contributions, affordable housing contributions etc.). At its core, the land residual approach posits that in the absence of development constraints (physical or otherwise), land will be developed to a use that yields the highest land price. This is the land residual, after subtracting all development costs and a profit margin from the market price / value of a new development as though constructed. Whether a site is or is not attractive or ‘ripe’ for development is based on the spread between the land residual and the value of the land ‘as-is’ (i.e., in its current state).
Using the example of a condominium apartment development, if the price of finished units, minus construction and financing costs and expected profit margin, roughly equals or exceeds the value of the parcel ‘as-is’, then redevelopment is sufficiently profitable to justify development activity. This calculation – land residual minus as-is value – is the ‘land lift.’ Where that lift is around or above zero, a project is able to pay at or above market value for the land and generate a reasonable rate of return. A slightly negative spread (i.e., negative lift) may still be viable at the margins, if a developer is willing or able to accept a slightly lower than typical rate of return. Further, if a landowner’s imputed land value is lower than the market ‘as-is’ value (i.e., if they have held the land for a long period of time), then the calculation of lift (and thus viability) may be different.
Revenue (or value at completion) - Costs to Develop - Profit Margin = Residual Land Value (RLV)
- RLV >= 'as-is' land value = Viable Project
- RLV < 'as-is' land value = Unviable Project
For the purposes of this analysis, ‘as-is’ land values for case study parcels were assumed to be equal to the most recent values of each parcel (or parcel assembly) as established by BC Assessment.⁵ To those values, a 10% premium was added for single site development and a 20% premium was applied to land assemblies of 2 or more lots. The higher premium or site assemblies is applied under the assumption that a developer will need to pay a greater premium over existing value to create an incentive for multiple property owners to sell to a developer simultaneously.
It is important to highlight that financial viability alone does not guarantee development. Examples of contingent factors include:
- There must be market demand for the proposed project, such that anticipated revenues can be realized in a reasonable timeframe;
- View Royal must approve the project; approval risk is factored into financial feasibility analysis in the form of added costs, including carrying costs of land, soft costs related to securing entitlements, and profit margin requirements;
- The current landowner must be willing to sell the property to a developer at a price supported by the permitted development.
⁵ There are other potential values besides recent assessed value for parcels improved with an existing use. For instance, a parcel with a commercial use may be valued based on its income producing potential. Alternate base values may be considered in a future update.
3.2 CASE STUDY SITES ANALYZED
Following staff guidance, six case study sites (or site assemblies) were identified, to test mixed-use development viability in View Royal at various density thresholds. The selected sites are all located on or within proximity to the Island Highway Corridor. The table below summarizes key information about the test sites. Notably, Sites 1, 4, and 5 are land assemblies.
Table 11 - Case Study Site Summary
| Site | Site Size (SF) | Current Structure | Current Zoning |
|---|---|---|---|
| 1 | 28,314 | Standard House | A1 |
| 1 | 117,612 | Standard House | A1 |
| 1 | 89,298 | Standard House | A1 |
| Site 1 Total: | 235,225 | ||
| 2 | 31,363 | Service Repair Garage | C-3 |
| 3 | 188,658 | Automobile Showroom | C-7A |
| 4 | 52,555 | Fast Food Restaurant | C-7 |
| 4 | 13,286 | Automotive Centre | C-7 |
| Site 4 Total: | 65,841 | ||
| 5 | 7,182 | Retail Store | C-1 |
| 5 | 5,184 | Warehouse, Storage | C-1 |
| 5 | 6,246 | Warehouse, Distribution | CD-17 |
| 5 | 6,578 | Standard House | R-1B |
| Site 5 Total: | 25,190 | ||
| 6 | 375,727 | RV Park | C-6 |
3.3 KEY ASSUMPTIONS
To analyze the test sites, our financial model reflects the cost and revenue assumptions outlined in the table below. Unless otherwise noted, these assumptions were informed by desktop market research along with interviews of local developers, brokers and financing underwriters.
Table 12 - Key Revenue and Cost Assumptions for Financial Analysis
| Strata Apartment | Retail | Office | Light Industrial / Light Industrial-Office | |
|---|---|---|---|---|
| Unit Size | Avg. Unit Size: 750 sq.ft. | First floor retail space for all mixed use projects | First floor retail space for all mixed use projects | Assumed to be variable – n/a |
| Parking Requirements | 1.4 stall/unit | 1 stall/ 323 sq. ft⁶ | 1 stall/ 323 sq. ft⁶ | 1 stall/ 538 sq. ft |
| Revenue / Value At Completion | $750/sq.ft. Or $562,000 / unit | $35/sq.ft./annum Cap Rate: 5.75% | $30/sq.ft./annum Cap Rate: 5.75% | $25/sq.ft. /annum (light industrial and office) Cap Rate: 5.5% |
| Hard Costs (Including Parking) | $394 / square foot | $200 / square foot | ||
| Development Approvals Timeline | 36 months from land purchase to project completion | |||
| Financing Interest Rate | Land and construction financing at 7.0% and 75% LTV. | |||
| Growth Charges | Municipal DCC rates,⁷ CRD water DCC rates,⁸ CAC per residential unit ($4,000)⁹ |
⁶ View Royal Zoning Bylaw No.900, 2014 ⁷ View Royal Development Cost Charge Bylaw No.1011, 2019 ⁸ Capital Regional District Bylaw No. 2758 ⁹ View Royal Community Amenity Contributions Policy #6400-041 ¹⁰ Colliers Q4 2024 Victoria Market Report
Additional considerations for the key assumptions include:
- In terms of building height, we assume that a 1.6 FSR is roughly equivalent to a 4-storey building, a 2.0 FSR is roughly equivalent to a 5-storey building, and a 2.5 FSR is roughly equivalent to a 6-storey building.
- To provide consistency with the 2021 Coriolis Land Economics Study our financial model uses a 1.4 residential parking ratio. For retail and office parking, we have chosen 1 stall per 30m² as the requirement, however, the actual number of parking spaces will differ depending on the targeted use. Similarly, for light industrial uses, we have chose 1 stall per 52 m² but the actual number of parking spaces will differ depending on the targeted light industrial-office uses.
- Current market data shows an average of $20 per square foot lease rate for Class B and C office buildings in the Greater Victoria Area.¹⁰ We have assumed $30 per square foot in our financial model, with a vacancy allowance of 9%, to reflect the type of office space that the market is likely to support (e.g., professional and personal services), which is similar to retail spaces and require street-level space.
- For retail spaces, we have assumed a lease rate of $35 per square foot lease rate with a vacancy allowance of 5%. This is on the high end of what the market can support, but is the minimum for what a developer may need to achieve in order to make a mixed-use development project viable. Further details are provided in the case study site results.
- For light industrial spaces, we have assumed a $25 per square foot lease rate with a vacancy allowance of 3%. For stacked light industrial-office spaces, the office component is assumed as a $25 per square foot lease rate due to the location of offices being situated on the second floor.
3.4 SUMMARY RESULTS OF FINANCIAL ANALYSIS
This section summarizes the results of our financial analysis for each case study site and corresponding redevelopment scenario. Further analysis is required to understand what building heights can be supported on each site based on these floor space ratios (FSRs) after accounting for site size and urban design requirements.
Each case study site was analyzed for the following mixed-use scenarios, with the exception of Site 6:
- Strata apartment development with first floor retail space at 1.6 FSR
- Strata apartment development with first floor retail space at 2.5 FSR
- Strata apartment development with first floor office space at 1.6 FSR
- Strata apartment development with first floor office space at 2.5 FSR
- Light industrial space at 0.45 FSR
- Stacked light industrial and office space at 0.9 FSR
We also ran the mixed-use strata apartments with retail or office spaces at 3.0 FSR to understand how development viability might change. On larger sites, a 3.0 FSR would likely push the building to beyond 6-storeys, and the increase in construction associated with the transition to a concrete building form has not been accounted for within this project scope. However, for sites that can accommodate 6-storeys at or under 3.0 FSR, we assume they would continue to be at wood-frame construction costs.
In order to remain consistent with the 2021 Coriolis Land Economics Study, Site 6 was tested at 2.5 and 2.0 FSR, as it is envisioned to be a Town Centre site. In addition, as Site 6 is a RV Park currently, we accounted for tenant assistance requirements per the Town’s policy for the estimated 200 sites on the parcel assuming the site would require rezoning. This site was also tested under a 3.0 FSR.
3.5 DEFINING FINANCIAL VIABILITY
To understand the results, the minimum required redevelopment land value and residual land value supported by scenario have been color coded as per the following criteria:
Table 13 - Financial Viability Results
| Result | Definition | Color |
|---|---|---|
| Viable | Residual land value supported by development is equal or greater than ‘as-is’ land value | Green |
| Not Viable | Residual land value is well below base land value | Orange |
| Marginal | Means the residual land value is within ~5% of the base land value | Purple |
3.5.1 Mixed-Use Redevelopment Scenario – Retail
Table 14 - Summary of Mixed-Use Redevelopment – Retail
| Site | Size (SF) | FSR | # of Units | # of Parking Stalls | Minimum Required Redevelopment Land Value | Residual Land Value Supported by Scenario | Viable |
|---|---|---|---|---|---|---|---|
| 1a | 235,225 | 2.50 | 588 | 1,108 | $4,080,767 | $22,172,934 | Yes |
| 1b | 235,225 | 1.60 | 376 | 797 | $4,080,767 | -$2,910,432 | No |
| 2a | 31,363 | 2.50 | 85 | 144 | $3,166,621 | $2,302,675 | No |
| 2b | 31,363 | 1.60 | 54 | 92 | $3,166,621 | $141,808 | No |
| 3a | 174,241 | 2.50 | 470 | 795 | $13,904,946 | $11,227,175 | No |
| 3b | 174,241 | 1.60 | 301 | 510 | $13,904,946 | -$1,555,179 | No |
| 4a | 65,841 | 2.50 | 178 | 300 | $6,827,227 | $5,471,510 | No |
| 4b | 65,841 | 1.60 | 114 | 192 | $6,827,227 | $907,995 | No |
| 5a | 25,190 | 2.50 | 68 | 115 | $5,099,674 | $745,482 | No |
| 5b | 25,190 | 1.60 | 44 | 74 | $5,099,674 | -$1,086,588 | No |
| 6a | 566,282 | 2.50 | 1,537 | 2,593 | $30,601,877 | $10,073,083 | No |
| 6b | 566,282 | 2.00 | 1,229 | 2,072 | $30,601,877 | -$1,578,982 | No |
Key Implications of the Analysis:
- 4 to 6 storey mixed-use development with retail space is only financially attractive for one of the scenarios tested
- For mixed-use retail development to be financially attractive, we would expect developers to favour 6 storey projects with higher densities
- Site 1a is the only viable site, however, this viability is driven by significantly suppressed land values due to agricultural zoning ($570,000 per acre compared to $2.3M-$8.5M per acre for commercial or residential zoned parcels). It is likely that project would have to occur in multiple phases to accommodate market absorption rates.
- None of the scenarios that are classified as “not viable” are within 5% of the minimum required redevelopment land value.
- If the density were to be increased to 3.0 FSR, then four sites would be deemed “viable”. These sites are: Site 2a, 3a, and 4a.
3.5.2 Mixed-Use Redevelopment Scenario – Office
Table 15 - Summary of Mixed-Use Redevelopment - Office
| Site | Size (SF) | FSR | # of Units | # of Parking Stalls | Minimum Required Redevelopment Land Value | Residual Land Value Supported by Scenario | Viable |
|---|---|---|---|---|---|---|---|
| 1a | 235,225 | 2.50 | 588 | 1,108 | $3,778,488 | $13,105,620 | Yes |
| 1b | 235,225 | 1.60 | 376 | 797 | $3,778,488 | -$11,970,274 | No |
| 2a | 31,363 | 2.50 | 85 | 144 | $3,166,621 | $1,093,735 | No |
| 2b | 31,363 | 1.60 | 54 | 92 | $3,166,621 | -$1,057,254 | No |
| 3a | 174,241 | 2.50 | 470 | 795 | $13,904,946 | $3,955,033 | No |
| 3b | 174,241 | 1.60 | 301 | 510 | $13,904,946 | -$8,821,465 | No |
| 4a | 65,841 | 2.50 | 178 | 300 | $6,827,227 | $2,933,509 | No |
| 4b | 65,841 | 1.60 | 114 | 192 | $6,827,227 | -$1,580,261 | No |
| 5a | 25,190 | 2.50 | 68 | 115 | $5,099,674 | -$227,637 | No |
| 5b | 25,190 | 1.60 | 44 | 74 | $5,099,674 | -$2,056,781 | No |
| 6a | 566,282 | 2.50 | 1,537 | 2,593 | $30,601,877 | -$6,005,974 | No |
| 6b | 566,282 | 2.00 | 978 | 1,656 | $30,601,877 | -$31,563,551 | No |
Key Implications of the Analysis:
- 4 to 6 storey mixed-use development with office space is only financially attractive for one of the scenarios tested. Note that for these mixed-use development typologies modelled, the office space would likely be suitable for professional and personal service uses (e.g., medical and personal services office, dental clinic, etc.)
- The only viable site is Site 1a – a large land assembly comprised of multiple residential lots. It is assumed this site was favourable for redevelopment due to a low minimum required redevelopment land value and large site size to support ample new units. It is likely that project would have to occur in multiple phases to accommodate market absorption rates.
- These results are driven by high costs, and the low revenues generated ($30 per square foot) by the office space in comparison to other uses. If the office space in the mixed use building (i.e., ground floor office space) were mixed with retail spaces, it could improve the project performance as retail spaces can achieve slightly higher lease rates. However, the project’s viability is primarily driven by the strata apartments, so swapping office space for retail space at the ground floor level will not have a significant impact to make an unviable project become viable.
- Out of the three mixed-use redevelopment options (office, retail, and light industrial), this option has the least viable results.
- None of the scenarios that are classified as “not viable” are within 5% of the minimum required redevelopment land value.
3.5.3 Mixed- Use Redevelopment Scenario – Light Industrial-Office
We analyzed the financial viability of light industrial development at 0.45 FSR (45% site coverage) on a single storey of development compared to a stacked industrial development (office over industrial) at 0.9 FSR (45% site coverage) on four different sites in View Royal. As these sites are relatively large in size, we assumed that there would a road dedication equivalent to 30% of the site sizes and that the industrial development would be leasehold (rather than strata).
Table 16 - Summary of Mixed-Use Redevelopment – Light Industrial-Office
| Site | Size (SF) | Site Size Less Road Dedications (SF) | FSR | # of Parking Stalls | Minimum Required Redevelopment Land Value | Residual Land Value Supported by Scenario | Viable |
|---|---|---|---|---|---|---|---|
| 1a | 235,225 | 164,657 | 0.90 | 459 | $3,778,488 | $6,111,863 | Viable |
| 1b | 31,363 | 164,657 | 0.45 | 138 | $3,778,488 | $287,673 | No |
| 2a | 31,363 | 21,954 | 0.90 | 62 | $3,166,621 | -$525,510 | No |
| 2b | 174,241 | 21,954 | 0.45 | 19 | $3,166,621 | -$1,339,576 | No |
| 3a | 174,241 | 188,658 | 0.90 | 526 | $13,904,946 | $5,483,280 | No |
| 3b | 65,841 | 132,061 | 0.45 | 111 | $13,904,946 | -$2,650,917 | No |
| 4a | 65,841 | 46,089 | 0.90 | 129 | $6,827,227 | -$424,154 | No |
| 4b | 235,225 | 46,089 | 0.45 | 39 | $6,827,227 | -$2,114,074 | No |
Key Implications of the Analysis:
- Under current market conditions, most of the scenarios are considered not viable due to a slow down in lease rate growth. As modelled, a lease rate of $25 per square foot at an assumed absorption period of 12 months is financially challenging. The only exception is Scenario 1a, in which the stacked industrial development could be considered viable, however, as it is a large site, developers may find it challenging to lease up the units within a 12 month period.
- While mixed office and light industrial development with surface parking is more likely to occur on sites with low improvement values, the market will need to achieve at least $25 per square foot in lease rates to be competitive for development.
- While the stacked industrial development scenarios perform better than the 0.45 FSR scenarios, it may ultimately take longer to secure tenants for second floor office space which would decrease the supportable land value.
- Project viability is impacted by the number of parking spaces required and the type of parking (surface parking is much less costly to build), and viability is improved by lower parking requirements.
3.5.4 Market Commentary
In speaking with developers and local brokers, it is recognized that the development market is softer than in previous years for the Greater Victoria region due to high (and rising) construction costs, a tepid market for new condo units, and still relatively high interest rates for construction financing. For the strata apartment market, the View Royal market is experiencing weaker pre-sales as there is less overall interest from buyers in purchasing units, which are perceived to experience slower sales price growth. On the other hand, higher interest rates mean that there are additional financing barriers for individuals to purchase condo units. Recent development trends across communities in BC have shifted over to market rental buildings due to preferred financing offered through CMHC’s housing programs, and this appears to be the case in View Royal as well.
In addition, interviews with local brokers have indicated retail and office spaces are slow to lease as inventory is high. From a regional perspective, office lease holders are moving away from holding office space in a down market. This is trend has been evident in office spaces owned by the provincial government as they are beginning to reduce their office space for hybrid-remote workers. This has a significant impact on the Greater Victoria office market as public service accounts for 40% of office space. For retail spaces, there is a competitive sublease market, resulting in cheaper subleases to retail subtenants than typically achieved in View Royal.
For the industrial market, the Colliers’ Q4 2024 Victoria report shows that vacancy is high in the Westshore communities, at 10.7% compared to 2.0% or less in Esquimalt and Victoria areas. In contrast, the Victoria region had the lowest industrial vacancy rate in 2022. Since then, the Westshore industrial vacant space has jumped from 1,450 square feet in 2022 to 235,900 square feet in 2024, as supply has flooded the market early in the year. In Q3 and Q4 of 2024, no new industrial space was added.
Historically, industrial vacancy rates have fluctuated and appeared in waves of demand, as shown in Figure 2 below. As such, View Royal can be prepared to absorb some of the subregional demand in the future when the market rebounds.
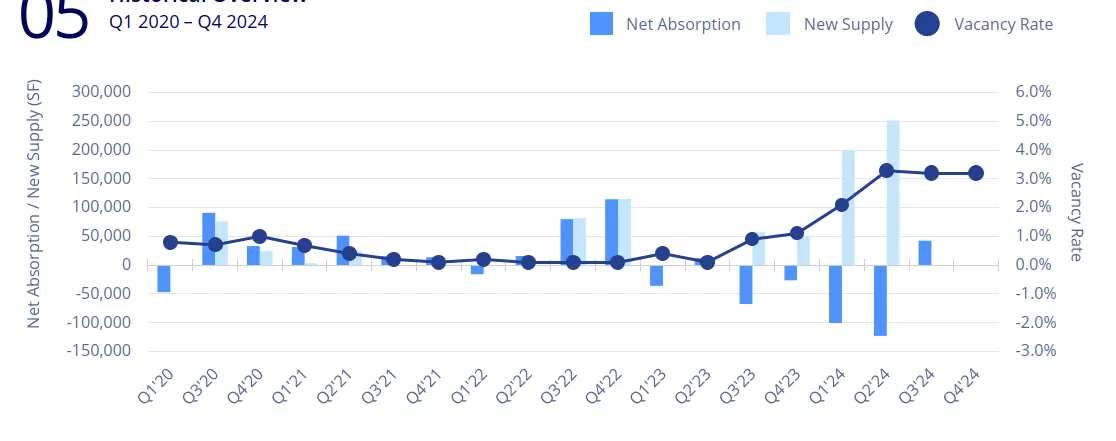
Source: Colliers
4.0 SYNOPSIS
While market conditions are currently challenging for development, the creation of land use policies and regulations should encourage development by enabling flexibility rather than being overly prescriptive. Land use policies for consideration from the 2021 Coriolis report still stand, and include:
- Certainty of land use policy and plans. Having clarity around the land use densities and tenures will allow a faster development approvals process and decreases perceived risk and carrying costs for developers operating in View Royal.
- Consider lowering parking requirements. Having lower parking requirements along with transportation demand management practices can alleviate the cost burden of providing additional parking stalls than the market requires on development projects.
Additional considerations based on the analysis completed for this study include:
- Consider increasing the density permitted in key areas to allow for smaller sites to become viable. Some development parcels may not achieve 6-storeys if a maximum of 2.5 FSR is permitted, which limits the development potential of the site. As shown in the analysis, higher FSRs are correlated with improved viability for the wood-frame mixed-use developments. A 3.0 FSR, for example, can be achieved on smaller sites while staying within the wood-frame building format (6 storeys).
- Consider the market when implementing policies that are more prescriptive. As market conditions are already challenging, a strong land use vision will provide more certainty to developers, especially when coupled with flexible land use regulations. As it is likely that unique challenges may occur during uncertain economic and political periods for the development community, consider implementing more prescriptive land use regulations when economic conditions are improved.
- Providing financial incentives to encourage specific types of uses. Some communities across Canada use tax exemptions over a fixed period of time to encourage specific development uses (e.g., employment uses).
- Consider undertaking a retail strategy to position View Royal’s employment lands for investment and growth within the region. Retail strategies allow local governments to have a strong baseline understanding of their retail inventory and ways to support the vibrancy of their retail sector, while identifying the optimization of retail uses by function and area across the community.
4.1 RETAIL DEMAND PROJECTIONS
- Based on the modelling and assumption inputs, the following retail demand projections are anticipated for View Royal from 2025 to 2050:
- Local oriented retail and service space projections range from 80,500 (lower capture scenario) to 120,750 (higher capture scenario) square feet in the next 25 years, or at an average annual addition of supportable floorspace between 3,220 to 4,830 square feet
- Regional oriented retail and service space projections range from 45,200 square feet (lower capture scenario) to 90,400 square feet (higher capture scenario), or at an average annual addition of supportable floorspace between 1,810 to 3,620 square feet.
- In considering requirements for ground-floor retail space in future redevelopment areas, View Royal should focus on ensuring that new retail space emerges in quantities and locations where it is most supportable. Blanket retail floor area requirements for mixed-use developments risk oversaturating the market with unleasable ground floor space, and limiting opportunities to create cohesive, vibrant and well-anchored retail nodes and corridors. Further, over-delivery of ground-floor retail in sub-optimal locations will create unfeasible project economics, and will slow the pace of project delivery.
4.2 OFFICE DEMAND PROJECTIONS
- Overall, we anticipate that office floorspace growth in View Royal is projected to be between 85,000 square feet (lower growth scenario) to 127,000 square feet (higher growth scenario) between 2025 to 2050.
- This is significantly lower than the figures indicated in the previous report due to the COVID-19 pandemic impacts and office market trends.
- Overall, due to View Royal’s proximity to the Victoria General Hospital, it is anticipated there will be demand for medical related office space (e.g., professional and personal services).
4.3 HOTEL DEMAND PROJECTIONS
- View Royal hotel demand is projected to grow at 1.3% per year based on regional projections, which is lower than the previous projected growth of 2.0% per year.
- If this growth is maintained at 1.3% annually, then View Royal could potentially capture 63 hotel rooms by 2050. If this growth increases to 2.0% annually, then View Royal could potentially capture 101 hotel rooms by 2050.
4.4 DEVELOPMENT FINANCIAL FEASIBILITY
As currently modelled, the financial analysis shows that:
- Mixed-use developments are challenging to build under prevailing market conditions. Mixed-use developments require at least $35 per square foot in the commercial lease rates in order to achieve financial viability, however, the retail and office markets may not support this rate yet, as lease up remains slow. Over-delivery of net new retail floor area would put further downward pressure on supportable retail lease rates, which will further hamper project economics.
- Larger sites (greater than 25,000 sq. ft.) are more likely to achieve development viability as they can reach greater economies of scale.
- Light industrial developments are challenging in this current market as inventory is high, and until lease rates can exceed $25 per square foot. Stacked light industrial-offices perform better than standalone light industrial developments, but may be impacted by longer absorption periods and less premium lease rates for second floor office space.
- Greater permitted densities are more likely to achieve development viability, however, with more units means more parking is required. More levels of underground parking are cost-prohibitive for developers, and parking incentives or flexibility should be considered where possible.