Letter from D. Wilson, Re: Concerns about the quality and accuracy of the May 2, 2025 Urban Systems Memorandum
Resident correspondence alleging methodological and mathematical errors in the consultant's housing capacity analysis.
View Royal Council
re: Concerns about the quality and accuracy of the May 2, 2025 Urban Systems Memorandum, Subject: OCP Review and Update – Housing Capacity Analysis and Land Use Scenarios.
Summary
The memorandum from Urban Systems (US Memo) noted above is on the May 13, 2025 Special Council Meeting agenda. The content of the US Memo should be given close attention by council because it does not provide a coherent or useful Housing Capacity Analysis. The issues include:
- There is no comprehensive analysis of housing capacity.
- Poor methodology is used to stretch the legislated 20-year housing capacity forecast 9 years to 2050 producing invalid results.
- In part of the memo, capacity is confused with likelihood of uptake. The determination of likelihood is not supported by the reference material that is quoted; the results are not valid.
- SSMUH legislation created the largest-ever increase in housing capacity in View Royal but the US Memo does not quantify that capacity.
- Test Scenarios for eight sites in View Royal produce an estimate of dwelling unit capacity that is so riddled with errors that the entire output is meaningless.
- The flawed SSMUH uptake calculations are added to the dubious Test Scenarios output and presented as the result of a capacity analysis. It is not.
This is not the first time I have come to council to question the quality of a report. I believe it is time for the View Royal Council to have a serious discussion about professional reliance and the quality of the work product presented to you. Professional reliance does not imply infallibility and is not a shield against questioning the content of work product – quite the opposite is true.
Planning Institute of BC members provide full, clear and accurate information on planning matters to decision-makers and the public. The work must be prepared with diligence and rendered with appropriate preparation. The May 2, 2025 Urban Systems Memorandum fails to meet those objectives.
View Royal council are not professional planners. Professional reliance is supposed to ensure high quality reports reach the council. When that reliance is unmet the credibility of council and reputation of View Royal are tarnished.
Further comments are attached below.
Doug Wilson
Additional Information
Provincial legislation requires municipalities to update their Housing Needs Reports (HNR) and Official Community Plan (OCP) on a repeating five-year cycle. The first round of the cycle concludes with the update of the OCP by December 31, 2025. The next cycle will conclude 4 years later, December 31, 2029 in order to align the cycle with the publication of Canada census data that is also on a five-year cycle.
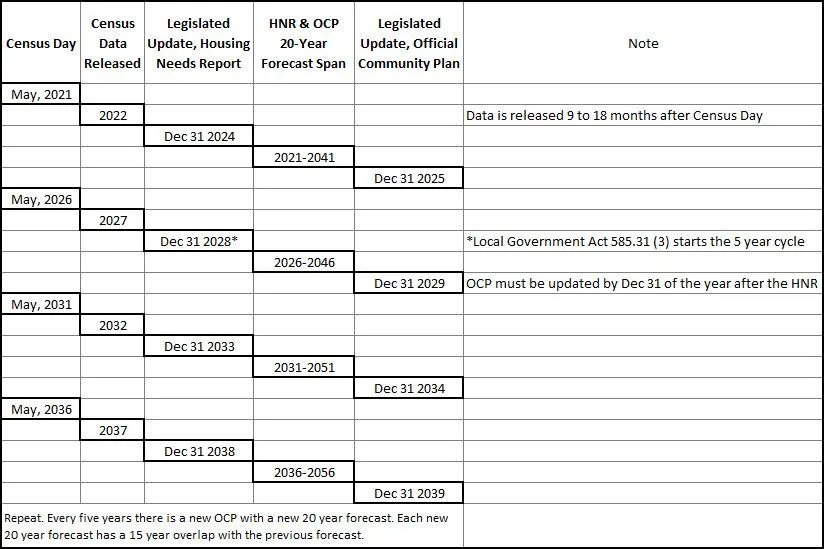
The Local Government Act stipulates that the HNR must include the total number of housing units required to meet anticipated housing needs for the next 20 years.
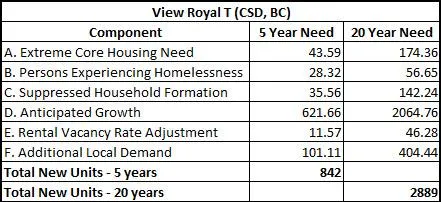
The conclusion reached in the 2024 HNR is that the total number of new dwelling units needed in the 20 years from 2021 to 2041 is 2889 dwellings; this is the time span and the dwelling estimate that is required by legislation. The US Memo provides much higher numbers for a longer time period.
The Local Government Act requires that the information from the most recent HNR (Table 2) must be considered when the OCP is updated. Further, there is a requirement to include statements and map designations demonstrating the OCP can meet the housing needs over a period of at least 20 years. The most accurate way to satisfy this requirement is to use the HNR 20-year housing need to update the OCP and to produce a clear OCP capacity assessment to support the OCP statements and maps.
At this point I would like to touch on forecasting substance and accuracy vs duration. The substance of a forecast is dependant on the quality of the information the forecast is built on. A forecast built on reliable, recent, data will be more reliable. Updating as new data is available is critical. Generally speaking, the accuracy of a forecast decreases as the forecast duration lengthens. Unnecessarily overdriving the duration will get rapidly diminishing results.
The province has legislated that housing need must be forecast for a 20-year period. That forecast will be renewed from entirely new high-quality data every five years. In effect, we will never reach the end of any one 20-year forecast because we will create an entirely new forecast every five years.
View Royal has determined that the 2025 OCP update should be based on 2021 data and extend until 2050. This is demonstrated in the US Memo. This extends the forecast period from 20 years to 29 years.
The reason for extending all of the work to 2050 is given in the third paragraph on page 1 of the US Memo: “To account for the lead time required to develop and refine the OCP, View Royal is planning for growth beyond the required 20-year horizon to 2050.” This vague statement offers no information that would lead me to believe this decision to stretch the forecast timeline has any benefit other than a belief it will make the work easier. In the US Memo the tortured attempts to mathematically support this extended forecast period clearly create a great deal of additional work and produce little of any substance.
To be clear, I am not saying that an OCP should not pursue some well thought out concepts at the edge of the 20-year forecast horizon. I am saying that rushing to lock in a multitude of untested or currently unnecessary decisions without the benefit of the new information that becomes available during each 5-year renewal cycle is imprudent.
In the case of the US Memo there are additional factors that need to be considered before deciding to accept the output of the (partial, very limited) capacity analysis.
Section 1.1.2 Housing Need:
The legislation requires that 20-year housing need to be recalculated in the HNR every five years. There is a reason for this. The intention is to build housing in a manner that, hopefully, will reduce some of the housing need and also increase the overall housing supply. This suggests considerable attention should be given to the near-term forecast of housing development.
The US Memo takes the output of the HNR and extends the rate of housing need and demand from 20 years to 29 years. This is not a valid forecast method. The HNR will go through two full renewal cycles before it produces a forecast for 2050; the data of today was not modeled in the HNR to stretch beyond 2041.
Another issue occurs when the math that is supposed to support this extended forecast is done incorrectly. The US Memo simply divides the HNR projection by 20 and then claims to calculate a number that fits in 2050. The HNR projection is not for 2889 units spread evenly over 20 years. The HNR projection is for 842 units in five years and 2047 units over 15 years, a different rate than the US Memo calculated. Claiming that the period from 2041 to 2050 is 10 years introduces error in the calculation. And finally, 1444.5 plus 2889 does not add up to 4189 as stated in the US Memo.
2.0 Housing Capacity Analysis
Claims to present an analysis of housing projections for View Royal but what follows is an attempt at determining SSMUH uptake rates and a very challenging look at 8 test sites. The final sentence in the section 2.0 paragraph tells us that “It is important to note that other sites not identified as part of this analysis may be viable to accommodate higher residential densities that would contribute to the Town’s housing needs”. Indeed, there are many properties in View Royal with OCP Land Use Designations or zoning that allows higher density than the current built use. But those sites are not assessed, not quantified, not included in the Capacity Analysis.
This presents a difficult situation. A housing capacity analysis that does not quantify the current existing overall capacity for growth or, if it is a partial analysis, attempt to state what portion (%) of the town was analysed does not offer much useful information. Without determining how much current capacity is left in the 2011 View Royal OCP it is very difficult to support any claim that additional areas for higher density are needed or desirable. It’s safe to say that the US Memo does not provide a comprehensive or definitive capacity analysis.
2.1.1 Maximum SSMUH Uptake.
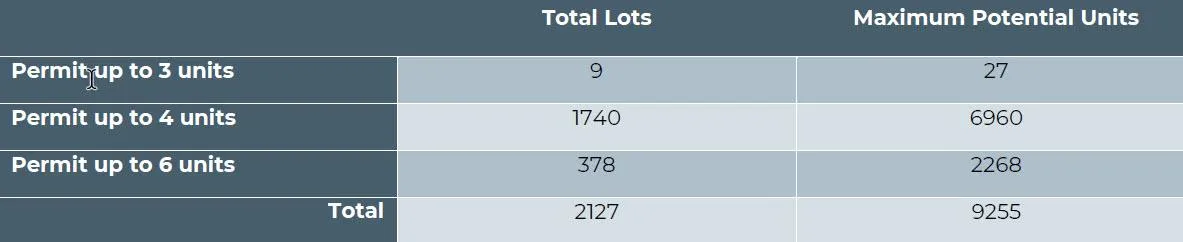
This section starts with a raw calculation of the maximum potential number of SSMUH that could be built in View Royal under the current SSMUH zoning (9255 units on 2127 lots).
The US Memo contains a table showing the Maximum Potential SSMUH Development in View Royal but it does not indicate the number of dwellings that could be added by that potential (the capacity).
The US Memo notes that 100% uptake is an unlikely event and one reason given is that “Existing single-detached homes would need to redevelop to accommodate 1-5 more units” is an incongruent statement. The SSMUH maximum potential number remains at 9255 units regardless of teardowns or uptake pace. However, subtracting the number of required teardowns from 9255 will tell you what the SSMUH development capacity is; that is the objective of a capacity assessment.
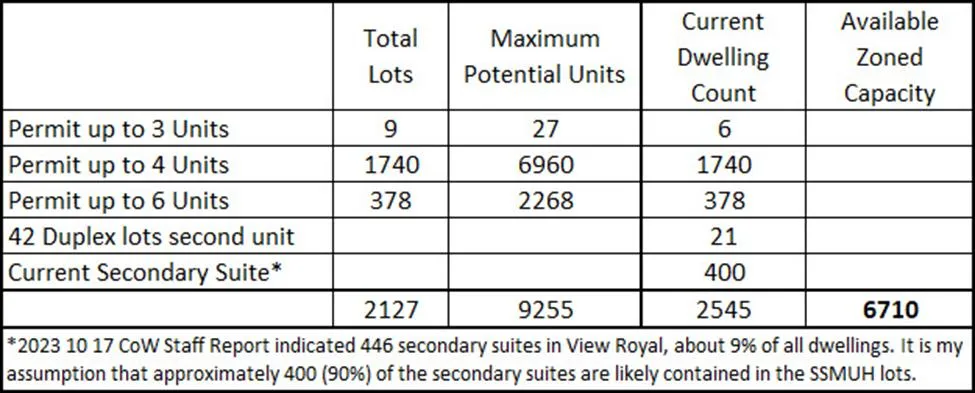
It is still important to note that the Available Zoned Capacity does not mean that there will be 100% uptake. The US Memo states that site conditions may constrain uptake: “These lots would need to have ideal site conditions for development. This would mean an absence of topography constraints such as rock outcrops and steep slopes, along with watercourses and trees” but it is also worth noting that almost every one of the 2127 lots has been successfully developed with one or more dwellings in the past. Price, market forces, and construction labour should be considered as likely constraints on SSMUH uptake.
2.1.2 Projected SSMUH Uptake.
This section of the US Memo relies on a BC Government Report titled SSMUH and TOA Scenarios in British Columbia (BC SSMUH Report) to create an entirely new forecast of SSMUH uptake.
The US Memo appears to chose one chart from the very complex BC SSMUH Report and use that chart as the basis for forecasting SSMUH uptake through 2050. The BC SSMUH does not include the chart data, just the chart. The chart is Figure 57, on page 112 of the BC SSMUH Report and it shows the “cumulative net increase in dwelling units under multiplex scenario over a ten-year time span”; the chart forecast period is ten years and events beyond that period cannot be implied from the chart. As one would expect, the 10-year uptake starts out slowly while industry, municipalities and buyers adjust to the new housing form and by the end of ten years the annual uptake is quite vigorous.
Below is the chart from BC SSMUH Report; the Victoria Census Metropolitan Area SSMUH uptake predictions are the second row from the top. In the two scenarios 10-year uptake is 21% and 22%.
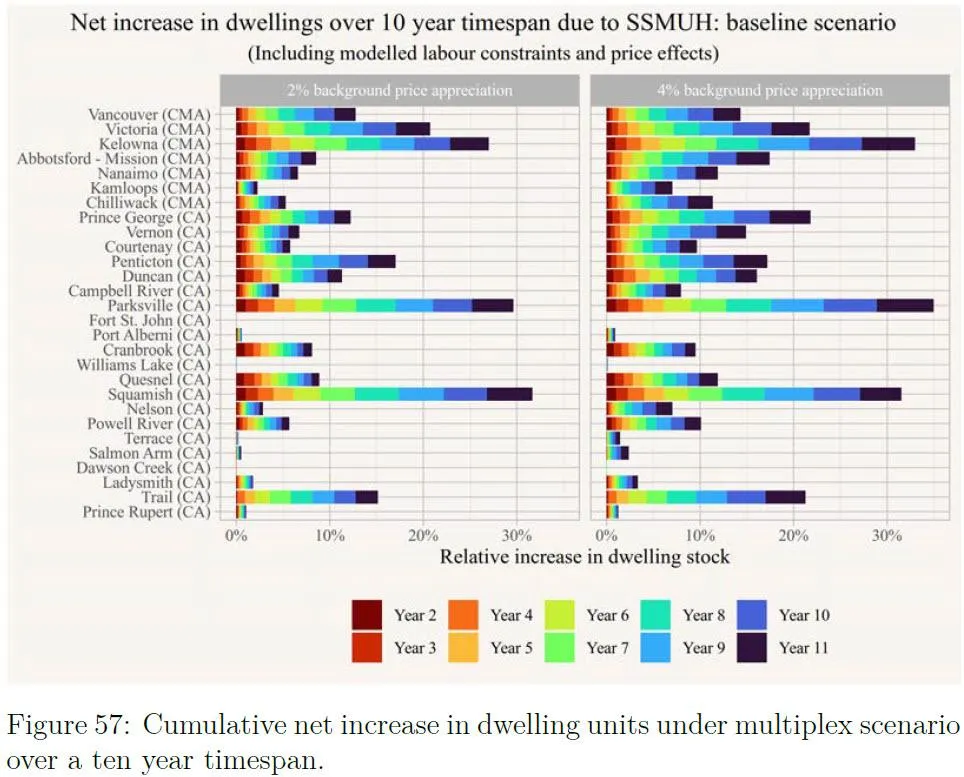
Figure 57 in the BC SSMUH Report indicates that the number of dwellings in View Royal will increase 21% or 22% during the years 2024 to 2034 due to SSMUH uptake. The starting number used in the US Memo is 4915 dwellings (2021 census data).
Here is what the US Memo professes to learn from the BC SSMUH Report:
“The BC SSMUH Report forecasts a 21% to 22% net increase in residential multiplex building stock within the Victoria Census Metropolitan Area (CMA)5 over a 10-year timespan, based on the assumption that housing is expected to appreciate at a rate of 2% and 4% per year, respectively. In the first scenario, assuming a 2% price appreciation, an extrapolation from the BC SSMUH Report predicts a 10.5% net increase in total dwelling units (516 units) from 2024-2029 in View Royal.6 In a second scenario assuming a 4% price appreciation, an extrapolation from the BC SSMUH Report predicts an 11.0% net increase in total dwelling units (541 units) from 2024-2029 in View Royal. Based on the two scenarios of 2% and 4% housing price appreciation, uptake is forecasted to result in 21% - 22% net growth in total dwelling units (1,032 – 1,081 units) from 2024-2034. If this rate remains steady from 2034 to 2050, it is estimated that View Royal could experience growth of approximately 2,580-2,703 net new SSMUH units in this timeframe. This estimate is approximately 28%-29% of the maximum SSMUH build out calculated in Section 2.1.1.”
In the US Memo the 10-year uptake is divided in half and then presented as the uptake amount for the first five years. The charts show nothing of the sort. Here is Figure 57 marked up to show the actual uptake after 5 years:
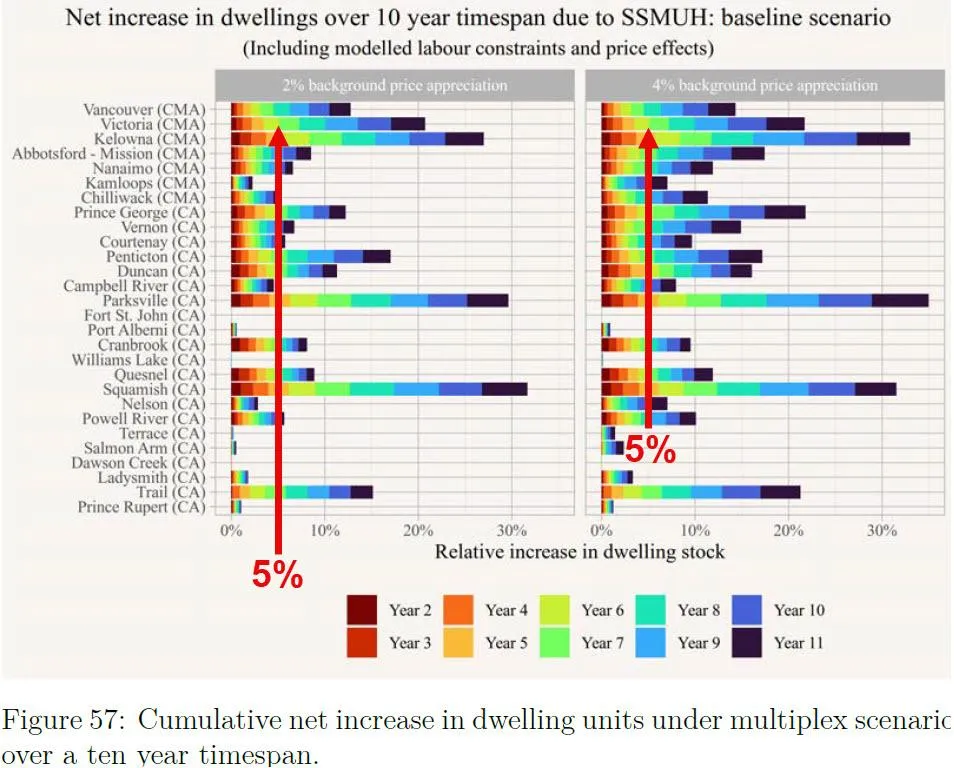
The charts clearly show that in the first five years (years 2 through 6) the total SSMUH uptake is only 5% and not the 10.5% and 11% rate claimed in the US Memo. As a result, the number of new SSMUH dwellings created between 2024-2029 is clearly not 516 units or 541 units. A 5% estimate is 246 new units in five years, 2024-2029.
Unfortunately, the US Memo also makes a constant rate forecast into the distant future of 2050. The forecast of 2580-2703 SSMUH units added between 2024 and 2050 is not supported by the BC SSMUH Report. The BC SSMUH Report clearly shows that this is not what happens in the first 10 years or in the years that follow. In fact, if uptake is brisk there is a possibility, according to BC SSMUH Report, that the price of SSMUH will drop and result in reduced construction rates.
The reader is left with a very problematic interpretation of the charts and the information in the BC SSMUH Report. The charts demonstrate that the 10-year uptake of SSMUH is not a constant rate but the US Memo has chosen to incorrectly claim a constant uptake rate for the first five years and then claim that a constant rate can be determined to forecast for an additional 16 years. The output from this is eventually used as a key quantity in the Results section of the US Memo.
This effort to forecast beyond the period of data validity is problematic. First, the chart data is not available for calculations, just the chart. The chart itself is a forecast. The US Memo sets out to create a forecast from a forecast but misinterprets the data. Then the forecast period is extended by an additional 150% without considering the data limitations identified in the reference document. Then the new forecast is incorporated into a larger forecast that includes another speculative forecast in the Results section of US Memo. None of this is reasonable or good practice.
Section 2.1.2 of the US Memo concludes this section with a short table:
| 2024-2050 | |
|---|---|
| Projected Number of Dwelling Units Required to Meet Housing Need as per IHNR | 4,189 |
| Projected Uptake of SSMUH Dwelling Units | 2,580-2,703 |
None of the information in this table is credible. The number 4189 does not appear in the Interim Housing Needs Report. It is a cardinal sin of data use to claim a source that is not true. The number 4189 is an erroneous construct of the US Memo; in the table above 4189 is shown as an estimate for 2024-2050 but it was originally identified as the housing need from 2021 to 2050. As noted above, the Projected Uptake of SSMUH Dwelling Units in this table is unsupported by the BC SSMUH Report that is supposed to substantiate it.
Section 2.1.4 Test Scenarios
Takes another wandering path toward a forecast. On page 8 of the US Memo Table 3, Number of Units Projected from Test Sites is presented. The text description of Table 3 on page 5 tells the reader “The total number of dwelling units projected is approximately 2,238”. Table 3 itself presents 8 rows of data; each row represents one test site in View Royal. Each row includes the land area (Site Size), the proposed Test Floor Space Ratio (FSR) and a calculation of the Gross Floor Area (GFA).
Therefore, each row calculates: Site Size X FSR = GFA
For brevity I will simply say this: an 8-row table that fails to correctly make the GFA calculation 7 out of 8 times should never have arrived on an agenda. This is not diligent work. That said, like the invalid projection of SSMUH dwelling uptake, this inaccurate prediction of 2,238 new dwellings contributes a key portion of the Results of the US Memo.
Section 2.3 Results
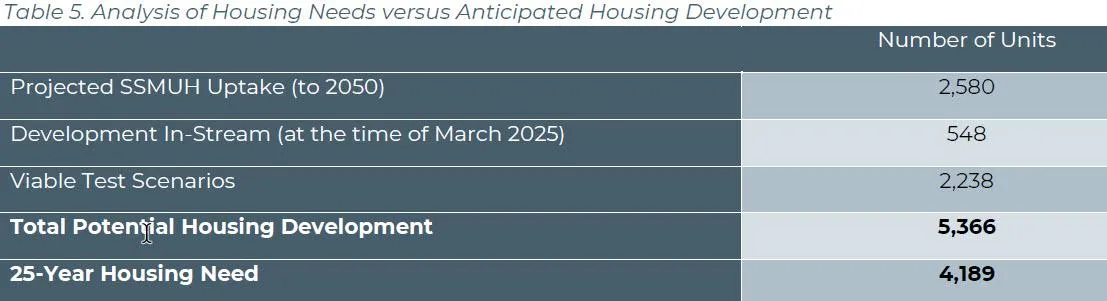
Has a short textual summary and a table that forecasts Total Potential Housing Development. The claim is that the projected SSMUH uptake and the Test Scenarios can be added together along with the current number of in-stream developments and arrive at the Total Potential Housing Development up to 2050.
I have already expressed my concerns about the SSMUH uptake and Test Scenarios. There is another issue to consider. The two types of housing that are forecast were subject to very different considerations prior to inclusion in the result.
- The total available zoned SSMUH capacity in View Royal is 6710 dwelling units. The US Memo subjected all of the SSMUH capacity to be adjusted by a likelihood of development by 2050 before counting any of the 6710-unit capacity toward the final Total Potential Housing Development result and only 2580 units, 38% of the total, were included.
- The Test Scenarios were not subject to any likelihood of development test. They are merely declared “viable” and no time frame is required in order to include 100% of the 2238 Test Scenarios in the results.
- Additionally, SSMUH, TOA and one test site are zoned the rest are Land Use Designations.
Below, from section 2.3 of US Memo, Table 5 from page 10 provides the reader with this summing of apples-and-oranges.
Concluding Remarks
An estimate of the capacity for additional development left in the current OCP Land Use Designations map and the Zoning bylaw is needed before prudent decisions on additional density requirements can be made. Calculating capacity does not need to be extremely complex to produce useful results.
The US Memo continues on beyond the sections reviewed above. Section 3.0 makes a number of claims about Community Engagement. Section 4.0 presents two Land Use Scenarios that push for major land use decisions that would certainly increase the opportunities for developers in View Royal but offers little concrete evidence of benefit for View Royal or the citizens who currently live here. I do see the unexamined density dreams of the failed 2021 OCP update echoing in section 4.0.
I don’t see any reason to examine Sections 3.0 and 4.0 given the lack of attention to detail, the questionable pursuit of extending forecasts, the math errors and inaccurate use of reference material; the first two sections extinguished all credibility.