Western Gateway OCP Housing and Population Projections received June 16, 2025 from D. Wilson
Information report analyzing housing capacity and growth projections for the Western Gateway Employment District Corridor as part of the OCP update.
Introduction
View Royal is offering a number of opportunities for the public to provide their thoughts on updating the Official Community Plan (OCP). Ensuring that participants have access to clear information describing both the changes and the likely outcomes is an essential step toward informed participation.
Proposing increases in the carrying capacity of land and making forecasts of growth (population, housing targets, commercial floorspace etc.) are not stand-alone concepts. Applying the growth forecasts to test the capacity increase, or vice versa, is a necessary step toward understanding if a balance between growth and capacity is a likely outcome or to adjust the capacity toward a balanced position.
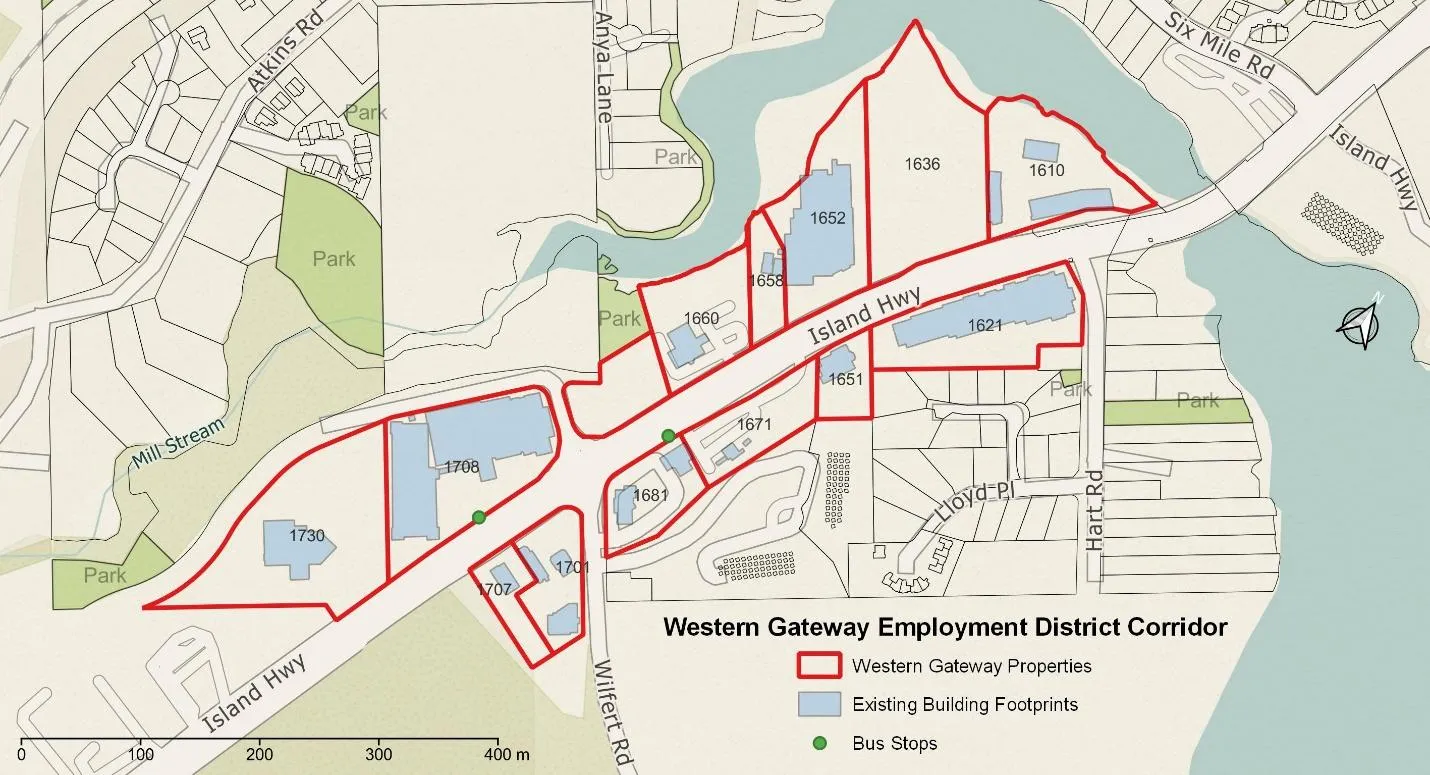
Western Gateway Employment District Corridor
The 2025 Official Community Plan (OCP) update project has identified an area along Island Highway as the Western Gateway Employment District Corridor (Westgate). The corridor consists of 13¹ properties that front onto Island Highway. A document called Housing Capacity Analysis and Land Use Scenarios proposes a new Land Use Designation (LUD) as well as some capacity scenarios that could be applied in the corridor.
Some Westgate properties have terrain that may restrict the size of the development footprint. Building taller, even with the same Floor Space Ratio (FSR), can reduce the size of the building footprint. For instance, an FSR of 2.5 at 6 storeys results in a 33% smaller footprint than an FSR of 2.5 at 4 storeys.
In Table 1, and throughout this document, the calculation of the total floor area of a development, called the Gross Floor Space (GFS), is simply: Land Area X Floor Space Ratio (FSR) = Gross Floor Space (GFS).
¹ One additional property earmarked for General Employment land use is not included in the estimates. The General Employment Land Use Designation describes lots that have sufficient useful area for large floor plates, vehicle circulation and access for shipping and delivery. The excluded lot proposed for General Employment has none of those characteristics.
What exists, what is allowed and what is proposed?
To understand the proposed changes, it is helpful to know what exists in the corridor right now. Table 1 shows the total land area of the Westgate corridor properties. The combined floorspace of all the existing buildings (31650m²) represents about one-tenth of the development allowed in the 2011 OCP.
Table 1
| Total Land Area | Existing Buildings GFS | Potential GFS: Current Zoning | Potential GFS: 2011 OCP | Proposed GFS: 2025 OCP Scenario 2 | Proposed GFS: 2025 OCP Scenario 1a | Proposed GFS: 2025 OCP Scenario 1b | |
|---|---|---|---|---|---|---|---|
| FSR: Various | 4 Storeys FSR: 2.5 | 6 Storeys FSR: 2.5 | 10 Storeys FSR: 3.5 | 15 Storeys FSR: 4.0 | |||
| Meters² | 116,696 | 31,650 | 95,680 | 291,740 | 291,740 | 408,436 | 466,784 |
| Feet² | 1,256,104 | 340,677 | 1,029,894 | 3,140,260 | 3,140,260 | 4,396,364 | 5,024,416 |
It’s clear that there is still a great amount of development that could occur using the 2011 OCP designations. However, the restriction to 4 storeys along this corridor forces a larger building footprint on the land and may also prevent the use of effective construction options. Scenario 2 allows 6 storeys with exactly the same GFS; this could offer greater flexibility where challenging lot conditions are found.
Proposed Scenario 1 has two versions, a and b, that envision 10 to 15 story buildings with a higher FSR. This presents an opportunity to develop a large amount of floor space but that could be tempered if demand is limited for multi-story retail/service/office space. Will the dominant development purpose in this corridor be for employment or will the majority of floorspace be used for other purposes?
The first part of this document looked at the raw development potential in the entire corridor given an unlimited amount of time. The second part focuses on four properties in order to contextualize how much capacity each scenario delivers and what purpose it might serve.
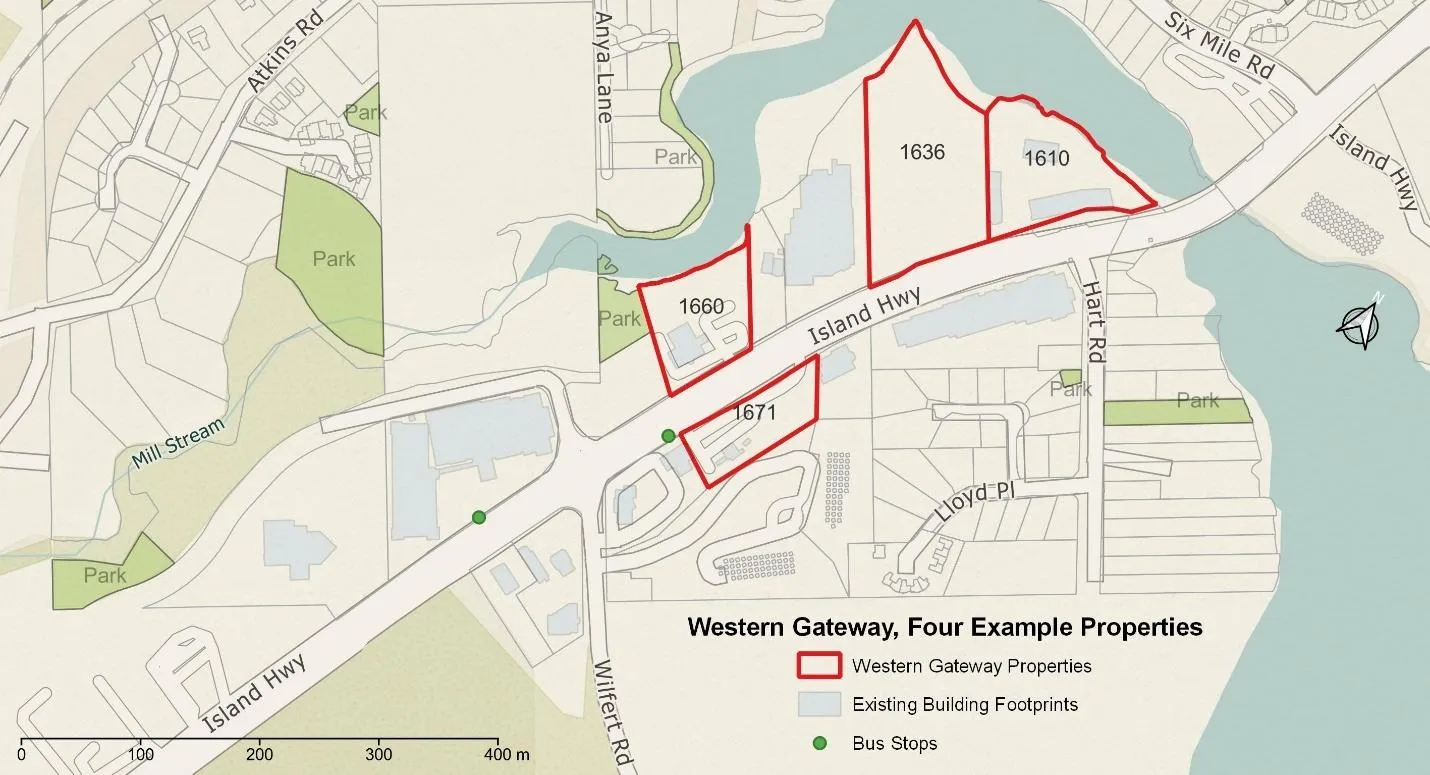
The four properties in this example were chosen because the assessed value of the current improvements is low and most of the lot area is suitable for development. These properties represent only 34% of the land area in the Westgate corridor.
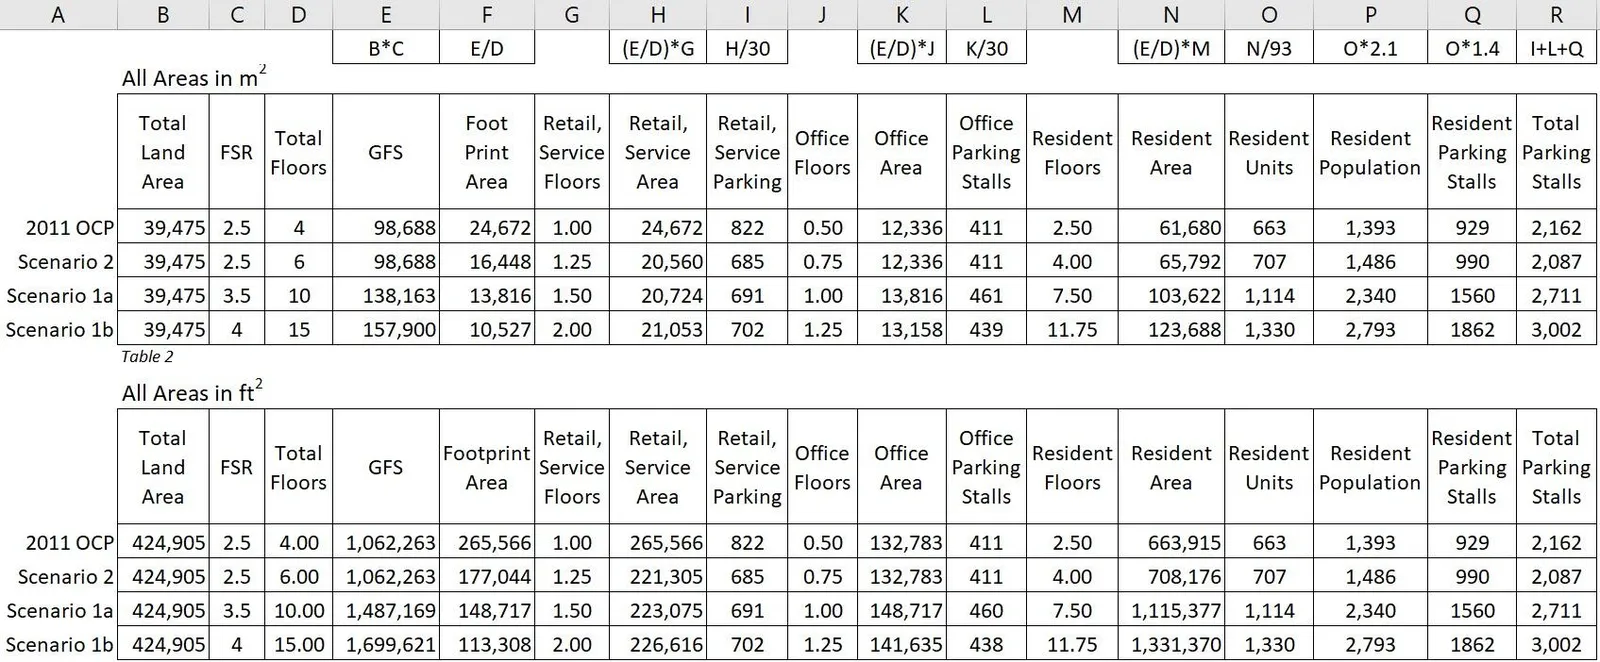
Table 2 shows the capacity of the total combined land area of these four properties as well as four land use scenarios. Retail and office space is stated as floor area. The number of residential units is shown, each unit is 93m² (1000ft²). The potential population is calculated at 2.1 people per apartment. Parking was calculated at 1.4 stalls per residential unit and 1 stall for every 30m² of office or retail use as per the 2025 Land Economics Study (LES).
Table 2
| Total Land Area m² | FSR | Total Floors | GFS | Retail Floors | Retail Area | Office Floors | Office Area | Res. Floors | Res. Area | Res Units at 93m² | Res Pop. at 2.1 | Total Parking Stalls | |
|---|---|---|---|---|---|---|---|---|---|---|---|---|---|
| 2011 OCP | 39,475 | 2.5 | 4 | 98,688 | 1.00 | 24,672 | 0.50 | 12,336 | 2.50 | 61,680 | 663 | 1,393 | 2,162 |
| Scenario 2 | 39,475 | 2.5 | 6 | 98,688 | 1.25 | 20,560 | 0.75 | 12,336 | 4.00 | 65,792 | 707 | 1,486 | 2,087 |
| Scenario 1a | 39,475 | 3.5 | 10 | 138,163 | 1.50 | 20,724 | 1.00 | 13,816 | 7.50 | 103,622 | 1,114 | 2,340 | 2,711 |
| Scenario 1b | 39,475 | 4 | 15 | 157,900 | 2.00 | 21,053 | 1.25 | 13,158 | 11.75 | 123,688 | 1,330 | 2,793 | 3,002 |
The LES forecasts the 2025-2050 maximum growth of retail floorspace (19,616m²) and office floorspace (11,799m²). Table 2 shows that all four scenarios surpass the entire 25-year retail and office floorspace forecast for View Royal. Each scenario shows 66% to 78% of the floorspace could be put to other uses such as residential.
Development of the Transit Oriented Area near the hospital may also compete for office and retail space. The Western Gateway Employment District Corridor land use designation is not exclusively commercial. It allows that “mixed-use buildings with employment and residential uses may be permitted”.
Has the right balance between an employment district and a residential district been found?
Remarks:
- Please take the information found here as it is intended; the numbers paint a big-picture estimate of potential development capacity; there is no intention to describe a specific outcome. Iterations of a similar estimate could help identify alternatives or adjust capacity options.
- This document provides examples of the type of information that the public needs in order to contribute informed opinions during public engagement. Of course, the council must also have information in order to make good decisions.
- The information lends context to the proposed OCP capacity changes and puts the growth forecasts in the Land Economics Study to work. There are other effects and impacts from increasing density that could be examined with a similar approach. For instance, what short- and long-term financial benefits are there for View Royal in each scenario?
A version of Table 2 appears on the next page. It includes a few more details and is shown along with an imperial version.