Presentation: Town of View Royal 2023 Consolidated Financial Statements
A slide deck providing an overview of the financial statements, including definitions of accounting terms and key sustainability and flexibility ratios.
Town of View Royal 2023 Consolidated Financial Statements
Contents
- Management’s responsibility for financial reporting
- Consolidated Statements:
- Financial Position
- Operations
- Net Financial Assets
- Cash Flows
- Notes
- Segment Disclosures
- Tangible Capital Assets
- Independent Auditor’s Report
- Audit Findings Report
Who does what?
Management’s responsibility
- To prepare compliant financial statements that are objective, consistent and have integrity
Mayor and Council’s responsibility
- Make sure management does its job
- Meet with management and auditors to review and discuss matters
Auditor’s responsibility
- Conduct independent examination
- Evaluate the systems of internal control
- Express an opinion on the financial statements – do they fairly represent the actual position of the Town?
Financial Statements Overview
- Consolidated Statement of Financial Position (Statement A): aka Balance Sheet. Where are we at on December 31, 2023?
- Consolidated Statement of Operations (Statement B): aka Income Statement. What happened in 2023?
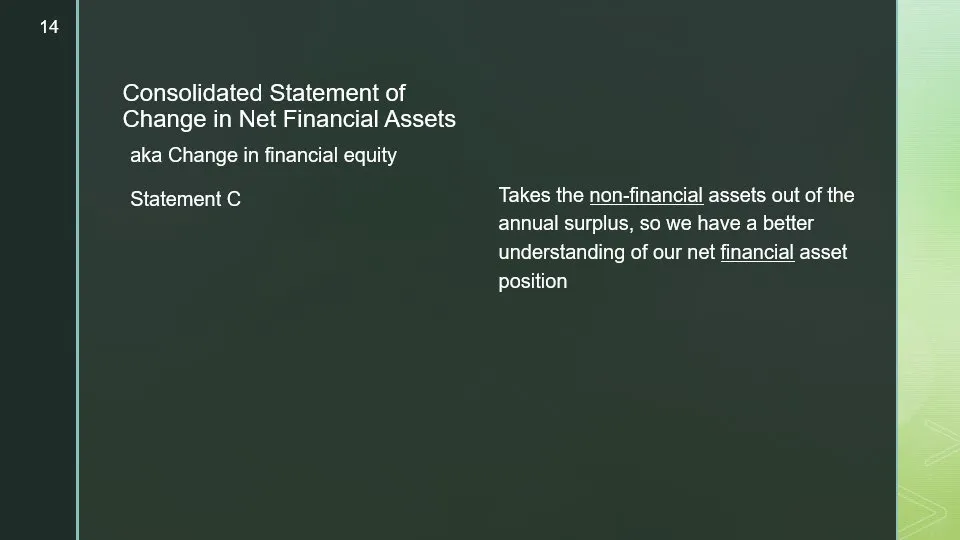
- Consolidated Statement of Change in Net Financial Assets (Statement C): aka Change in financial equity. Takes the non-financial assets out of the annual surplus for a better understanding of net financial asset position.
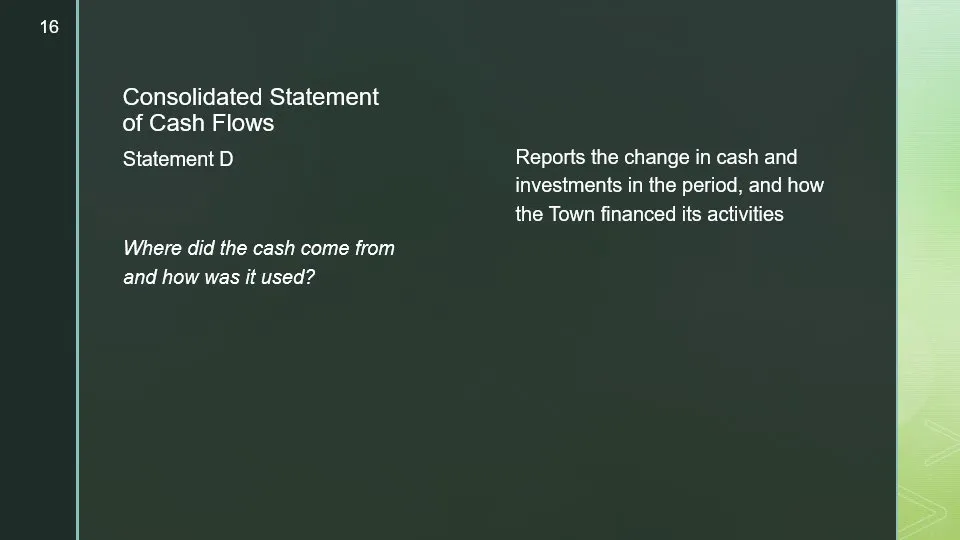
- Consolidated Statement of Cash Flows (Statement D): Reports the change in cash and investments in the period, and how the Town financed its activities.
- Notes to Consolidated Financial Statements: aka "Notes". Provides context, accounting policies, details, and information.
- Consolidated Schedules of Segment Disclosure by Service (Segmented Info): Describes Revenue & Expense categories for each function shown on Statement B.
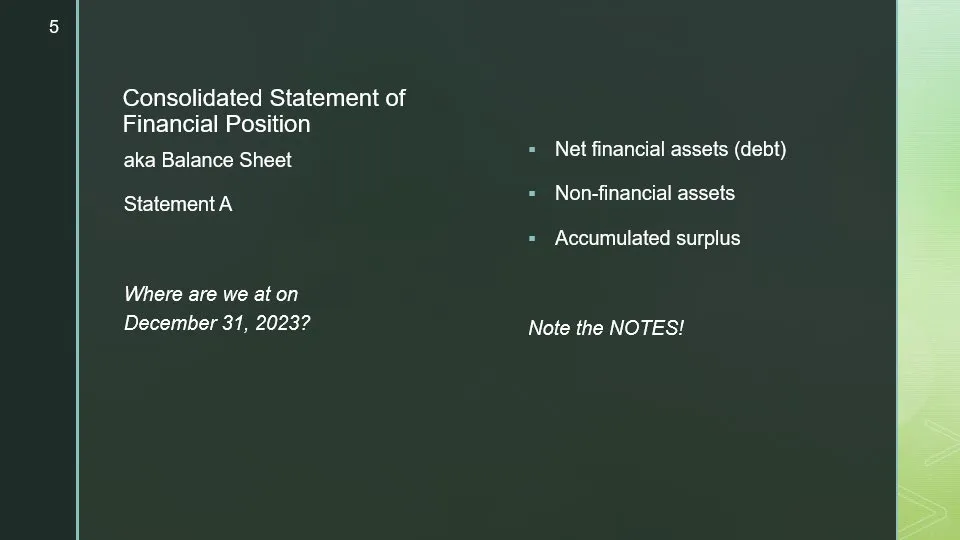
Consolidated Statement of Financial Position
aka Balance Sheet Statement A
Where are we at on December 31, 2023?
- Net financial assets (debt)
- Non-financial assets
- Accumulated surplus
Note the NOTES!
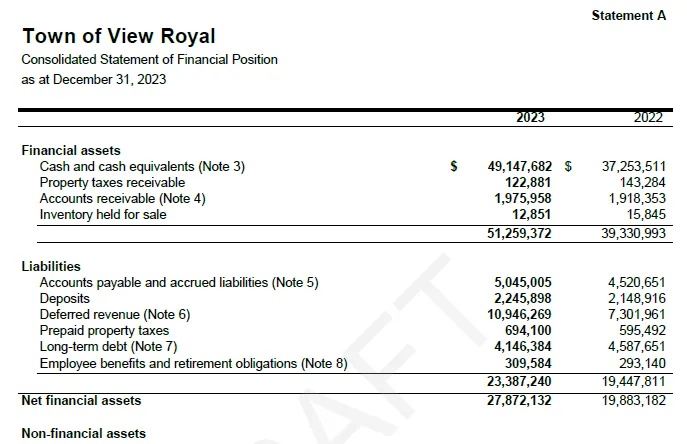
Town of View Royal
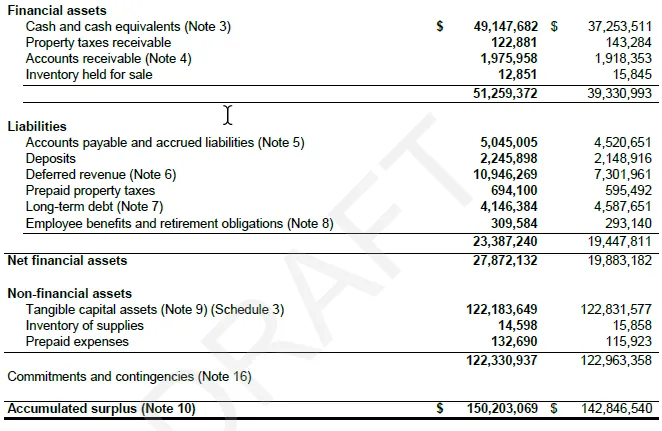
Consolidated Statement of Financial Position
as at December 31, 2023
| Financial assets | 2023 | 2022 |
|---|---|---|
| Cash and cash equivalents (Note 3) | $ 49,147,682 | $ 37,253,511 |
| Property taxes receivable | 122,881 | 143,284 |
| Accounts receivable (Note 4) | 1,975,958 | 1,918,353 |
| Inventory held for sale | 12,851 | 15,845 |
| Total Financial Assets | 51,259,372 | 39,330,993 |
| Liabilities | ||
| Accounts payable and accrued liabilities (Note 5) | 5,045,005 | 4,520,651 |
| Deposits | 2,245,898 | 2,148,916 |
| Deferred revenue (Note 6) | 10,946,269 | 7,301,961 |
| Prepaid property taxes | 694,100 | 595,492 |
| Long-term debt (Note 7) | 4,146,384 | 4,587,651 |
| Employee benefits and retirement obligations (Note 8) | 309,584 | 293,140 |
| Total Liabilities | 23,387,240 | 19,447,811 |
| Net financial assets | 27,872,132 | 19,883,182 |
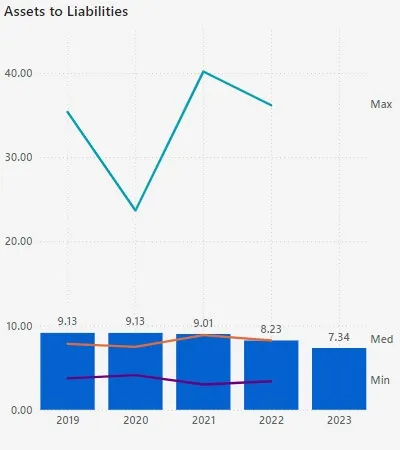
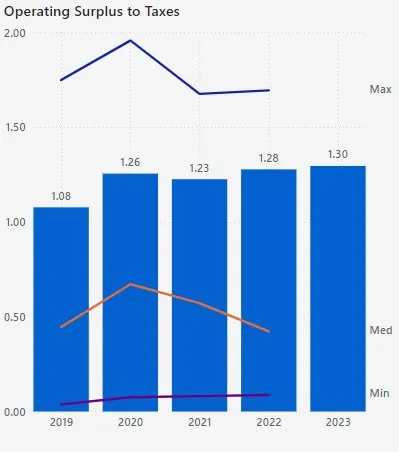
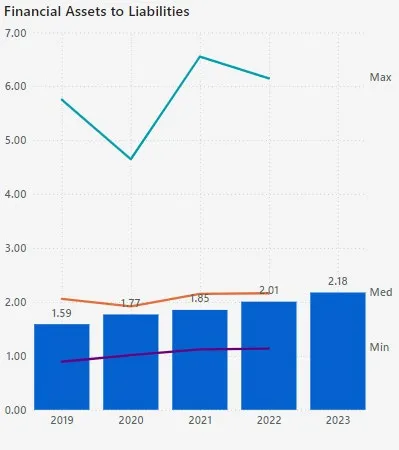
Sustainability ratios
| Non-financial assets | 2023 | 2022 |
|---|---|---|
| Tangible capital assets (Note 9) (Schedule 3) | 122,183,649 | 122,831,577 |
| Inventory of supplies | 14,598 | 15,858 |
| Prepaid expenses | 132,690 | 115,923 |
| Total Non-financial assets | 122,330,937 | 122,963,358 |
| Commitments and contingencies (Note 16) | ||
| Accumulated surplus (Note 10) | $ 150,203,069 | $ 142,846,540 |
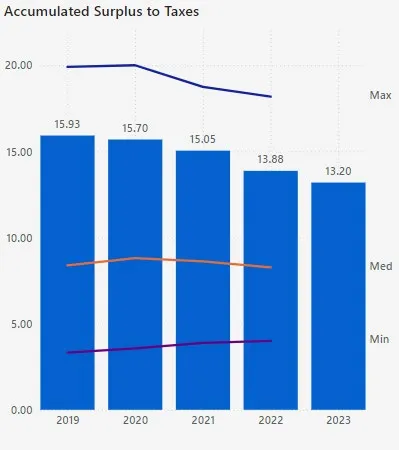
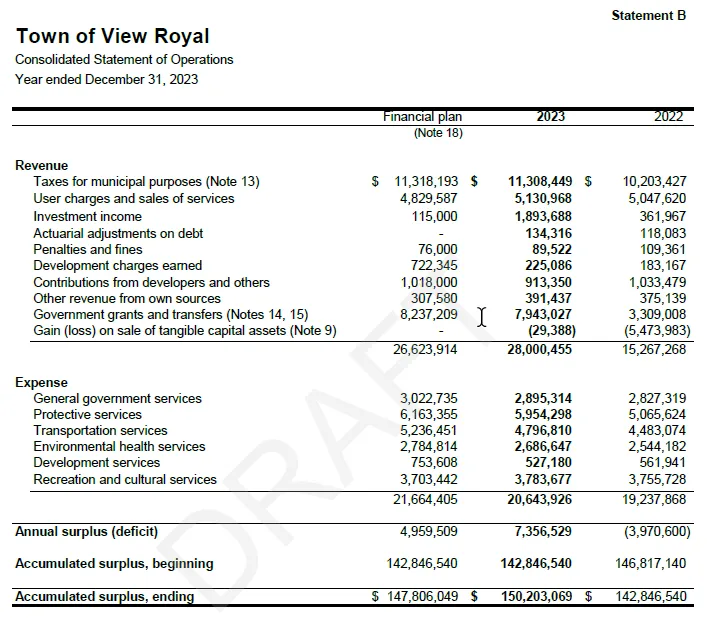
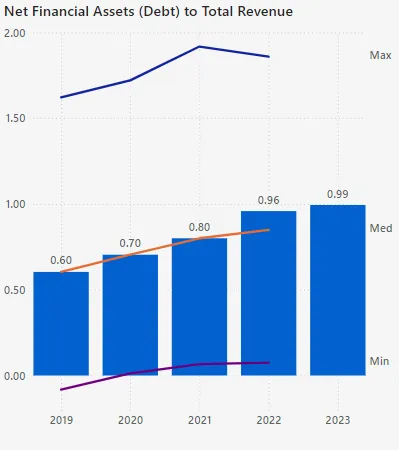
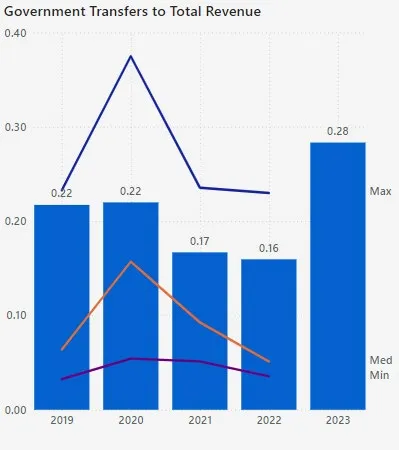
Flexibility ratios
Consolidated Statement of Operations
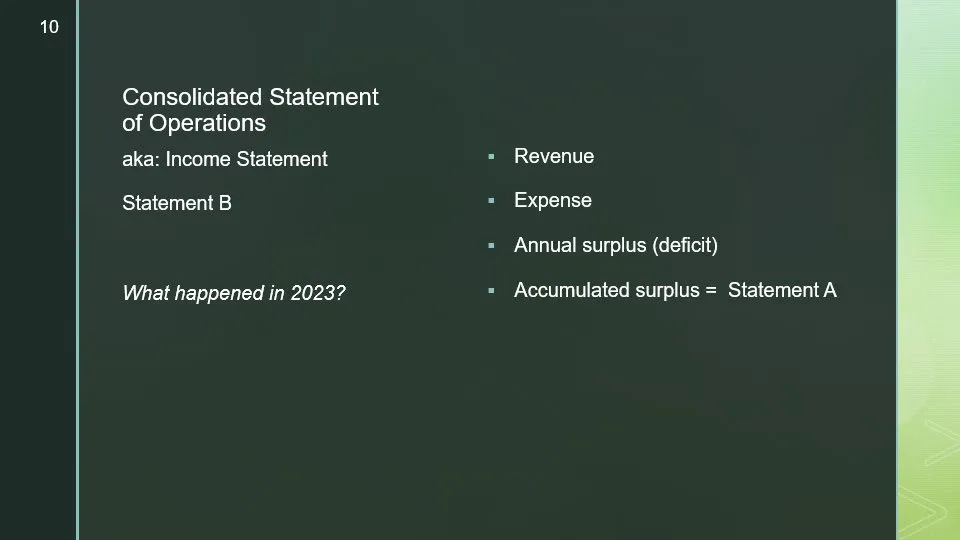
aka: Income Statement Statement B
What happened in 2023?
- Revenue
- Expense
- Annual surplus (deficit)
- Accumulated surplus = Statement A
Town of View Royal
Consolidated Statement of Operations
Year ended December 31, 2023
| Financial plan (Note 18) | 2023 | 2022 | |
|---|---|---|---|
| Revenue | |||
| Taxes for municipal purposes (Note 13) | $ 11,318,193 | $ 11,308,449 | $ 10,203,427 |
| User charges and sales of services | 4,829,587 | 5,130,968 | 5,047,620 |
| Investment income | 115,000 | 1,893,688 | 361,967 |
| Actuarial adjustments on debt | - | 134,316 | 118,083 |
| Penalties and fines | 76,000 | 89,522 | 109,361 |
| Development charges earned | 722,345 | 225,086 | 183,167 |
| Contributions from developers and others | 1,018,000 | 913,350 | 1,033,479 |
| Other revenue from own sources | 307,580 | 391,437 | 375,139 |
| Government grants and transfers (Notes 14, 15) | 8,237,209 | 7,943,027 | 3,309,008 |
| Gain (loss) on sale of tangible capital assets (Note 9) | - | (29,388) | (5,473,983) |
| Total Revenue | 26,623,914 | 28,000,455 | 15,267,268 |
| Expense | |||
| General government services | 3,022,735 | 2,895,314 | 2,827,319 |
| Protective services | 6,163,355 | 5,954,298 | 5,065,624 |
| Transportation services | 5,236,451 | 4,796,810 | 4,483,074 |
| Environmental health services | 2,784,814 | 2,686,647 | 2,544,182 |
| Development services | 753,608 | 527,180 | 561,941 |
| Recreation and cultural services | 3,703,442 | 3,783,677 | 3,755,728 |
| Total Expense | 21,664,405 | 20,643,926 | 19,237,868 |
| Annual surplus (deficit) | 4,959,509 | 7,356,529 | (3,970,600) |
| Accumulated surplus, beginning | 142,846,540 | 142,846,540 | 146,817,140 |
| Accumulated surplus, ending | $ 147,806,049 | $ 150,203,069 | $ 142,846,540 |
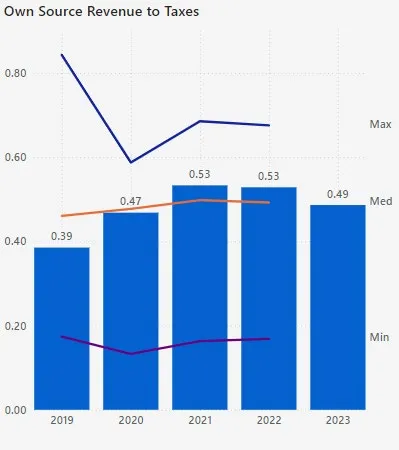
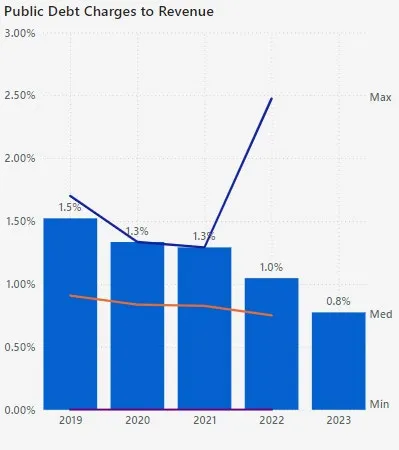
Flexibility ratios
Consolidated Statement of Change in Net Financial Assets
aka Change in financial equity Statement C
Takes the non-financial assets out of the annual surplus, so we have a better understanding of our net financial asset position.
Town of View Royal
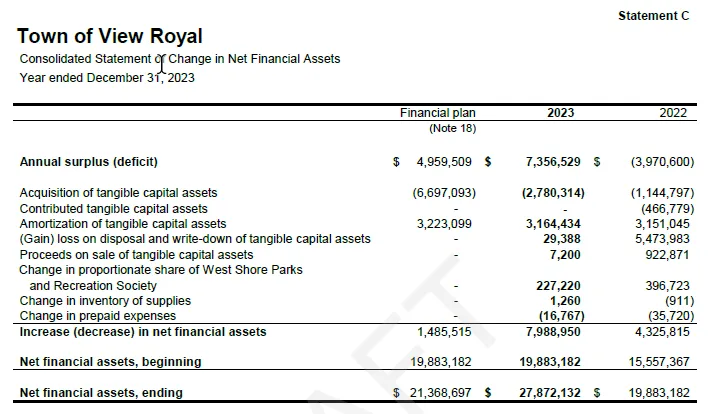
Consolidated Statement of Change in Net Financial Assets
Year ended December 31, 2023
| Financial plan (Note 18) | 2023 | 2022 | |
|---|---|---|---|
| Annual surplus (deficit) | $ 4,959,509 | $ 7,356,529 | $ (3,970,600) |
| Acquisition of tangible capital assets | (6,697,093) | (2,780,314) | (1,144,797) |
| Contributed tangible capital assets | - | - | (466,779) |
| Amortization of tangible capital assets | 3,223,099 | 3,164,434 | 3,151,045 |
| (Gain) loss on disposal and write-down of tangible capital assets | - | 29,388 | 5,473,983 |
| Proceeds on sale of tangible capital assets | - | 7,200 | 922,871 |
| Change in proportionate share of West Shore Parks and Recreation Society | - | 227,220 | 396,723 |
| Change in inventory of supplies | - | 1,260 | (911) |
| Change in prepaid expenses | - | (16,767) | (35,720) |
| Increase (decrease) in net financial assets | 1,485,515 | 7,988,950 | 4,325,815 |
| Net financial assets, beginning | 19,883,182 | 19,883,182 | 15,557,367 |
| Net financial assets, ending | $ 21,368,697 | $ 27,872,132 | $ 19,883,182 |
Consolidated Statement of Cash Flows
Statement D
Reports the change in cash and investments in the period, and how the Town financed its activities. Where did the cash come from and how was it used?
Town of View Royal
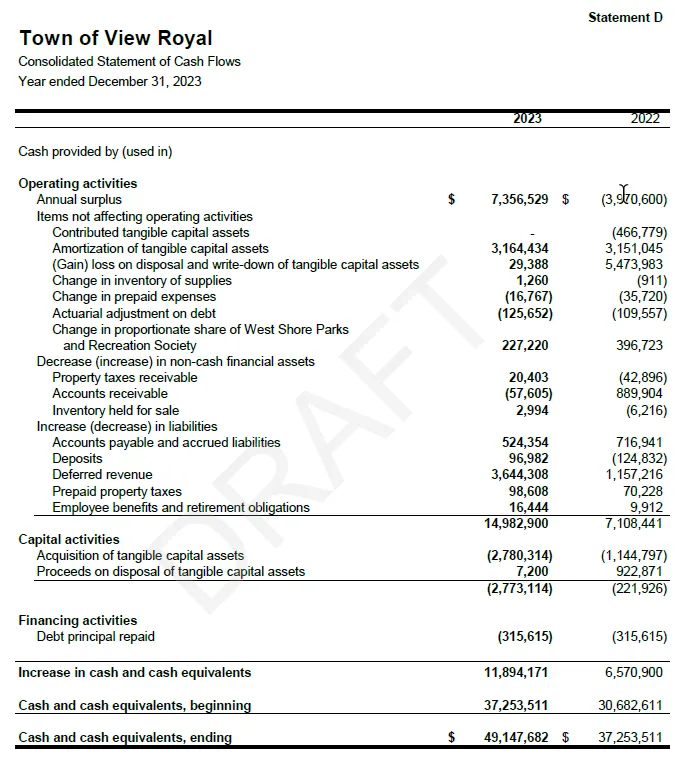
Consolidated Statement of Cash Flows
Year ended December 31, 2023
| Cash provided by (used in) | 2023 | 2022 |
|---|---|---|
| Operating activities | ||
| Annual surplus | $ 7,356,529 | $ (3,970,600) |
| Items not affecting operating activities: | ||
| Contributed tangible capital assets | - | (466,779) |
| Amortization of tangible capital assets | 3,164,434 | 3,151,045 |
| (Gain) loss on disposal and write-down of tangible capital assets | 29,388 | 5,473,983 |
| Change in inventory of supplies | 1,260 | (911) |
| Change in prepaid expenses | (16,767) | (35,720) |
| Actuarial adjustment on debt | (125,652) | (109,557) |
| Change in proportionate share of West Shore Parks and Recreation Society | 227,220 | 396,723 |
| Decrease (increase) in non-cash financial assets: | ||
| Property taxes receivable | 20,403 | (42,896) |
| Accounts receivable | (57,605) | 889,904 |
| Inventory held for sale | 2,994 | (6,216) |
| Increase (decrease) in liabilities: | ||
| Accounts payable and accrued liabilities | 524,354 | 716,941 |
| Deposits | 96,982 | (124,832) |
| Deferred revenue | 3,644,308 | 1,157,216 |
| Prepaid property taxes | 98,608 | 70,228 |
| Employee benefits and retirement obligations | 16,444 | 9,912 |
| Net cash from operating activities | 14,982,900 | 7,108,441 |
| Capital activities | ||
| Acquisition of tangible capital assets | (2,780,314) | (1,144,797) |
| Proceeds on disposal of tangible capital assets | 7,200 | 922,871 |
| Net cash from capital activities | (2,773,114) | (221,926) |
| Financing activities | ||
| Debt principal repaid | (315,615) | (315,615) |
| Increase in cash and cash equivalents | 11,894,171 | 6,570,900 |
| Cash and cash equivalents, beginning | 37,253,511 | 30,682,611 |
| Cash and cash equivalents, ending | $ 49,147,682 | $ 37,253,511 |
Notes to Consolidated Financial Statements
aka “Notes”
- Context
- Accounting policies
- Details
- Information
Town of View Royal
Notes to Consolidated Financial Statements
Year ended December 31, 2023
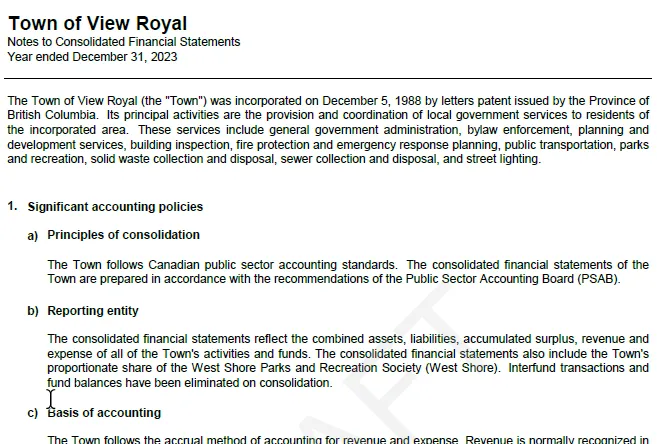
The Town of View Royal (the "Town") was incorporated on December 5, 1988 by letters patent issued by the Province of British Columbia. Its principal activities are the provision and coordination of local government services to residents of the incorporated area. These services include general government administration, bylaw enforcement, planning and development services, building inspection, fire protection and emergency response planning, public transportation, parks and recreation, solid waste collection and disposal, sewer collection and disposal, and street lighting.
1. Significant accounting policies
a) Principles of consolidation The Town follows Canadian public sector accounting standards. The consolidated financial statements of the Town are prepared in accordance with the recommendations of the Public Sector Accounting Board (PSAB).
b) Reporting entity The consolidated financial statements reflect the combined assets, liabilities, accumulated surplus, revenue and expense of all of the Town's activities and funds. The consolidated financial statements also include the Town's proportionate share of the West Shore Parks and Recreation Society (West Shore). Interfund transactions and fund balances have been eliminated on consolidation.
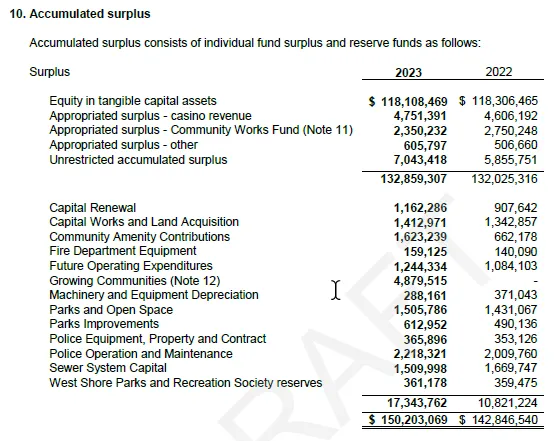
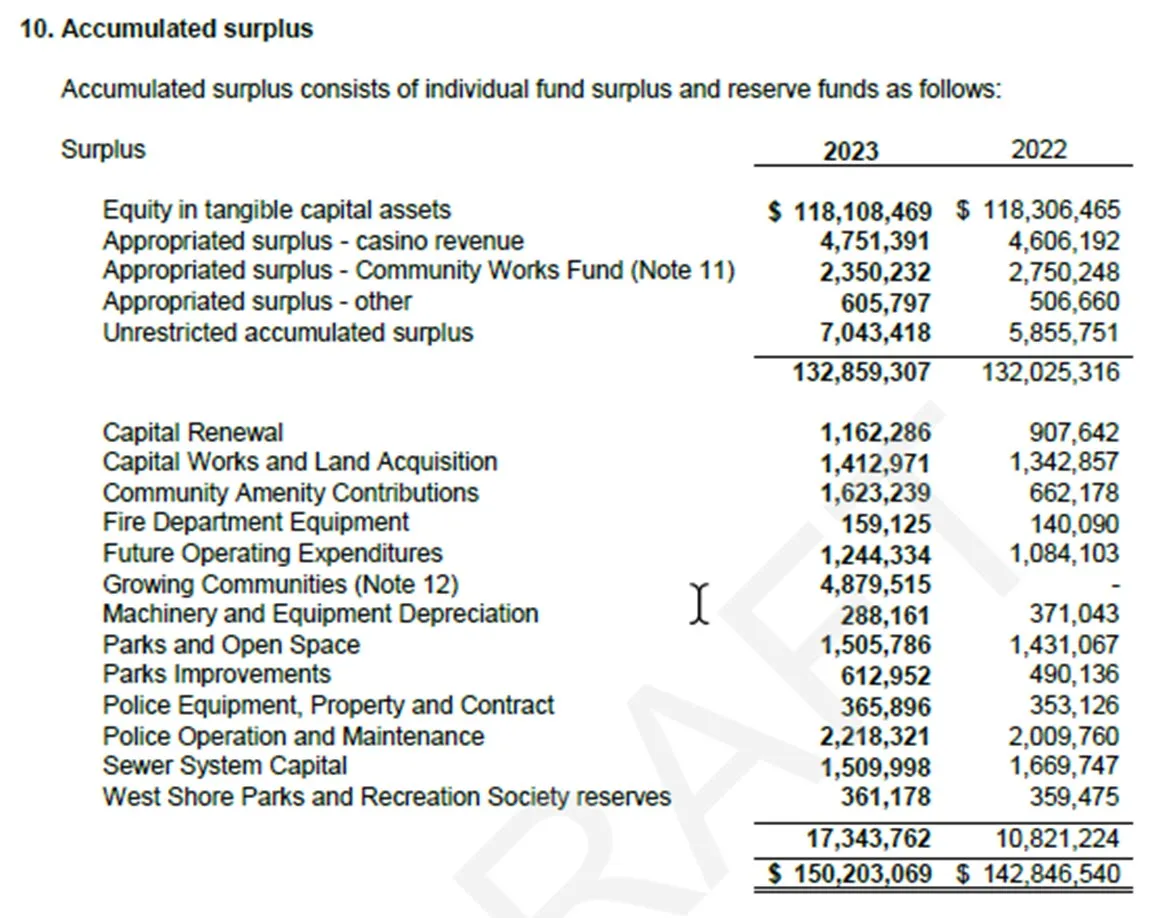
10. Accumulated surplus
Accumulated surplus consists of individual fund surplus and reserve funds as follows:
| Surplus | 2023 | 2022 |
|---|---|---|
| Equity in tangible capital assets | $ 118,108,469 | $ 118,306,465 |
| Appropriated surplus - casino revenue | 4,751,391 | 4,606,192 |
| Appropriated surplus - Community Works Fund (Note 11) | 2,350,232 | 2,750,248 |
| Appropriated surplus - other | 605,797 | 506,660 |
| Unrestricted accumulated surplus | 7,043,418 | 5,855,751 |
| 132,859,307 | 132,025,316 | |
| Capital Renewal | 1,162,286 | 907,642 |
| Capital Works and Land Acquisition | 1,412,971 | 1,342,857 |
| Community Amenity Contributions | 1,623,239 | 662,178 |
| Fire Department Equipment | 159,125 | 140,090 |
| Future Operating Expenditures | 1,244,334 | 1,084,103 |
| Growing Communities (Note 12) | 4,879,515 | - |
| Machinery and Equipment Depreciation | 288,161 | 371,043 |
| Parks and Open Space | 1,505,786 | 1,431,067 |
| Parks Improvements | 612,952 | 490,136 |
| Police Equipment, Property and Contract | 365,896 | 353,126 |
| Police Operation and Maintenance | 2,218,321 | 2,009,760 |
| Sewer System Capital | 1,509,998 | 1,669,747 |
| West Shore Parks and Recreation Society reserves | 361,178 | 359,475 |
| 17,343,762 | 10,821,224 | |
| Total Accumulated Surplus | $ 150,203,069 | $ 142,846,540 |
Difference $7,356,539 = 2023 surplus
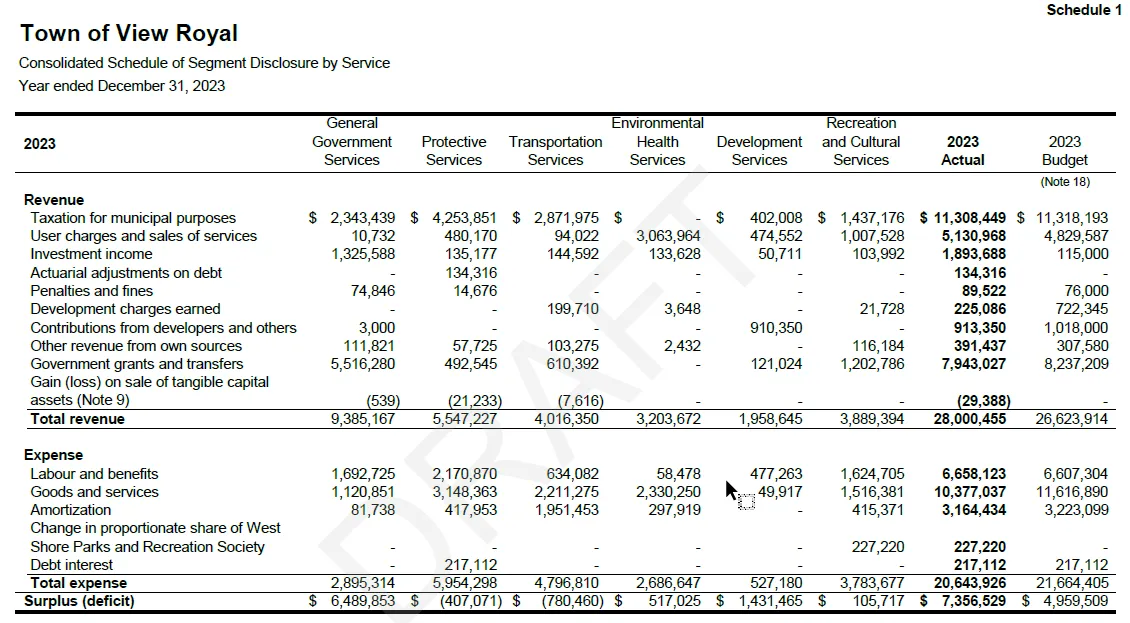
Consolidated Schedules of Segment Disclosure by Service
aka Segmented Info
Describes R & E categories for each function shown on Statement B.
- Schedule 1 (2023)
- Schedule 2 (2022)
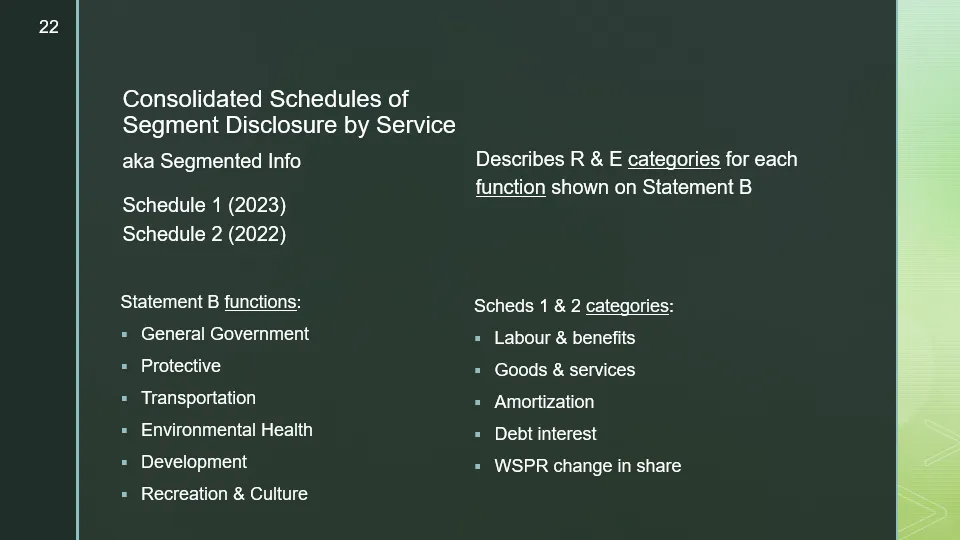
Statement B functions:
- General Government
- Protective
- Transportation
- Environmental Health
- Development
- Recreation & Culture
Scheds 1 & 2 categories:
- Labour & benefits
- Goods & services
- Amortization
- Debt interest
- WSPR change in share
Town of View Royal
Consolidated Schedule of Segment Disclosure by Service
Year ended December 31, 2023 Schedule 1

| 2023 Actual | General Government | Protective | Transportation | Environmental Health | Development | Recreation and Cultural | Total |
|---|---|---|---|---|---|---|---|
| Total Revenue | $ 9,385,167 | $ 5,547,227 | $ 4,016,350 | $ 3,203,672 | $ 1,958,645 | $ 3,889,394 | $ 28,000,455 |
| Total Expense | 2,895,314 | 5,954,298 | 4,796,810 | 2,686,647 | 527,180 | 3,783,677 | 20,643,926 |
| Surplus (deficit) | $ 6,489,853 | $ (407,071) | $ (780,460) | $ 517,025 | $ 1,431,465 | $ 105,717 | $ 7,356,529 |
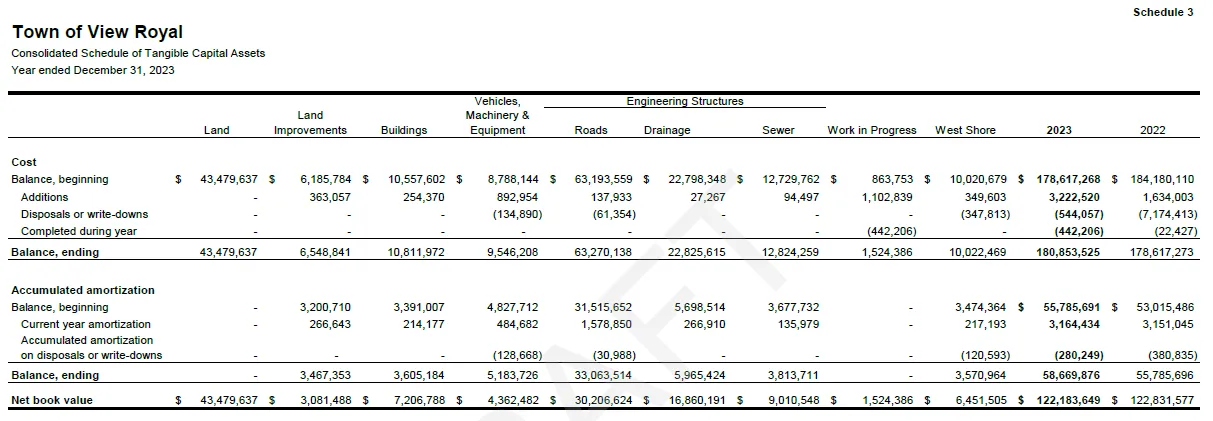
Consolidated Schedule of Tangible Capital Assets
aka TCA Schedule Schedule 3
Details for each category of TCA:
- Historical costs
- Additions and disposals in the year
- Amortization
- Net book value
- Includes prior year comparatives
Town of View Royal
Consolidated Schedule of Tangible Capital Assets
Year ended December 31, 2023 Schedule 3
| Cost | Land | Land Improvements | Buildings | Vehicles, Machinery & Equipment | Engineering Structures | Work in Progress | West Shore | 2023 Total | 2022 Total |
|---|---|---|---|---|---|---|---|---|---|
| Balance, ending | $43,479,637 | $6,548,841 | $10,811,972 | $9,546,208 | $98,920,012 | $1,524,386 | $10,022,469 | $180,853,525 | $178,617,273 |
| Accumulated amortization | |||||||||
| Balance, ending | - | 3,467,353 | 3,605,184 | 5,183,726 | 42,842,439 | - | 3,570,964 | 58,669,876 | 55,785,696 |
| Net book value | $43,479,637 | $3,081,488 | $7,206,788 | $4,362,482 | $56,077,573 | $1,524,386 | $6,451,505 | $122,183,649 | $122,831,577 |
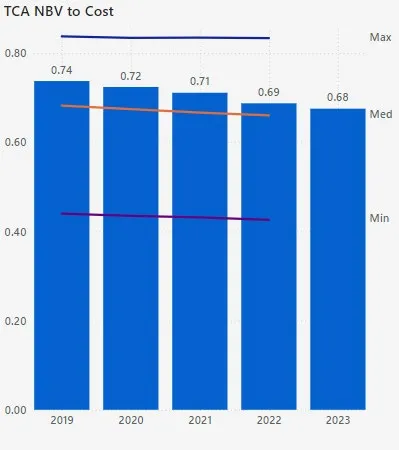
Flexibility and Vulnerability ratios
Questions?
Document Images
(5)