Dated April 2023Total estimated investment for short-term projects: $11,013,200Target: Achieve 25% trips by walking, cycling, or transitTop 3 corridors: Admirals Road, Island Highway, Helmcken Interchange
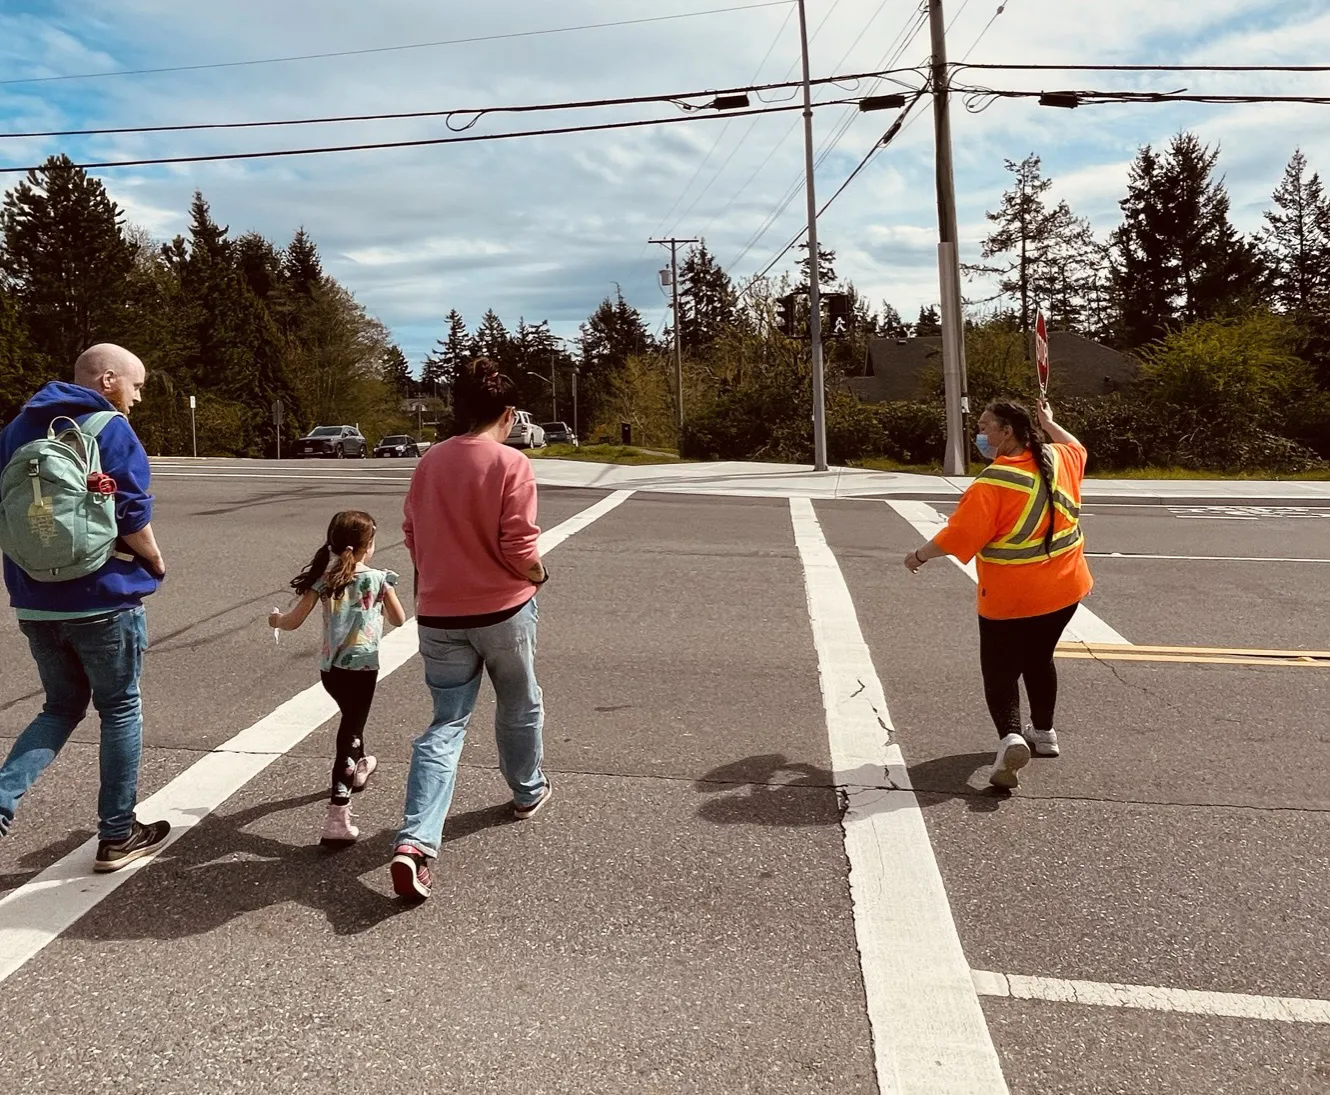
A group of three people, two adults and a child, walking across a crosswalk guided by a crossing guard in an orange safety vest holding a stop sign.
Active Transportation Network Plan
Page 122–150
TOWN OF VIEW ROYAL
April 2023
Page 122–150
TOWN OF VIEW ROYAL ACTIVE TRANSPORTATION NETWORK PLAN
View Royal Active Transportation Plan
WATT VICTORIA
302 – 740 Hillside Ave
Victoria, BC V8T 1Z4
250-388-9877
Prepared For: Town of View Royal
Date: April 27, 2023
Our File No: 3274.B01
LAND ACKNOWLEDGEMENT
The Town of View Royal acknowledges with respect that it is within the unceded traditional territories of the Lekwungen peoples, known today as the Esquimalt and Songhees Nations, and that their historic connections to these lands continue to this day.
GRANT ACKNOWLEDGEMENT
The preparation of this project was carried out with assistance from the Province of British Columbia (B.C.). Notwithstanding this support, the views expressed are the personal views of the authors, and the Province of B.C. accept no responsibility for them.
PROJECT ACKNOWLEDGEMENTS
WATT Consulting Group would like to thank View Royal residents, Town staff, elected officials, local schools, and other stakeholders who provided invaluable feedback throughout the plan process. Your input and contributions improved the overall process and resulted in a plan tailored to the needs of View Royal.
The Active Transportation Network Plan was a highly collaborative and iterative process involving members from the consulting team and Town staff as shown below.
WATT Consulting Group
Tim Shah, RPP, MCIP: Sr. Transportation Planner & Planning Lead
Aerial view of a paved road with a sidewalk on one side, a car driving, and a cyclist on the shoulder, surrounded by lush green trees.
The Town of View Royal Active Transportation Network Plan (ATNP) is the Town’s first comprehensive document that provides a 10-year roadmap outlining the short-term infrastructure improvements, policies, and programs needed to prioritize active transportation in the View Royal. Active transportation has been an important part of the Town’s transportation discussions and decisions since the 2008 Transportation Master Plan was adopted. Further, the importance of active transportation opportunities has been further highlighted in the 2019-2022 Strategic Plan and 2022 Community Climate Action Strategy.
Recognizing the Town’s policy and planning support for active transportation, View Royal applied for and successfully obtained a B.C. Active Transportation Infrastructure grant to undertake the ATNP. One of the key objectives of the grant funding is to ensure that the ATNP clearly identifies gaps in the active transportation network and the priorities needed to address those gaps.
To that end, the Town, in partnership with WATT Consulting Group, undertook a one-year planning process that included detailed technical analysis and extensive public and stakeholder engagement. A total of four project deliverables were produced throughout the plan process and made available on the Town’s website. Those documents are summarized as follows:
Baseline Conditions Report (August 2022) | the purpose of this report was to understand View Royal’s current active transportation context. It provided an overview of existing transportation mode share and travel patterns; summarized the main barriers to walking, rolling, and cycling in the Town today; and identified the key issues that required further analysis—and outreach with the community—to determine the short-term priorities for the active transportation network.
What We Heard Report #1 (September 2022) | this report served as the first public and stakeholder engagement summary for the ATNP. It summarized the first round of engagement that took place in the summer of 2022 and included the key findings from the ideas fair, online survey #1, and the stakeholder interviews. The report served to corroborate and supplement the technical analysis completed in the Baseline Conditions Report.
What We Heard Report #2 (January 2023) | this report summarized the second round of engagement, which took place in November and December 2022. It included the key findings from the bikeshops and online survey #2, which ultimately shaped the recommendations for the short-term priority projects in the ATNP.
Active Transportation Network Plan (March-April 2023) | the ATNP (this document) acts as a compilation of the three preceding documents culminating a year-long planning process.
Vision & Plan Objectives
View Royal is a dynamic, inclusive, and connected community that recognizes the impacts of climate change. Its active transportation network allows residents and visitors alike to move around the community safely by walking, cycling, or rolling. The active transportation network connects neighbourhoods, schools, employment destinations, transit stops, natural environments including parks and green spaces, and with regional trails and neighbouring communities. A connected, compact, and safe network of active transportation facilities make driving the least attractive option and change the culture of transportation in View Royal, helping the town reduce GHG emissions, boost its local economy, and enhance its overall resilience—meeting the needs of the present and future generations.
Four distinct objectives have been identified as part of this plan, which aim to provide tangible targets so that View Royal can achieve its active transportation vision. The objectives are included below; each one has targets which are presented in Section 4.2 of the plan.
Objective #1: The Culture of Active Transportation
Objective #2: All Ages & Abilities Facilities
Objective #3: Local & Community Connections
Objective #4: Regional Connections
Short-term Priority Projects
The ATNP is intended to be a 10-year plan to keep the Town focused on the short-term projects. However, as a visionary document, the ATNP also includes an ultimate network that illustrates even more options for people walking / rolling and cycling. Achieving the ultimate network, however, may take several years, require significant financial resources, and continued engagement with the public and key stakeholders.
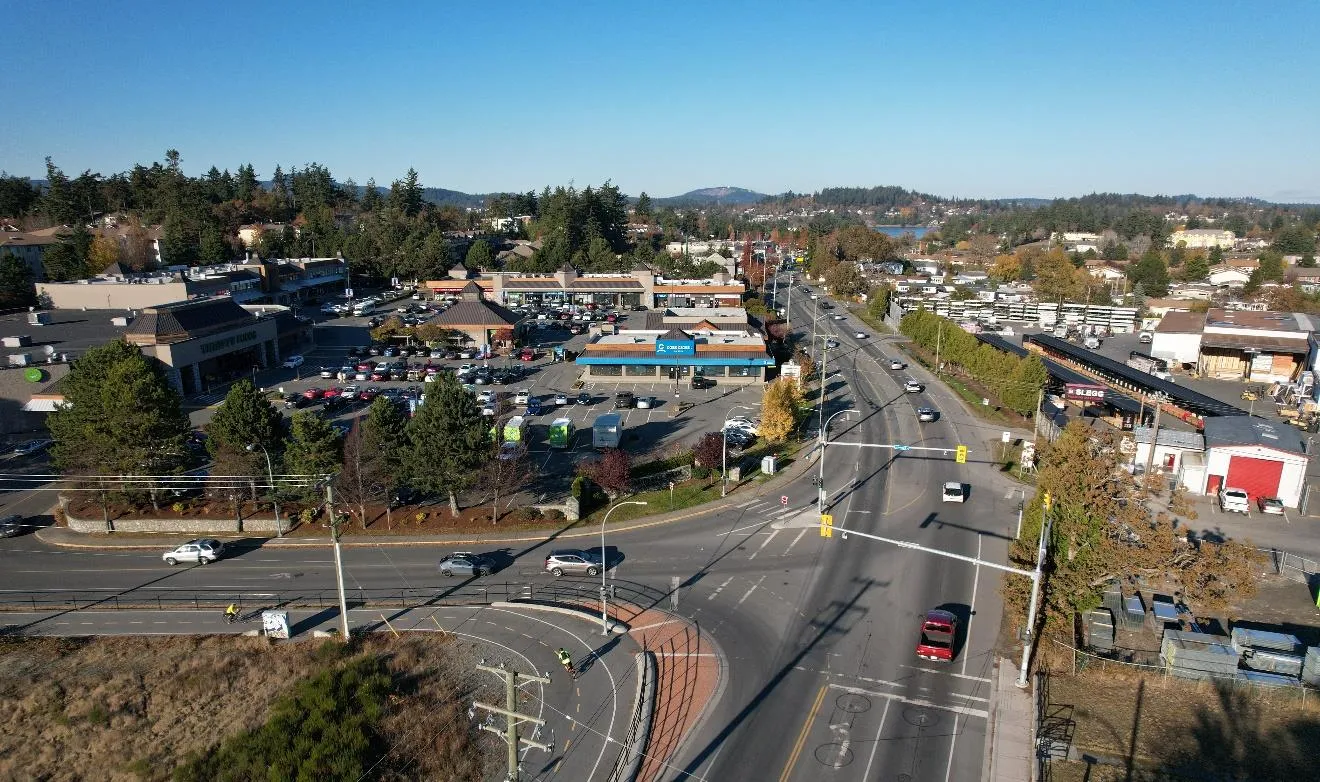
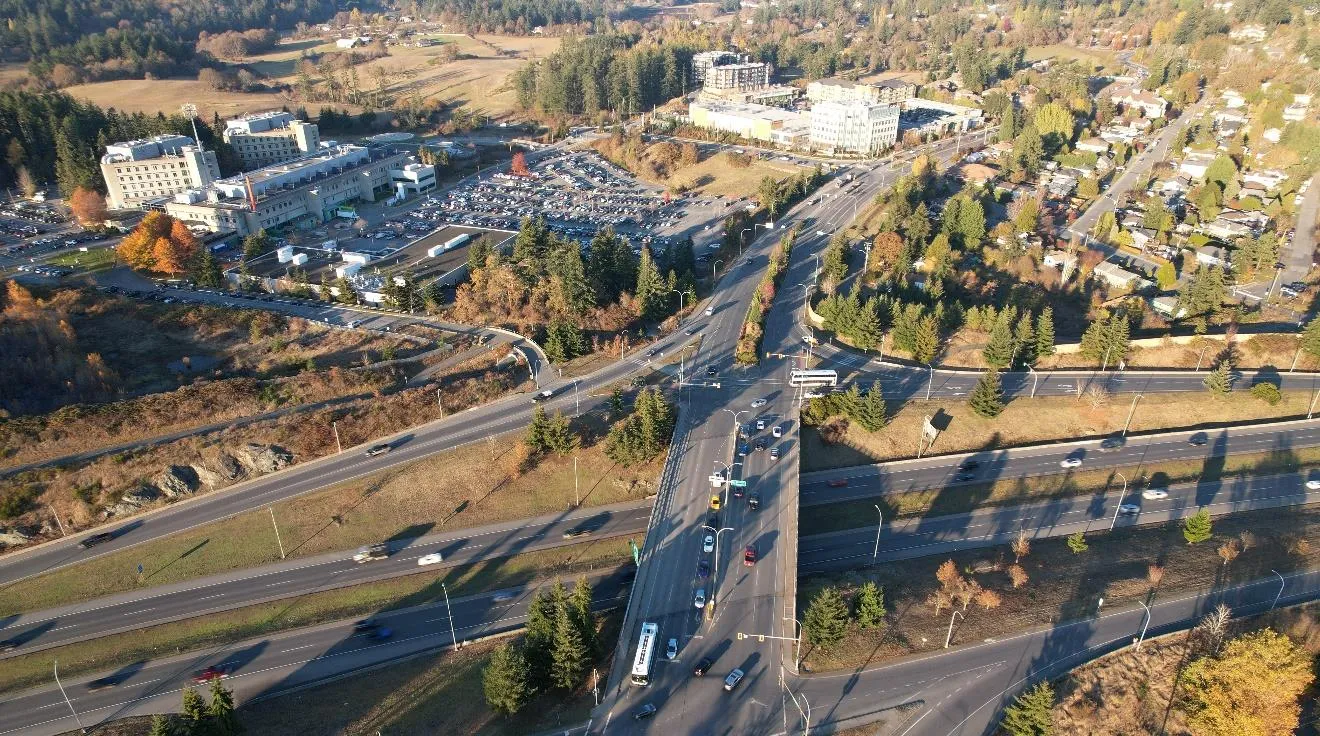
Therefore, the ATNP includes more detail on the short-term priority projects, which include a mix of critical corridor improvements and intersection improvement reviews. A total of 13 priority infrastructure projects are recommended with some being smaller and easier in scope and others more challenging and complex. The top three critical corridor improvement projects include: (1) Admirals Road (Island Highway to Hallowell Road); (2) Island Highway (E&N Rail Trail to Admirals Road); and (3) Helmcken Interchange (Vickery Road to Watkiss Way).
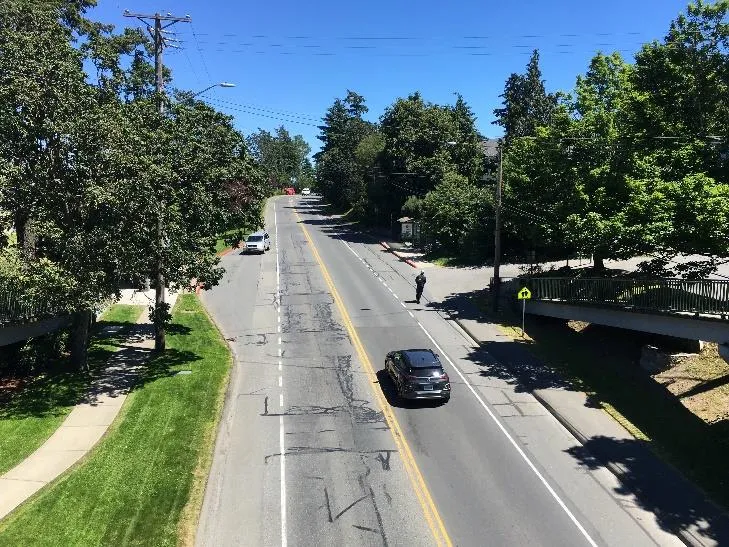
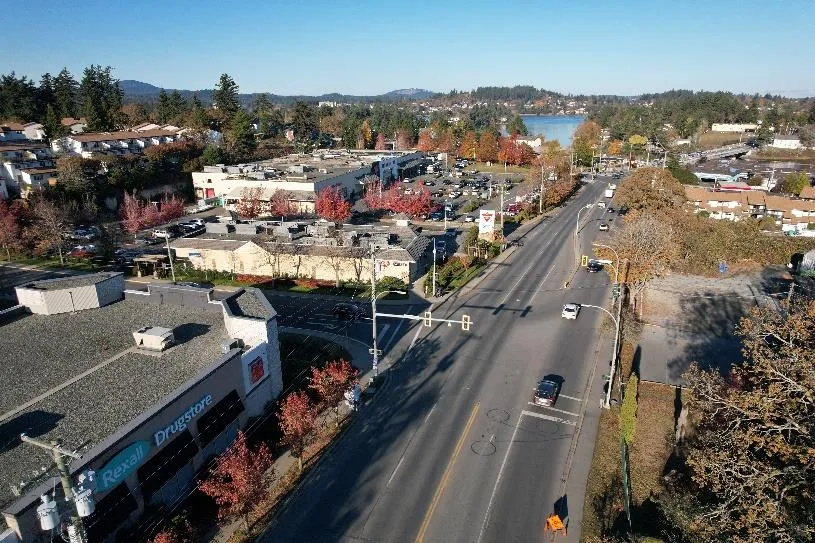
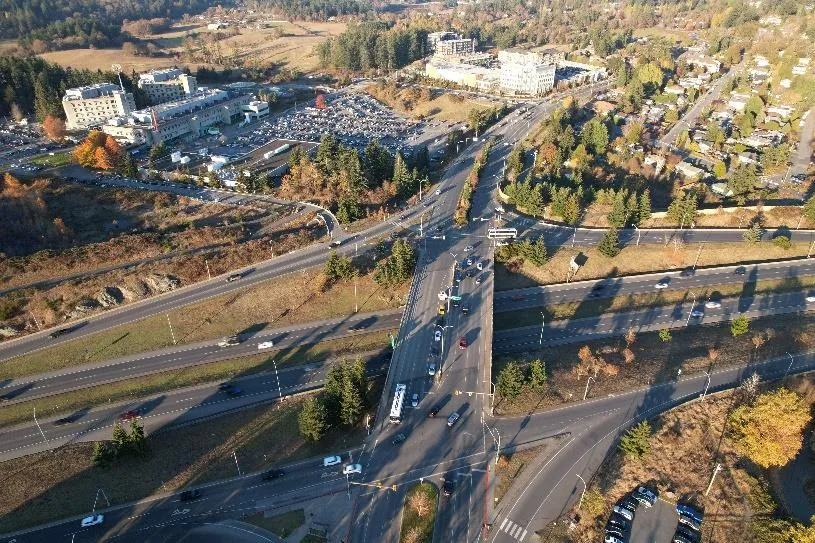
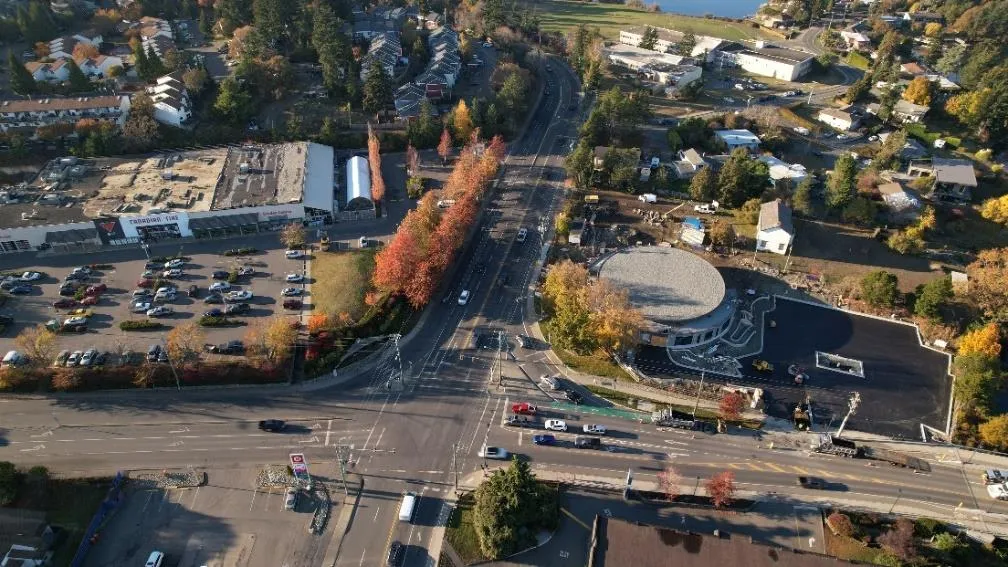
Aerial photo of Admirals Road corridor.Aerial photo of Helmcken Interchange.Aerial photo of Island Highway corridor.
*The three critical corridor improvements: Admirals Road (top left), Helmcken Interchange (top right), and Island Highway (bottom)*
In addition to the three critical corridor projects, 10 other short-term projects are recommended including a range of active transportation facilities. Highlights include multi-use pathway facilities on Six Mile Road, Talcott Road, Glentana Avenue, and Chancellor Avenue. Protected bike facilities are recommended on Watkiss Way and Helmcken Road (north of Watkiss Way). Sidewalk facilities are also recommended on some of the major corridors, where there are existing gaps including Burnside Road and Island Highway.
In addition, a total of 11 intersection reviews are recommended to help ensure that the Town does not lose sight of the importance of sound intersection design, which will help facilitate greater safety and accessibility for all ages and abilities at the intersections. Transit is also an important part of the active transportation experience and as such, recommendations for bus stop upgrades are also included in the ATNP.
Supporting Programs + Policies
In addition to the provision of appropriate infrastructure, a high-quality active transportation network must be supported by community programs, educational initiatives, amenities, maintenance, and policies to help facilitate culture change.
Several programs and policy / regulatory amendments are recommended, which include a bicycle parking retrofit program, dedicated staff to support the implementation of the ATNP, additional resources to maintain active transportation facilities, exploring a speed reduction establishment policy, and amendments to the Town’s zoning bylaw to include requirements for non-standard bicycle parking in new developments.
Implementation Strategy
The implementation strategy includes details on the cost estimates for the short-term projects, an overall action plan for each of the recommendations in the ATNP, the different funding opportunities available to pay for the facility improvements. A total of 37 actions are recommended. The total level of investment for the short-term infrastructure projects is approximately $11,013,200.
Page 122–150
Next Steps
The ATNP is a 10-year plan and must be treated as a living document. The Town will need to revisit it periodically to ensure it is following the ATNP vision and objectives / targets. The Town should update the plan in 5 years (2028) to revisit the short-term priority projects and continue to identify how it can improve active transportation options for the View Royal community.
Page 122–150
TABLE OF CONTENTS
1.0 INTRODUCTION.................................................................................. 2
1.1 What is Active Transportation? .........................................................3
1.2 Plan Process .....................................................................................5
2.0 COMMUNITY PROFILE ........................................................................ 7
2.1 Location ...........................................................................................7
2.2 Demographic Highlights....................................................................9
2.3 Transportation Mode Share ...............................................................9
2.4 Land Use + Key Destinations ...........................................................15
2.5 Equity.............................................................................................18
2.6 Planning and Policy Context............................................................19
2.7 Existing Active Transportation Facilities...........................................24
3.0 PUBLIC ENGAGEMENT ..................................................................... 31
3.1 Overview........................................................................................31
3.2 What Was Done .............................................................................31
3.3 What We Heard .............................................................................34
4.0 PLAN FRAMEWORK ......................................................................... 39
4.1 Vision.............................................................................................39
4.2 Objectives.......................................................................................39
5.0 FUTURE ACTIVE TRANSPORTATION NETWORK............................. 42
5.1 Network Analysis............................................................................42
5.2 Ultimate Network ...........................................................................43
5.3 Design Guidelines ...........................................................................52
5.4 Short-term Priority Projects ............................................................67
5.5 Supporting Programs + Policies ......................................................89
6.0 IMPLEMENTATION STRATEGY ....................................................... 107
6.1 Short-term Priority Capital Projects...............................................107
6.2 Action Plan...................................................................................109
6.3 Funding Opportunities ..................................................................114
7.0 NEXT STEPS ................................................................................... 118
Page 122–150
Section 1 – Introduction
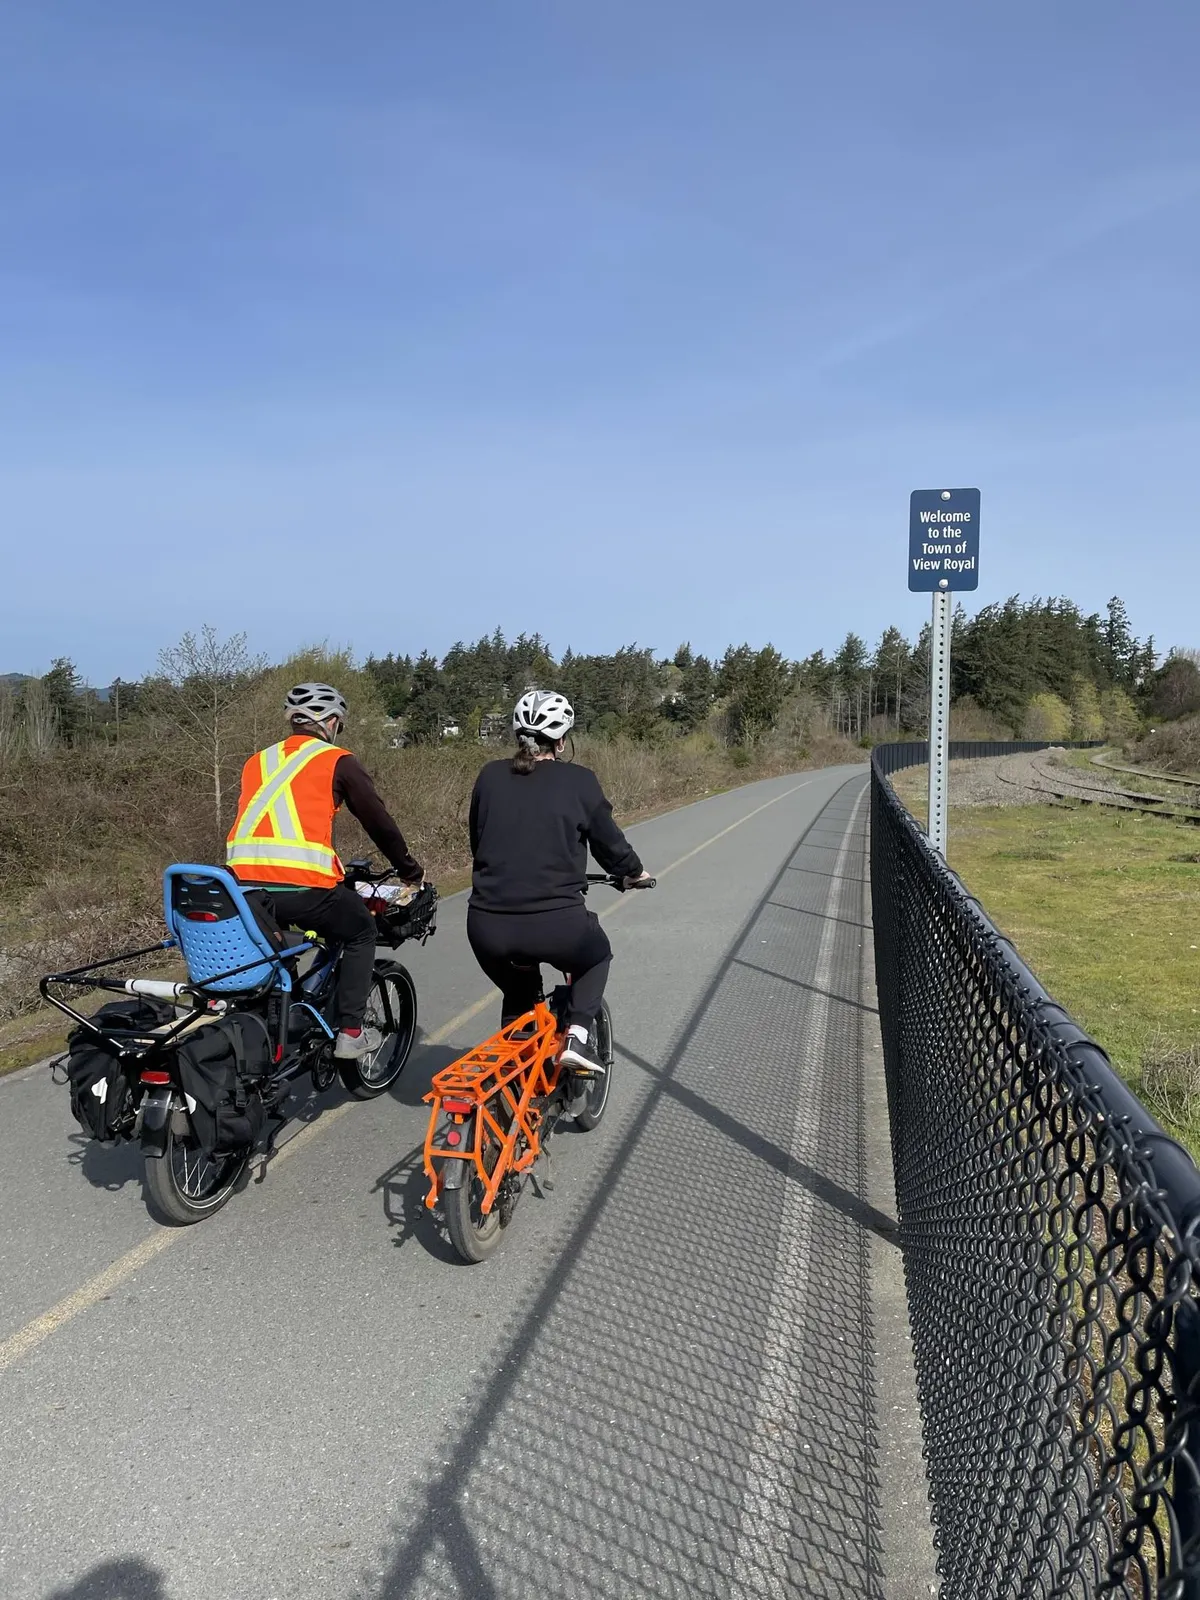
Two people riding electric cargo bikes along a paved multi-use trail next to a fence with a "Welcome to the Town of View Royal" sign.
Page 122–150
1.0 INTRODUCTION
The Town of View Royal is a vibrant and growing community located on southern Vancouver Island. The Town acts as a gateway between Victoria’s urban core and the West Shore municipalities. View Royal’s dynamic community has managed growth while retaining traditional neighbourhoods that are attractive, walkable, and safe with use of green space corridors and pedestrian/cyclist-friendly streets. Further, the Town has excellent proximity to regional trails and access to transit. That said, View Royal is in the process of shifting its mode share from single occupancy vehicle to more sustainable modes. The community has all the right pieces in place and the surrounding transportation context is conducive for advancing its sustainable transportation options while promoting development and supporting a growing community.
To optimize the environment for sustainable transportation, the Town has undertaken a comprehensive Active Transportation Network Plan (ATNP). The ATNP, once fully adopted, will further enhance the active transportation network to be safe, accessible, and convenient for all ages and abilities to support active, healthy lifestyles and reduce greenhouse gas (GHG) emissions.
The purpose of the plan is to identify gaps and opportunities within the existing network, and map out measurable objectives and targets, a vision, and priorities to pursue a conducive environment for active transportation in View Royal. The implementation strategy provides a guide to help the Town implement the recommended actions and work toward meeting the vision and objectives outlined in this plan.
The ATNP has a 10-year planning horizon. The Town should revisit the ATNP in 5 years (2028) to see how well it is meeting the plan objectives and targets, and whether any of the short-term priorities need to be revisited.
1.1 What is Active Transportation?
The BC Active Transportation Design Guide (BCATDG) provides a detailed overview of active transportation and its associated benefits. Drawing from Chapter B, the guide defines active transportation as:
“Any form of human-powered transportation, including walking, cycling, or rolling using a skateboard, in-line skates, wheelchair, or other wheel-based forms of human-powered transportation. It also includes winter-based active modes, water-based active modes, and horseback riding, although these modes are typically more recreational in nature.”
Active transportation users are a diverse group and include those who are walking, cycling, rolling (e.g., skateboarding, longboarding, scootering) and people using mobility devices such as wheelchairs, walkers, and strollers. All of these forms of human-powered travel pursued for a variety of reasons: some people may choose to walk for recreation, others may bike to work, some may use active transportation due to the lack of a personal vehicle, and others may be choosing to travel this way because of the environmental benefits. The reasons to travel by an active mode are multi-fold and so are the benefits, discussed below.
Icon of a person walking.Icon of a person cycling.Icon of a person in a wheelchair.Icon of a person on a scooter.
WHAT IS ALL AGES AND ABILITIES?
‘All ages and abilities’ has become a buzz word in transportation planning and is often not well defined. Building on the definition of the National Association of City Transportation Officials (NACTO), many existing bicycle facilities do not feel safe for people who might otherwise ride. Designing for all ages and abilities must consider the safety, comfort, unique circumstances, and needs of a broad range of potential users including children, seniors, women, racialized communities, persons with a disability, and people moving people, cargo and goods.
Benefits of Active Transportation
Environmental Benefits: The Town’s draft OCP outlines goals toward reducing greenhouse gas (GHG) emissions, with the long-term target of a reduction of 100% below 2007 levels by 2050. Currently, passenger vehicles are responsible for 45% of the GHG emissions generated from residents and businesses in View Royal. Active transportation can cut GHG emissions and air pollution and is a critical part of lowering overall emissions in the Town’s transportation sector.
Economic Benefits: There are diverse economic benefits of active transportation. Neighbourhoods and destinations that are more accessible and attractive for people using active modes can attract more visitors and tourists, who contribute to the local economy. Using active transportation as the main way of getting around is also more economical compared to driving a vehicle.
Health Benefits: A number of academic papers and technical reports have found that active transportation is associated with healthier communities. This includes physical health, by lowering the risk of early death and chronic diseases including obesity and cardiovascular issues, along with mental health benefits.
Societal Benefits: Active transportation facilities can help make a community more accessible, affordable, and equitable. It can encourage social interactions and create opportunities for face-to-face meetings, helping build trust, respect, understanding, and a sense of community.
Safety Benefits: Active transportation facilities that are well-designed enhance the overall visibility of active transportation users, helping to reduce the risk of collisions and fatalities, in addition to reducing the number of vehicles on the road. This can create a safer transportation system for all road users.
1.2 Plan Process
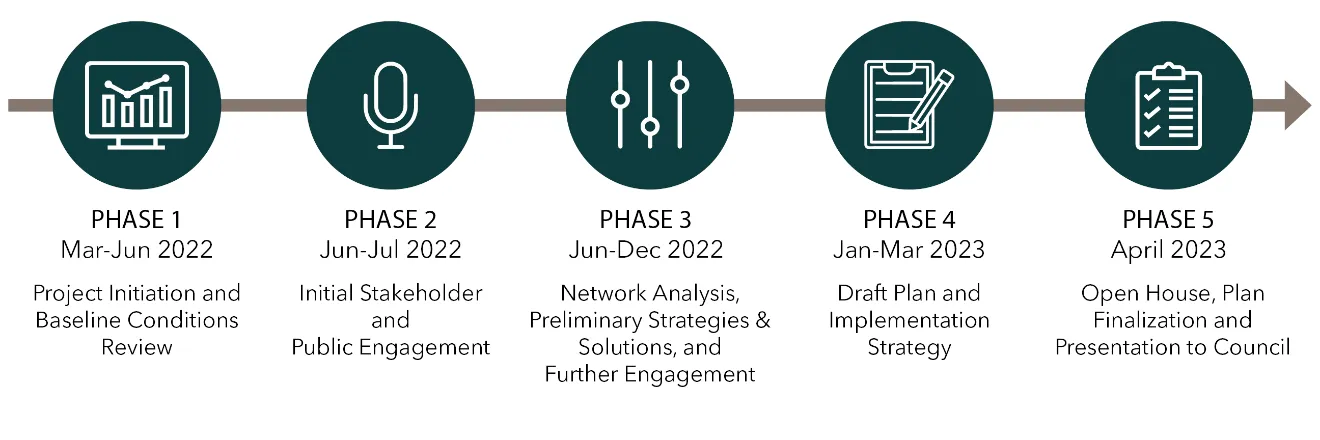
The View Royal Active Transportation Network Plan launched in March 2022. The year-long process was highly collaboratively involving the Town of View Royal, the consulting team, relevant stakeholders, and community members to create a multi-faceted plan that reflects the voices of the community and experts in the field to reshape the future of active transportation in View Royal. The plan was developed in five phases, as shown below:
Phase 1 – Network Summary & Baseline Conditions Assessment involved reviewing relevant Town policies, existing data, collecting data where gaps exist, assessing existing active transportation conditions, and development of materials that will be utilized throughout the project.
Phase 2 – Initial Stakeholder and Public Engagement involved online and in-person engagement to understand the current strengths, challenges, and opportunities of the active transportation, while informing and educating the public to shape the overall network vision, direction, and goals.
Phase 3 – Network Analysis & Preliminary Strategies and Solutions involved identifying potential improvements and detailing the future network and design recommendations.
Phase 4 – Draft Plan was developed after receiving feedback from the public and staff on the draft network options.
Phase 5 – Plan Finalization occurred after the public Open House and presentation to Town Council.
Page 122–150
Timeline diagram titled "Figure 1. ATNP Project Phases and Timeline". Phase 1: Mar-Jun 2022 (Project Initiation and Baseline Conditions Review); Phase 2: Jun-Jul 2022 (Initial Stakeholder and Public Engagement); Phase 3: Jun-Dec 2022 (Network Analysis, Preliminary Strategies & Solutions, and Further Engagement); Phase 4: Jan-Mar 2023 (Draft Plan and Implementation Strategy); Phase 5: April 2023 (Open House, Plan Finalization and Presentation to Council).
Page 122–150
Section 2 – Community Profile
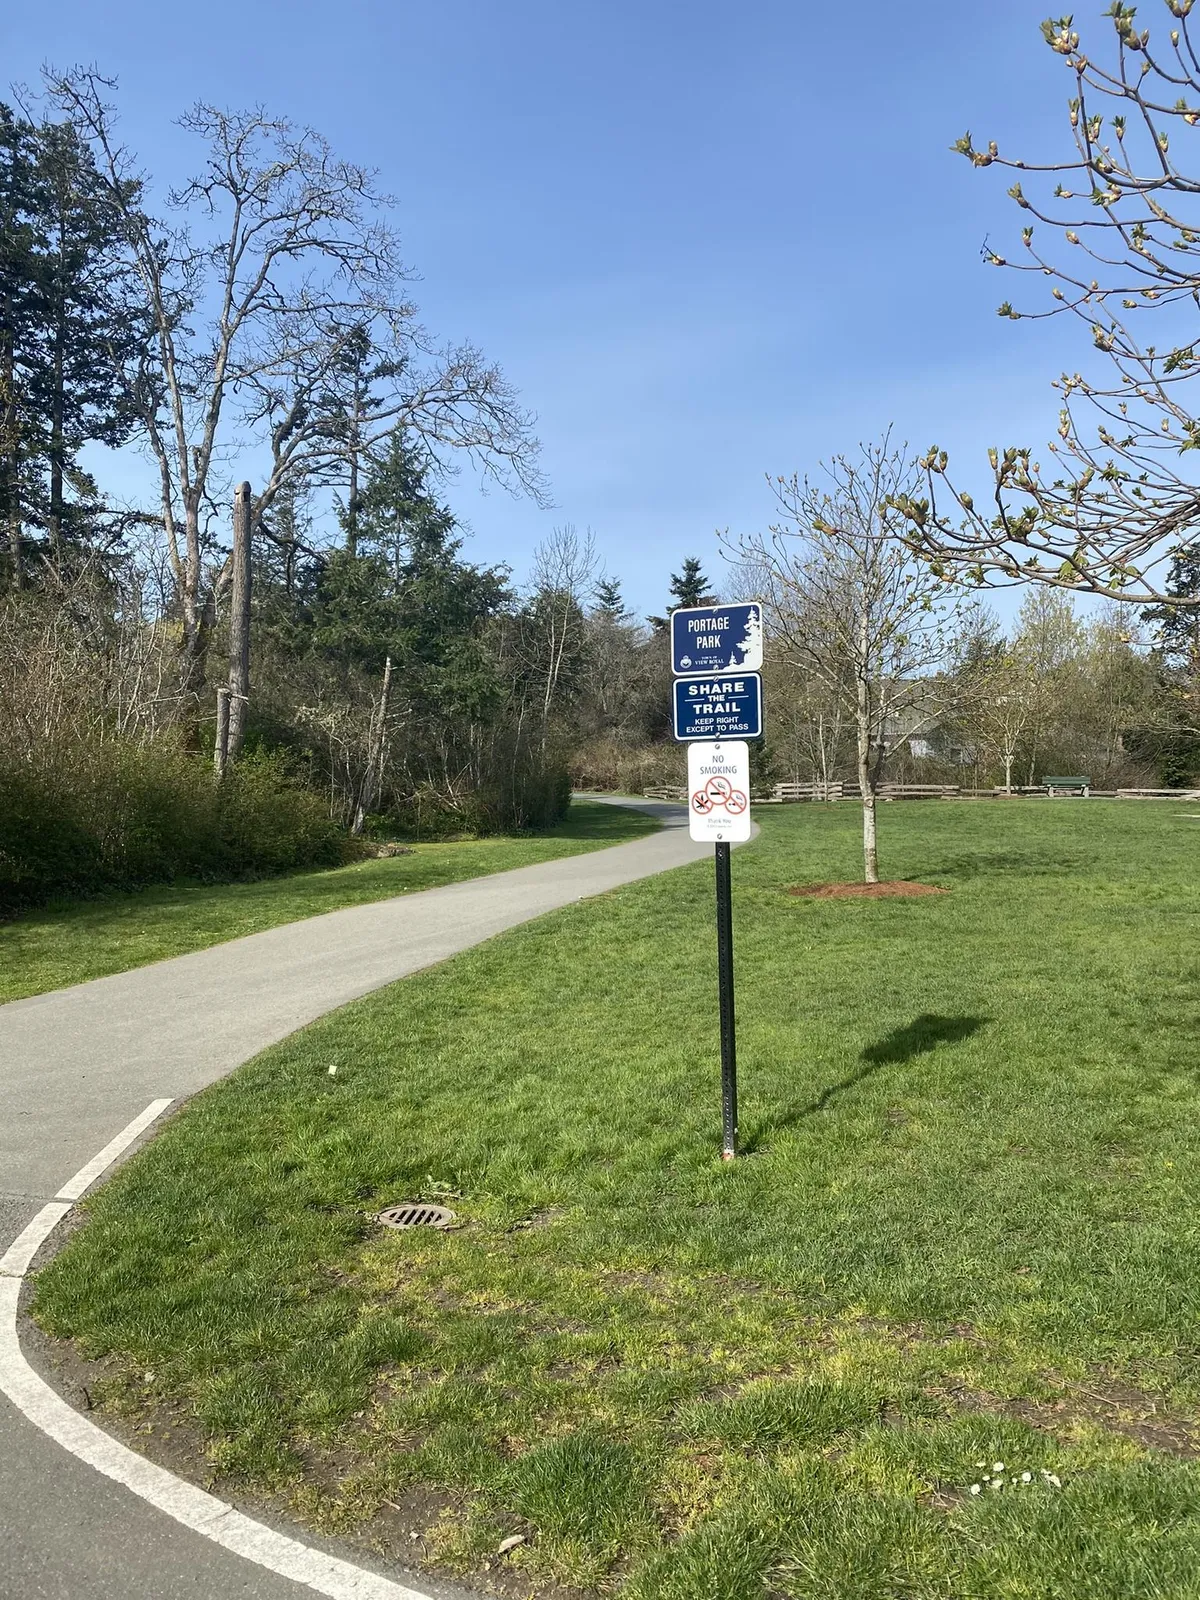
A paved multi-use trail winding through a grassy park area with trees and signs for "Portage Park" and "Share the Trail".
Page 122–150
2.0 COMMUNITY PROFILE
2.1 Location
The Town of View Royal is situated on the traditional territory of the Lekwungen speaking people and is located on the unceded territory of the Esquimalt and Songhees Nations. Nestled between several other jurisdictions such as Esquimalt, Saanich, Langford, Colwood, Highlands, and the Esquimalt and Songhees First Nations; View Royal is a dynamic and inclusive community covering 14.33km² of land area with a population density of 807.6 persons per square kilometre.
The Town benefits from access to nature, parks, and many natural amenities. Its land use is centred around three major transportation corridors – Highway 1 (Trans-Canada), the Island Highway, and the E&N (Esquimalt and Nanaimo) rail corridor. All three corridors contribute to View Royal’s importance in the regional transportation system and with two major regional trails traversing the Town, it is a popular destination for active transportation.
Map 1 illustrates the geographic boundaries of the Town.
[Map: Map 1 - Town of View Royal Context Map showing municipal boundaries, parks like Thetis Lake Regional Park and Mill Hill Regional Park, and neighboring municipalities Saanich, Langford, Colwood, Highlands, and Esquimalt.]
2.2 Demographic Highlights
As of the 2021 Statistics Canada Census, the Town had a population of 11,575 citizens. This represents a population increase of 11% from the 2016 census, indicating that the community continues to grow. This population increase is slightly higher than what was recorded across the Capital Regional District, which grew by 8% over this time.
The Town’s median age is 44.8 years old, which is similar to the median age in the CRD (45.5 years old). Approximately 67% of the population is between the age of 15 to 64 years old, which is the age group that is most expected to use high-quality active transportation facilities and will have the easiest time shifting away from single occupancy vehicles. Of that 67%, 30% are under the age of 30, which is the most likely age group to rely on active transportation.
2.3 Transportation Mode Share
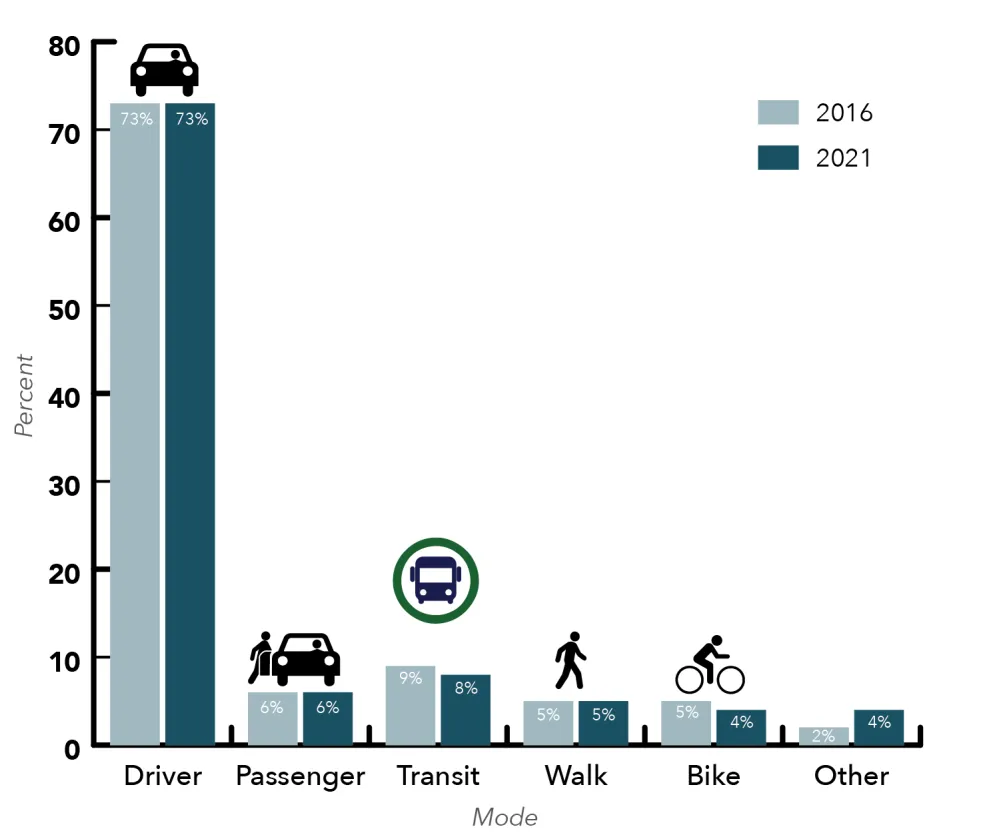
According to 2021 Statistics Canada journey to work data, most residents used a vehicle to commute to work, either as driver or passenger (79%). A combined 18% of residents used active transportation modes (i.e., cycling, walking, transit). Increasing from 2% in 2016, approximately 4% of residents use other modes (i.e., school bus, HandyDART, taxi, scooter etc.). Public transit (8%) was second highest in journey to work mode share followed by walking (5%) and cycling (4%). Between 2016 and 2021, the percentage of residents commuting to work by vehicle remained the same, whereas active modes of walking, cycling and transit decreased by 1%.
The data from 2021 shows that only 21% of employed residents work within the Town, while the remaining 79% work outside of View Royal. This indicates that active transportation network planning cannot be done in isolation—the Town must work with neighbouring municipalities to ensure there are safe and direct connections.
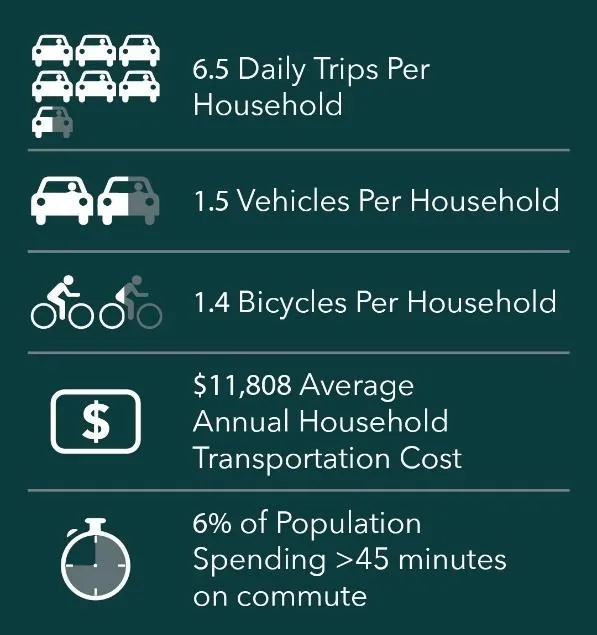
Infographic of transportation stats: 6.5 Daily Trips Per Household, 1.5 Vehicles Per Household, 1.4 Bicycles Per Household, $11,808 Average Annual Household Transportation Cost, 6% of Population Spending >45 minutes on commute.Bar chart titled "Figure 2 – View Royal Journey to Work Mode Share, 2016 vs. 2021". Modes compared are Driver (73% in both years), Passenger (6% in both years), Transit (9% to 8%), Walk (5% in both years), Bike (5% to 4%), and Other (2% to 4%).
It must be noted that mode share data from 2016 is more representative of current conditions compared to data collected from the most recent census in 2021. The 2021 data represents the heightened impacts from COVID-19, which is not indicative of current transportation trends that involve more work, school, and leisure related travel. However, the journey to work data from 2021 shows similar trends in most residents using a vehicle to commute to work, followed by public transit, with active modes being the least common travel method to work.
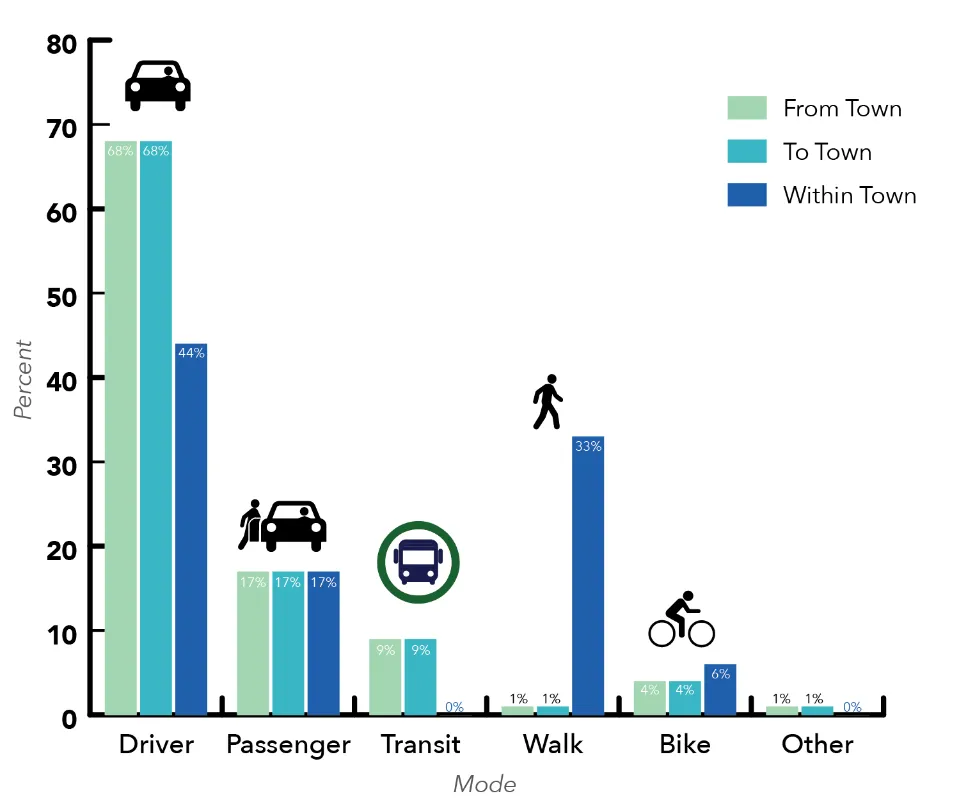
The 2017 CRD Origin-Destination Household Travel Survey provides data on resident travel patterns throughout the Capital Regional District. The survey reported that approximately 53,100 trips are made within View Royal per day. Of those trips only approximately 5,770 (or 11%) are made internally within the Town, while the remaining trips are going to or coming from other Districts. Figure 3 provides a summary of the mode split for all trips taken to, from, and within View Royal.
Bar chart titled "Figure 3 – Mode Split by Travel Mode (2017)" categorized by From Town, To Town, and Within Town. Shows high vehicle driver usage (68% to/from, 44% within) and walking as a significant mode for trips within Town (33%).
A summary of View Royal’s mode share trends from the CRD Origin-Destination Household Travel Survey are as follows:
Vehicle mode share is the highest among all modes but is significantly lower for trips within the Town.
Transit mode share is less than 1% within the Town but is around 9% for trips to and from View Royal.
Bicycle mode share is between 4%-6% for all travel destinations.
33% of users walk for trips within the Town, which is the second highest mode share for trips within the Town (after auto driver).
Overall, use of active transportation is highest within the Town (39%); however, there is only a small subset of people that travel within the Town (5,770 trips out of 53,100 trips total).
A 2020 Housing and Transportation Cost Estimate Study conducted by the CRD found that the average household in View Royal spends $11,808 on transportation per year, which is one of the highest among Core municipalities (Esquimalt, Oak Bay, Saanich, Victoria, View Royal). However, average household transportation costs in View Royal are still lower than many of the other municipalities within the West Shore and Saanich Peninsula (see Table 1).
As concluded in the CRD study, higher transportation costs are largely a product of vehicle ownership and costs are lower in geographies where a broader choice of transportation options are available. The data show that the number of vehicles owned has a proportionate impact on transportation costs. Although there does not appear to be a correlation between household bicycle ownership and transportation costs, developing a robust active transportation network with safe routes can make it easier for residents to be less reliant on their vehicles.
Table 1 – Household Transportation Profiles
Jurisdiction
Vehicles per Household
Bicycles Per Household
Avg. Annual Household Transportation Cost
Victoria
1.08
1.13
$7,921
Esquimalt
1.20
1.14
$8,730
View Royal
1.54
1.35
$11,808
Oak Bay
1.60
1.54
$12,115
Saanich
1.67
1.48
$12,294
Average (Core)
1.44
1.33
$10,573
Average (Saanich Peninsula)
1.97
1.54
$14,953
Average (Westshore)
2.12
1.55
$16,375
Overall, between 2011 to 2017, active transportation trips increased in the Town. Whether its trips to, from, or within the Town, the data indicate that active transportation mode share increased by 5-6% (see Table 2).
Table 2 – Active Transportation Trips 2011 vs 2017
Year
Active Transportation Mode Share (from Town)
Active Transportation Mode Share (to Town)
Active Transportation Mode Share (within Town)
2011
9%
10%
34%
2017
15%
15%
39%
With this change the number of vehicles per household has decreased from 2011 to 2017 from 1.7 to 1.5. The following is a summary of mode split trends for View Royal compared to other municipalities within the Core, for trips that take place within each municipality.
Page 122–150
Car icon Similar to Esquimalt and Oak Bay, 61% of residents travel by car
Bus icon Lowest transit use compared to all other Core communities (9%)
Second highest mode split for bicycle use (6%), following Victoria (9%)
33% of residents travel by foot: similar to Esquimalt and Oak Bay
2.4 Land Use + Key Destinations
As a compact community, most residents live within a short distance to key destinations. The View Royal ATNP Baseline Conditions Report included a detailed list of the major land uses and key destinations in the Town. Many of the current and future land uses that support active transportation trips are shown in Schedule K (Community Development Framework) of the Town’s OCP.
Furthermore, the Town will be updating their OCP soon, and it is anticipated that the updated OCP will include new land use designations that can help inform active transportation network planning.
Admiral’s Walk (top) and Eagle Creek Village (bottom) are some of the top destinations among View Royal residents
[Map: Map 2 - Land Use + Key Destinations showing commercial areas, mixed-use, schools, parks, and high-density residential areas across View Royal, with markers for key sites like Victoria General Hospital, Town Hall, shopping villages, and various schools.]
2.5 Equity
Over the last 10 years, equity has become a more prominent part of active transportation planning in North America. The BC Active Transportation Design includes equity as one of the key guiding principles for inclusive mobility. It provides the following definition:
Equity as it relates to transportation refers to the distribution of impacts (benefits and costs) and whether the distribution of impacts is considered fair and appropriate. Equity impacts can include the quality of available transportation choices, indirect and external costs, transportation expenditures, and public resource allocation, among others. Well designed and maintained facilities make access to transportation more equitable by allowing active modes to travel safely and comfortably.
Even though equity is becoming more commonplace in active transportation planning, Canadian municipalities are still trailing their US counterparts. In the US, several publications and guidelines have been produced on the topic of active transportation and equity including a 2015 report called “At the Intersection of Active Transportation and Equity”, which outlines how various US cities are addressing equity challenges within their transportation networks.
The View Royal ATNP Baseline Conditions Report included a more detailed analysis of the relevant transportation equity indicators in the Town.
WHAT IS EQUITY?
Equity as it relates to transportation refers to the distribution of impacts (benefits and costs) and whether the distribution of impacts is considered fair and appropriate.
-BC Active Transportation Design Guide
2.6 Planning and Policy Context
The Town, neighbouring communities and overall region have several planning and policy documents that have direct relevance to active transportation, summarized below.
Plan
Relevance to ATNP
Town Documents
Strategic Plan (2019-2022)
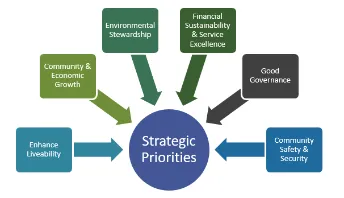
Sets a target of achieving 25% of all trips to work and school by walking, cycling, and transit.
Official Community Plan
Builds on the Strategic Plan and highlights the need to create policies that promote walking, cycling, and transit. The Town of View Royal will be updating their OCP soon. It is anticipated that the OCP update will further emphasize the need for active transportation policies.
Community Climate Action Strategy (2022)
The strategy identifies the significant impact of the transportation sector on GHG emissions. It envisions a zero-emission transportation system that connects View Royal with the region and aligns with provincial mode share targets. It calls for streets to be redesigned prioritize the needs of people walking, biking, and rolling more.