Cool it! Program Final Report 2024/25 - BC Sustainable Energy Association
A final reporting document summarizing the results of climate leadership training delivered to schools within the CRD.
Final Report 2024/25
Executive summary
The Capital Regional District, District of Saanich, City of Victoria, District of Central Saanich, District of Oak Bay and the District of Sooke and Town of View Royal collectively provided generous support to the BC Sustainable Energy Association’s (BCSEA) Cool It! Climate Leadership Training Program (The Cool It! Program) enabling the delivery of the program to up to 78 elementary classes and 35 high school classes in the CRD throughout the 2024/25 school year.
During 2024/25, the Cool It! Program was delivered to 118 classes (86 elementary and 32 high school). Of these, seven elementary and three high school classes were funded via separate funding sources enabling delivery to additional classes in oversubscribed areas. In total, the program reached 2,742 students (1,980 elementary and 762 high school students). Students collectively completed more than 17,000 actions focused on climate change and sustainability.
Based on feedback collected in recent years from schools and teachers, The Cool It! Program continues to offer the option of both in-person or virtual workshop delivery. As in previous years, the decision on the most appropriate delivery method for each class was left in the hands of participating teachers. The four-week Cool It! Climate Challenge encouraged students to choose from a variety of actions that would reduce theirs and their family’s carbon and ecological footprints. It also provided opportunities for further investigation and reflection about issues related to climate change and sustainability as well as highlighting avenues for participation in local community action and programs.
Qualitative and quantitative data was collected from student actions prompted by their participation in the Cool It! Climate Challenge. Through energy conserving and emissions saving actions at home, along with research and inquiry activities, we expect CRD student actions, completed in 2024/25, to result in an estimated annual saving of a total of 500 tonnes of carbon dioxide emissions (CO2e) if they commit to maintain their actions for one year.
The 2024/25 program curriculum
BCSEA has developed a unique program curriculum for both elementary and high school classes. This includes the content covered in workshops, actions provided in the climate challenge, and the format and language in which those actions are presented. For both curriculums, a climate workshop (two in the case of high school classes) and participation in a four-week climate challenge comprise the main components of the program.
Workshops
During 2024/25, BCSEA is offering teachers the option of participating in an in-person or virtual workshop — depending on which mode of learning best suits their class. Each elementary class participated in a 60-minute workshop at the beginning of the program and a 30-minute wrap-up session after completing their four-week climate challenge. Each high school class participated in two 60-minute workshops, spaced roughly two weeks apart.
In the workshops, all students learnt about the fundamentals of climate change science, debunked common climate myths and misconceptions, watched videos detailing the scientific processes of climate change, practiced evaluating the production and consumption life cycle of everyday items, explored the causes, impacts and solutions to climate change, and learnt about taking climate action with their friends and families and in their local communities. High school classes used their second workshop to explore more advanced concepts related to climate science and the public and private solutions being developed. As well as discussing concepts of climate justice and the social and economic impacts of climate change, both locally and globally.
After four weeks, a wrap-up session was held with each class to share their successes and challenges, recap the key messages and learnings from the workshop and celebrate their collective results.
Climate Challenge
After their initial workshop, students participated in the Cool It! Climate Challenge for the next four weeks.
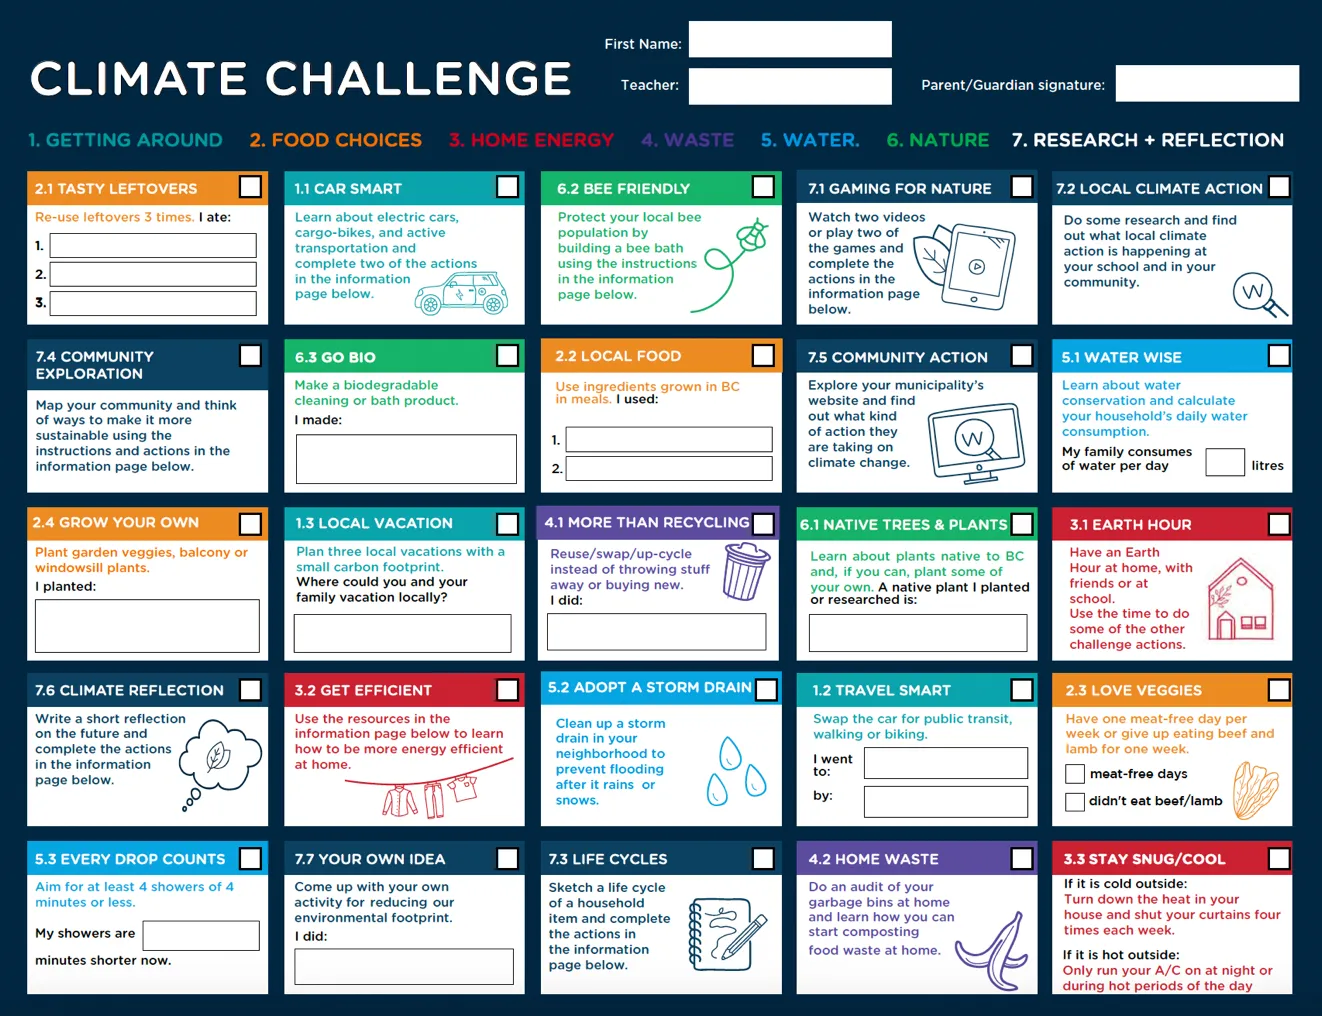
Elementary students were given a Climate Challenge Card - an interactive PDF document containing 25 unique actions that could be used digitally or printed out and completed by hand. When an action is completed, students check-off the corresponding square on the card as well as enter additional answers and information where required. A 15-page supplementary booklet was also provided, which offered additional information about each action, extra support to complete it, and opportunities for optional further research and investigation alongside additional resources.
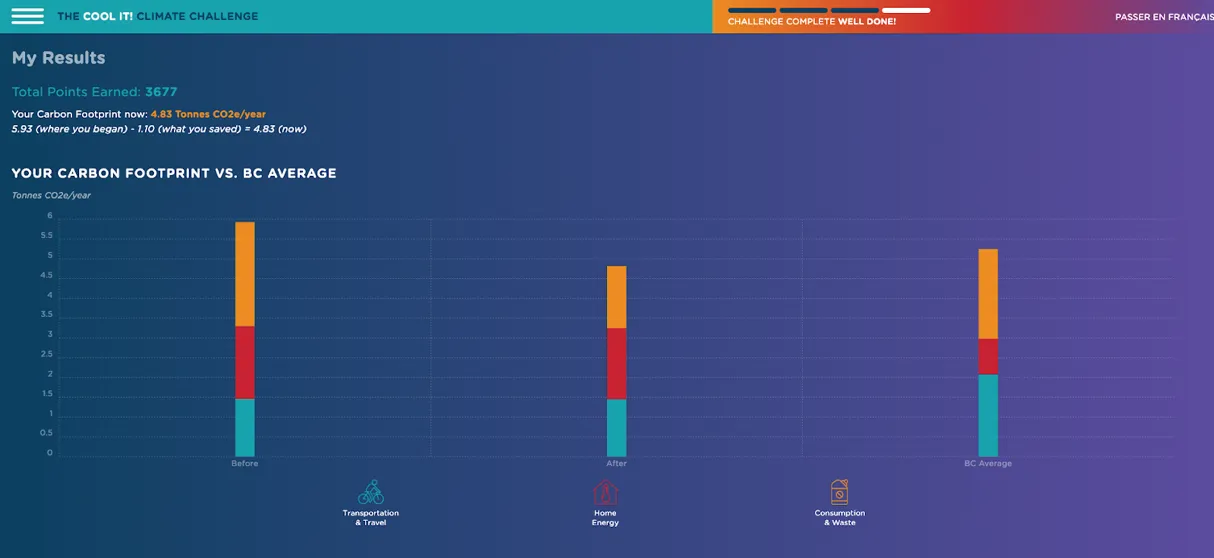
High school students registered on BCSEA’s online platform climatecool.org. The platform guided each student through weekly action-taking. Students completed a simple quiz when registering to determine a baseline CO2e footprint for them and their family. This footprint was then dynamically recalculated at the end of each week to reveal the impact of their actions on their initial footprint. Like the elementary challenge, the climatecool.org platform provided high school students with additional, locally relevant resources and information and encouraged them to extend their research, investigation, and action-taking beyond the challenge itself.
Traditionally, the Cool It! Program focuses on gathering quantitative data through the collation of completed actions and measuring outcomes (where possible) in carbon dioxide emissions savings. While some actions yielded a quantifiable emissions reduction, other actions yielded qualitative results through individual reflection, personal investigation, and research.
The elementary Climate Challenge Card used in the CRD during 2024/25:
Example of a high school student’s results page on climatecool.org:
CRD and partner municipality funded classes
Program results
CRD and partner municipality funding, in collaboration with additional sources, has enabled BCSEA to work with 118 classes and 2,742 students in 2024/25. Students’ actions through their participation in the Cool It! Climate Challenge resulted in an estimated total reduction of 500 tonnes of greenhouse gas emissions (tCO2e).
- 118 classes (86 elementary, 32 high school)
- 2,742 students (1,980 elementary, 762 high school)
- 17,139 actions (12,875 elementary, 4,264 high school)
- 499.7 GHG savings (tCO2e) (350.8 elementary, 148.9 high school)
The Climate Challenge return rate among all participating students (the proportion of students who returned a completed climate challenge form or maintained an active account on climatecool.org) was 70% - well above our program-wide average of ~65%. Almost every class that participated in our workshop curriculum were able to progress on to our take-home materials. Of the 118 classes who participated in Cool It! in 2024/25, 96 completed over 100 cumulative actions each, with 20 completing more than 200.
Overall, results across the CRD continue to constitute some of the most consistent levels of student engagement throughout our entire program. A measure made more impressive by the scale of delivery now achieved annually across the region. This is a credit to the ongoing interest on the part of schools, teachers and parents in supporting climate change education in their communities.
Elementary summary
| Region | # classes | # students | # Cards returned | Return Rate (%)* | Total actions completed | GHGs avoided |
|---|---|---|---|---|---|---|
| City of Victoria | 13 | 274 | 180 | 66% | 1,615 | 47.8 |
| District of Saanich | 37 | 875 | 582 | 67% | 5,700 | 155.6 |
| West Shore | 7 | 171 | 111 | 65% | 868 | 22.2 |
| Town of View Royal | 2 | 42 | 26 | 62% | 292 | 7.6 |
| District of Sooke | 4 | 88 | 60 | 68% | 587 | 16.4 |
| Core | 4 | 92 | 60 | 65% | 533 | 13.9 |
| District of Oak Bay | 5 | 108 | 87 | 81% | 895 | 25.6 |
| District of Central Saanich | 4 | 94 | 71 | 76% | 952 | 25.3 |
| Peninsula & Electoral Areas | 3 | 69 | 56 | 81% | 439 | 10.7 |
| Additional classes | 7 | 167 | 111 | 66% | 994 | 25.8 |
| Total | 86 | 1,980 | 1,344 | 68% | 12,875 | 350.8 |
* % of students who returned a completed Climate Challenge Card
High School summary
| Region | # classes | # students | # Cards returned | Participation Rate (%)* | Total actions completed | GHGs avoided |
|---|---|---|---|---|---|---|
| City of Victoria | 6 | 138 | 107 | 78% | 791 | 31.2 |
| District of Saanich | 13 | 328 | 258 | 79% | 1,841 | 58.0 |
| West Shore | 3 | 60 | 51 | 85% | 372 | 15.0 |
| District of Sooke | 2 | 36 | 27 | 75% | 254 | 8.3 |
| Core | 2 | 44 | 30 | 68% | 202 | 6.6 |
| District of Oak Bay | 1 | 21 | 12 | 57% | 140 | 5.6 |
| District of Central Saanich | 1 | 23 | 12 | 52% | 98 | 3.9 |
| Peninsula & Electoral Areas | 1 | 27 | 20 | 74% | 129 | 3.2 |
| Additional classes | 3 | 62 | 49 | 79% | 339 | 13.2 |
| Total | 32 | 782 | 578 | 76% | 4,264 | 148.9 |
* % of students who activate an account on climatecool.org
City of Victoria
Elementary
| School name | Teacher name | Grade | Class size | # Cards returned | Return Rate (%) | Total actions completed | GHG totals per class |
|---|---|---|---|---|---|---|---|
| Margaret Jenkins Elementary | Paula Humby | 4/5 | 25 | 22 | 88% | 237 | 7.0 |
| Selkirk Montessori | Chelsea Thomson | 4 | 14 | 10 | 71% | 76 | 2.7 |
| Selkirk Montessori | Becca Leier | 4 | 13 | 8 | 62% | 65 | 2.5 |
| South Park Elementary | Kelly Dodds | 4/5 | 22 | 10 | 45% | 102 | 3.3 |
| South Park Elementary | Jacqueline Czar | 4/5 | 22 | 15 | 68% | 117 | 3.8 |
| South Park Elementary | Morgan Holmes | 4/5 | 22 | 14 | 64% | 138 | 2.8 |
| Oaklands Elementary | Debbie Walasek | 3/4 | 20 | 15 | 75% | 119 | 3.4 |
| École Beausoleil | Marie-Claude Carrier | 5 | 21 | 16 | 76% | 202 | 6.1 |
| Margaret Jenkins Elementary | Joanna Lake | 4/5 | 24 | 19 | 79% | 121 | 3.6 |
| Margaret Jenkins Elementary | Kas Lafleur | 4/5 | 26 | 12 | 46% | 112 | 3.1 |
| Oaklands Elementary | Kim Scott-Moncrieff | 3/4 | 20 | 13 | 65% | 136 | 3.8 |
| Oaklands Elementary | Debbie Durrance | 3/4 | 20 | 11 | 55% | 87 | 2.8 |
| Sir James Douglas Elementary | Sylvie Archambault | 4/5 | 25 | 15 | 60% | 103 | 2.9 |
| Total | 274 | 180 | 66% | 1,615 | 47.8 |
Bold text indicates 2024/25 class winner
High School
| School name | Teacher name | Discipline | Grade | Class size | # active accounts | Participation Rate (%) | Total actions completed | GHG totals per class |
|---|---|---|---|---|---|---|---|---|
| Victoria High School | Chelsey Minter | Social Studies | 10 | 24 | 16 | 67% | 188 | 7.5 |
| Victoria High School | Chelsey Minter | Social Studies | 10 | 24 | 17 | 71% | 144 | 5.8 |
| Victoria High School | Chelsey Minter | Social Studies | 10 | 24 | 16 | 67% | 29 | 1.2 |
| Victoria High School | Shawna Cheyne | French | 9 | 22 | 20 | 91% | 168 | 6.7 |
| Victoria High School | Shawna Cheyne | French | 9 | 22 | 20 | 91% | 151 | 6.1 |
| Victoria High School | Shawna Cheyne | Science | 9 | 22 | 18 | 82% | 111 | 3.9 |
| Total | 138 | 107 | 78% | 791 | 31.2 |
District of Saanich
Elementary
| School name | Teacher name | Grade | Class size | # Cards returned | Return Rate (%) | Total actions completed | GHG totals per class |
|---|---|---|---|---|---|---|---|
| Arbutus Global Middle School | Stéphane Tran | 7 | 18 | 14 | 78% | 91 | 3.8 |
| Tillicum Community School | Colleen Chong | 3/4 | 22 | 16 | 73% | 82 | 2.3 |
| Hillcrest Elementary | Christa Macatee | 4/5 | 24 | 19 | 79% | 113 | 3.6 |
| Rogers Elementary | Shelby Bouthillier | 4/5 | 23 | 15 | 65% | 132 | 3.2 |
| Craigflower Elementary | Rachel Glenn | 4/5 | 24 | 12 | 50% | 130 | 2.8 |
| Craigflower Elementary | Courtni Bedi | 4/5 | 24 | 19 | 79% | 141 | 4.1 |
| Arbutus Global Middle school | Aliza Ehrkamp | 6 | 29 | 18 | 62% | 290 | 8.0 |
| Tillicum Elementary | Carla Evans | 4 | 28 | 22 | 79% | 150 | 4.2 |
| Campus View Elementary | Edith Mercier | 4/5 | 24 | 22 | 92% | 320 | 6.5 |
| Braefoot Elementary | Gary Bryan | 5 | 22 | 10 | 45% | 130 | 3.8 |
| Glanford Middle School | Hillary Gibson | 6/7 | 25 | 16 | 64% | 141 | 5.0 |
| Lansdowne Middle School | Triena Bryan | 6 | 22 | 16 | 73% | 118 | 2.8 |
| Ceder Hill Middle School | Bronwyn Zhou | 6/7 | 24 | 16 | 67% | 98 | 2.2 |
| Ceder Hill Middle School | Amy Collins | 6/7 | 24 | 23 | 96% | 402 | 9.1 |
| Strawberry Vale Elementary | Erika Antl-Shrieves | 4/5 | 23 | 14 | 61% | 92 | 2.8 |
| Strawberry Vale Elementary | Kiersten Brookes | 4/5 | 23 | 16 | 70% | 271 | 7.2 |
| Strawberry Vale Elementary | Sharon Foerster | 4/5 | 23 | 19 | 83% | 113 | 4.0 |
| McKenzie Elementary | Lisa Schneider | 5 | 27 | 13 | 48% | 182 | 4.4 |
| Northridge Elementary | Lisa Kittmer | 3/4 | 18 | 11 | 61% | 120 | 3.2 |
| Cloverdale Traditional Elementary | Sydney Mattu | 3/4 | 23 | 13 | 57% | 166 | 4.5 |
| Colquitz Middle School | Skye Scott | 6/7 | 24 | 16 | 67% | 99 | 3.1 |
| Tillicum Community School | Tracey Crystal | 5 | 29 | 29 | 100% | 319 | 11.5 |
| St. Joseph's Elementary | Robbie Veenhof | 5 | 26 | 24 | 92% | 255 | 8.3 |
| St. Joseph's Elementary | Megan Dern | 5 | 26 | 23 | 88% | 199 | 7.1 |
| Frank Hobbs Elementary | Tanya Timmermans | 4/5 | 24 | 14 | 58% | 128 | 3.5 |
| Frank Hobbs Elementary | Tracy Johns | 4/5 | 23 | 17 | 74% | 299 | 7.3 |
| Doncaster Elementary | Jennifer Cox | 4/5 | 25 | 14 | 56% | 100 | 2.0 |
| Doncaster Elementary | Brooke Bérubé | 3/4 | 23 | 19 | 83% | 161 | 3.7 |
| Cordova Bay Elementary | Heather Simpson | 4 | 22 | 17 | 77% | 125 | 3.0 |
| Arbutus Global Middle School | Leah Mathewson | 6 | 18 | 12 | 67% | 136 | 3.2 |
| Lansdowne Middle School | Sarah Buckler | 6 | 29 | 19 | 66% | 161 | 4.6 |
| Royal Oak Middle School | Andrew Delong | 7 | 25 | 15 | 60% | 98 | 2.2 |
| Strawberry Vale Elementary | Jennifer Harvey | 4/5 | 23 | 18 | 78% | 149 | 2.9 |
| Colquitz Middle School | Brianne Irving | 6 | 24 | 12 | 50% | 111 | 3.1 |
| South Island Distance Education School | Jolene Bales | 4 - 6 | 15 | 9 | 60% | 78 | 2.5 |
| Lansdowne Middle School | Caitlin Stewart | 6 | 24 | 0 | 0% | 0 | 0.0 |
| Colquitz Middle School | Christina Croce | 7 | 25 | 0 | 0% | 0 | 0.0 |
| Total | 875 | 582 | 67% | 5,700 | 155.6 |
Bold text indicates 2024/25 class winner
High School
| School name | Teacher name | Discipline | Grade | Class size | # active accounts | Participation Rate (%) | Total actions completed | GHG totals per class |
|---|---|---|---|---|---|---|---|---|
| Glanford Middle School | Amber Turek | Science | 8 | 18 | 16 | 89% | 126 | 3.2 |
| Spectrum Community School | Alden Sefton | Social Studies | 9 | 23 | 20 | 87% | 156 | 5.8 |
| Spectrum Community School | Alden Sefton | Social Studies | 9 | 24 | 16 | 67% | 145 | 4.0 |
| Royal Oak Middle School | Byron Leslie | Home Room | 7 | 20 | 12 | 60% | 113 | 3.3 |
| Gordon Head Middle School | Alexander De Medeiros | Home Room | 7 | 27 | 20 | 74% | 140 | 4.2 |
| Gordon Head Middle School | Jolene Smith | Home Room | 7 | 27 | 23 | 85% | 161 | 5.5 |
| Lansdowne Middle School | Gwyn West | Science | 7 | 23 | 13 | 57% | 78 | 2.1 |
| Lansdowne Middle School | Gwyn West | Science | 7 | 23 | 16 | 70% | 119 | 2.9 |
| Reynolds Secondary | Annalee Tyler | Enviro Science | 9-10 | 43 | 38 | 88% | 261 | 10.4 |
| Arbutus Global Middle School | Leah Mathewson | Science | 7 | 27 | 23 | 85% | 145 | 3.7 |
| Lansdowne Middle School | Lara Walters | French Immersion | 7 | 26 | 25 | 96% | 168 | 6.7 |
| Spectrum Community School | Alden Sefton | Social Studies | 9-12 | 23 | 17 | 74% | 91 | 2.3 |
| Spectrum Community School | Alden Sefton | Social Studies | 9-12 | 24 | 19 | 79% | 138 | 3.9 |
| Total | 328 | 258 | 79% | 1,841 | 58.0 |
West Shore
Elementary
| School name | Teacher name | Grade | Class size | # Cards returned | Return Rate (%) | Total actions completed | GHG totals per class |
|---|---|---|---|---|---|---|---|
| Colwood Elementary | Tamara Maxim | 5 | 26 | 17 | 65% | 118 | 2.8 |
| Hans Helgesen Elementary School | Camille McRae | 4/5 | 23 | 20 | 87% | 183 | 4.7 |
| Crystal View Elementary | Alexis Silvera | 3/4 | 22 | 12 | 55% | 116 | 3.1 |
| Ruth King Elementary | Sharon MacDonald | 5 | 26 | 14 | 54% | 129 | 3.0 |
| PEXSISEN Elementary | Jo Saunders | 3/4 | 24 | 12 | 50% | 85 | 2.6 |
| Hans Helgesen Elementary School | Keiro Blyth | 4/5 | 23 | 16 | 70% | 106 | 2.8 |
| Centre Mountain Lellum Middle School | Alvina Keval | 7 | 27 | 20 | 74% | 131 | 3.1 |
| Total | 171 | 111 | 65% | 868 | 22.2 |
High School
| School name | Teacher name | Discipline | Grade | Class size | # active accounts | Participation Rate (%) | Total actions completed | GHG totals per class |
|---|---|---|---|---|---|---|---|---|
| Royal Bay Secondary | Ashleigh Allen | Science | 9 | 20 | 13 | 65% | 86 | 3.5 |
| Royal Bay Secondary | Ashleigh Allen | Science | 9 | 20 | 18 | 90% | 184 | 7.4 |
| Royal Bay Secondary | Ashleigh Allen | Science | 9 | 20 | 20 | 100% | 102 | 4.1 |
| Total | 60 | 51 | 85% | 372 | 15.0 |
Town of View Royal
Elementary
| School name | Teacher name | Grade | Class size | # Cards returned | Return Rate (%) | Total actions completed | GHG totals per class |
|---|---|---|---|---|---|---|---|
| Shoreline Community Middle School | Lauren Wright | 4/5 | 22 | 12 | 55% | 170 | 4.1 |
| Shoreline Community Middle School | Dave Gwilliam | 6 | 20 | 14 | 70% | 122 | 3.5 |
| Total | 42 | 26 | 62% | 292 | 7.6 |
District of Sooke
Elementary
| School name | Teacher name | Grade | Class size | # Cards returned | Return Rate (%) | Total actions completed | GHG totals per class |
|---|---|---|---|---|---|---|---|
| Sooke Elementary | Jennifer Hunt | 4/5 | 23 | 13 | 57% | 145 | 3.5 |
| Journey Middle School | Shivonne Kerr | 6/7 | 15 | 10 | 67% | 110 | 3.2 |
| Journey Middle School | Blake Roney | 6/7 | 25 | 17 | 68% | 167 | 4.9 |
| Sooke Elementary | Emma Denhoff | 4 | 25 | 20 | 80% | 165 | 4.8 |
| Total | 88 | 60 | 68% | 587 | 16.4 |
High School
| School name | Teacher name | Discipline | Grade | Class size | # active accounts | Participation Rate (%) | Total actions completed | GHG totals per class |
|---|---|---|---|---|---|---|---|---|
| Edward Milne Community School | Patrick Gale | Sustainability | 10 | 17 | 14 | 82% | 152 | 6.1 |
| Edward Milne Community School | Patrick Gale | ECO Science | 10 | 19 | 13 | 68% | 102 | 2.2 |
| Total | 36 | 27 | 75% | 254 | 8.3 |
Core
Elementary
| School name | Teacher name | Grade | Class size | # Cards returned | Return Rate (%) | Total actions completed | GHG totals per class |
|---|---|---|---|---|---|---|---|
| Macauley Elementary | Vendela Byrne | 4/5 | 21 | 15 | 71% | 130 | 3.3 |
| Macauley Elementary | Darlana Bartle | 4/5 | 25 | 16 | 64% | 145 | 3.2 |
| Ecole Willows Elementary | Claire Majors | 5 | 24 | 17 | 71% | 162 | 4.7 |
| Macauley Elementary | Amy Birkett | 4/5 | 22 | 12 | 55% | 96 | 2.7 |
| Total | 92 | 60 | 65% | 533 | 13.9 |
High School
| School name | Teacher name | Discipline | Grade | Class size | # active accounts | Participation Rate (%) | Total actions completed | GHG totals per class |
|---|---|---|---|---|---|---|---|---|
| Shoreline Community Middle | Julisa Cummins | French Immersion | 8 | 24 | 14 | 58% | 86 | 2.9 |
| Shoreline Community Middle | Dave Gwilliam | Home Room | 7 | 20 | 16 | 80% | 116 | 3.7 |
| Total | 44 | 30 | 68% | 202 | 6.6 |
District of Oak Bay
Elementary
| School name | Teacher name | Grade | Class size | # Cards returned | Return Rate (%) | Total actions completed | GHG totals per class |
|---|---|---|---|---|---|---|---|
| St. Michaels University School | Heather Sandquist | 4 | 19 | 18 | 95% | 163 | 5.0 |
| St. Michaels University School | Samantha Rizzuto | 4 | 19 | 11 | 58% | 104 | 2.9 |
| Glenlyon Norfolk Junior School | Sarah Wallace | 5 | 22 | 17 | 77% | 253 | 6.9 |
| Glenlyon Norfolk Junior School | Rhonda Stark | 5 | 22 | 21 | 95% | 261 | 8.1 |
| Willows Elementary | Kate Walker | 4/5 | 26 | 20 | 77% | 114 | 2.8 |
| Total | 108 | 87 | 81% | 895 | 25.6 |
High School
| School name | Teacher name | Discipline | Grade | Class size | # active accounts | Participation Rate (%) | Total actions completed | GHG totals per class |
|---|---|---|---|---|---|---|---|---|
| Oak Bay High School | Koji Zolbrod | Enviro Science | 11 | 21 | 12 | 57% | 140 | 5.6 |
District of Central Saanich
Elementary
| School name | Teacher name | Grade | Class size | # Cards returned | Return Rate (%) | Total actions completed | GHG totals per class |
|---|---|---|---|---|---|---|---|
| Bayside Middle School | Nathan Hudon | 6 | 23 | 14 | 61% | 205 | 5.7 |
| Keating Elementary | Julie Curran | 4 | 24 | 24 | 100% | 382 | 10.0 |
| Brentwood Elementary | Sara Van Helvoirt | 4/5 | 22 | 15 | 68% | 209 | 5.4 |
| Keating Elementary | Michael Trottier | 4/5 | 25 | 18 | 72% | 156 | 4.2 |
| Total | 94 | 71 | 76% | 952 | 25.3 |
Bold text indicates 2024/25 class winner
High School
| School name | Teacher name | Discipline | Grade | Class size | # active accounts | Participation Rate (%) | Total actions completed | GHG totals per class |
|---|---|---|---|---|---|---|---|---|
| Stelly's Secondary | Jessi Dildy | Science | 11 | 23 | 12 | 52% | 98 | 3.9 |
Peninsula & Electoral Areas
Elementary
| School name | Teacher name | Grade | Class size | # Cards returned | Return Rate (%) | Total actions completed | GHG totals per class |
|---|---|---|---|---|---|---|---|
| North Saanich Middle School | Alison Lomas | 6/7 | 25 | 20 | 80% | 117 | 4.2 |
| Deep Cove Elementary | Matthew Makuch | 4/5 | 23 | 16 | 70% | 110 | 3.3 |
| Pender Island Elementary | Claude Kennedy | 4/5 | 21 | 20 | 95% | 212 | 3.2 |
| Total | 69 | 56 | 81% | 439 | 10.7 |
High School
| School name | Teacher name | Discipline | Grade | Class size | # active accounts | Participation Rate (%) | Total actions completed | GHG totals per class |
|---|---|---|---|---|---|---|---|---|
| Parkland Secondary | Erin Stinson | Marine Biology | 11 | 27 | 20 | 74% | 129 | 3.2 |
Additional classes
Elementary
| School name | Teacher name | Grade | Class size | # Cards returned | Return Rate (%) | Total actions completed | GHG totals per class |
|---|---|---|---|---|---|---|---|
| North Saanich Middle School (North Saanich) | Pamela Ens | 6/7 | 26 | 18 | 69% | 246 | 6.8 |
| Deep Cove Elementary (North Saanich) | Rebecca Mohrs | 4/5 | 26 | 20 | 77% | 130 | 2.9 |
| Central Middle School (Victoria) | Meaghan Macdonald | 6/7 | 23 | 14 | 61% | 66 | 1.9 |
| Kelset Elementary (Pensinsula) | Melissa Cossaro | 4/5 | 21 | 15 | 71% | 128 | 2.1 |
| Margaret Jenkins Elementary (Victoria) | Kate Moll | 4/5 | 24 | 16 | 67% | 210 | 5.9 |
| Sir James Douglas Elementary (Victoria) | Cheryl Rolston | 3/4 | 24 | 14 | 58% | 127 | 3.9 |
| Margaret Jenkins Elementary (Victoria) | Katy Lewis | 3/4 | 23 | 14 | 61% | 87 | 2.3 |
| Total | 167 | 111 | 66% | 994 | 25.8 |
High School
| School name | Teacher name | Discipline | Grade | Class size | # active accounts | Participation Rate (%) | Total actions completed | GHG totals per class |
|---|---|---|---|---|---|---|---|---|
| Parkland Secondary (North Saanich) | Kirsten Dibblee | Science/PHE | 10 | 20 | 15 | 75% | 116 | 4.6 |
| Girl Guides Group (Victoria) | Carly Mobbs | Girl Guides | 7-9 | 15 | 13 | 87% | 91 | 3.6 |
| Centre Mountain Lellum Middle School (Langford) | Alvina Keval | Generalist | 7 | 27 | 21 | 78% | 132 | 5.0 |
| Total | 62 | 49 | 79% | 339 | 13.2 |
Elementary student climate action ideas (Individual / CRD)
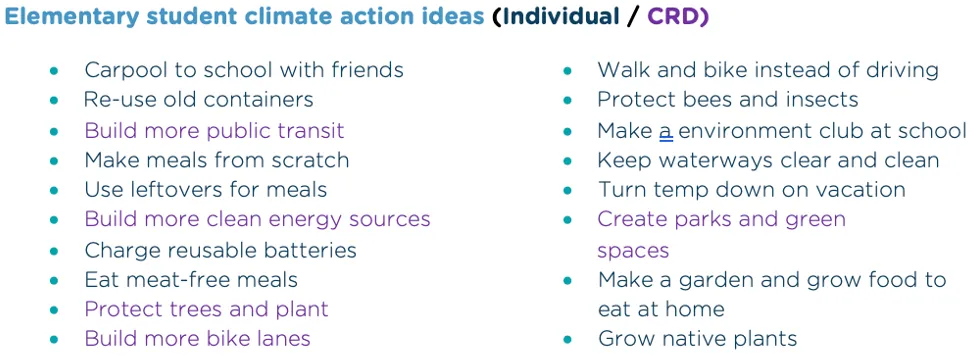
Summary of elementary student actions
| 1.1 Car Smart | 1.2 Travel Smart | 1.3 Local Vacation | 2.1 Tasty Leftovers | 2.2 Local Food |
|---|---|---|---|---|
| 512 | 806 | 630 | 860 | 790 |
| 2.3 Love Veggies | 2.4 Grow Your Own | 3.1 Earth Hour | 3.2 Get Efficient | 3.3 Stay Snug |
|---|---|---|---|---|
| 699 | 656 | 410 | 405 | 633 |
| 4.1 More than Recycling | 4.2 Home Waste | 5.1 Water Wise | 5.2 Adopt a Storm Drain | 5.3 Every Drop Counts |
|---|---|---|---|---|
| 654 | 602 | 441 | 397 | 615 |
| 6.1 Native Trees and Plants | 6.2 Bee Friendly | 6.3 Go Bio | 7.1 Gaming for Nature | 7.2 Local Climate Action |
|---|---|---|---|---|
| 507 | 467 | 422 | 442 | 391 |
| 7.3 Life Cycles | 7.4 Community Exploration | 7.5 Community Action | 7.6 Climate Reflections | 7.7 Climate Reflections |
|---|---|---|---|---|
| 353 | 260 | 387 | 258 | 278 |
TOTAL ACTIONS: 12,875
- Getting Around | 2. Food Choices | 3. Home Energy | 4. Waste | 5. Water | 6. Go Green | 7. Research + Reflection
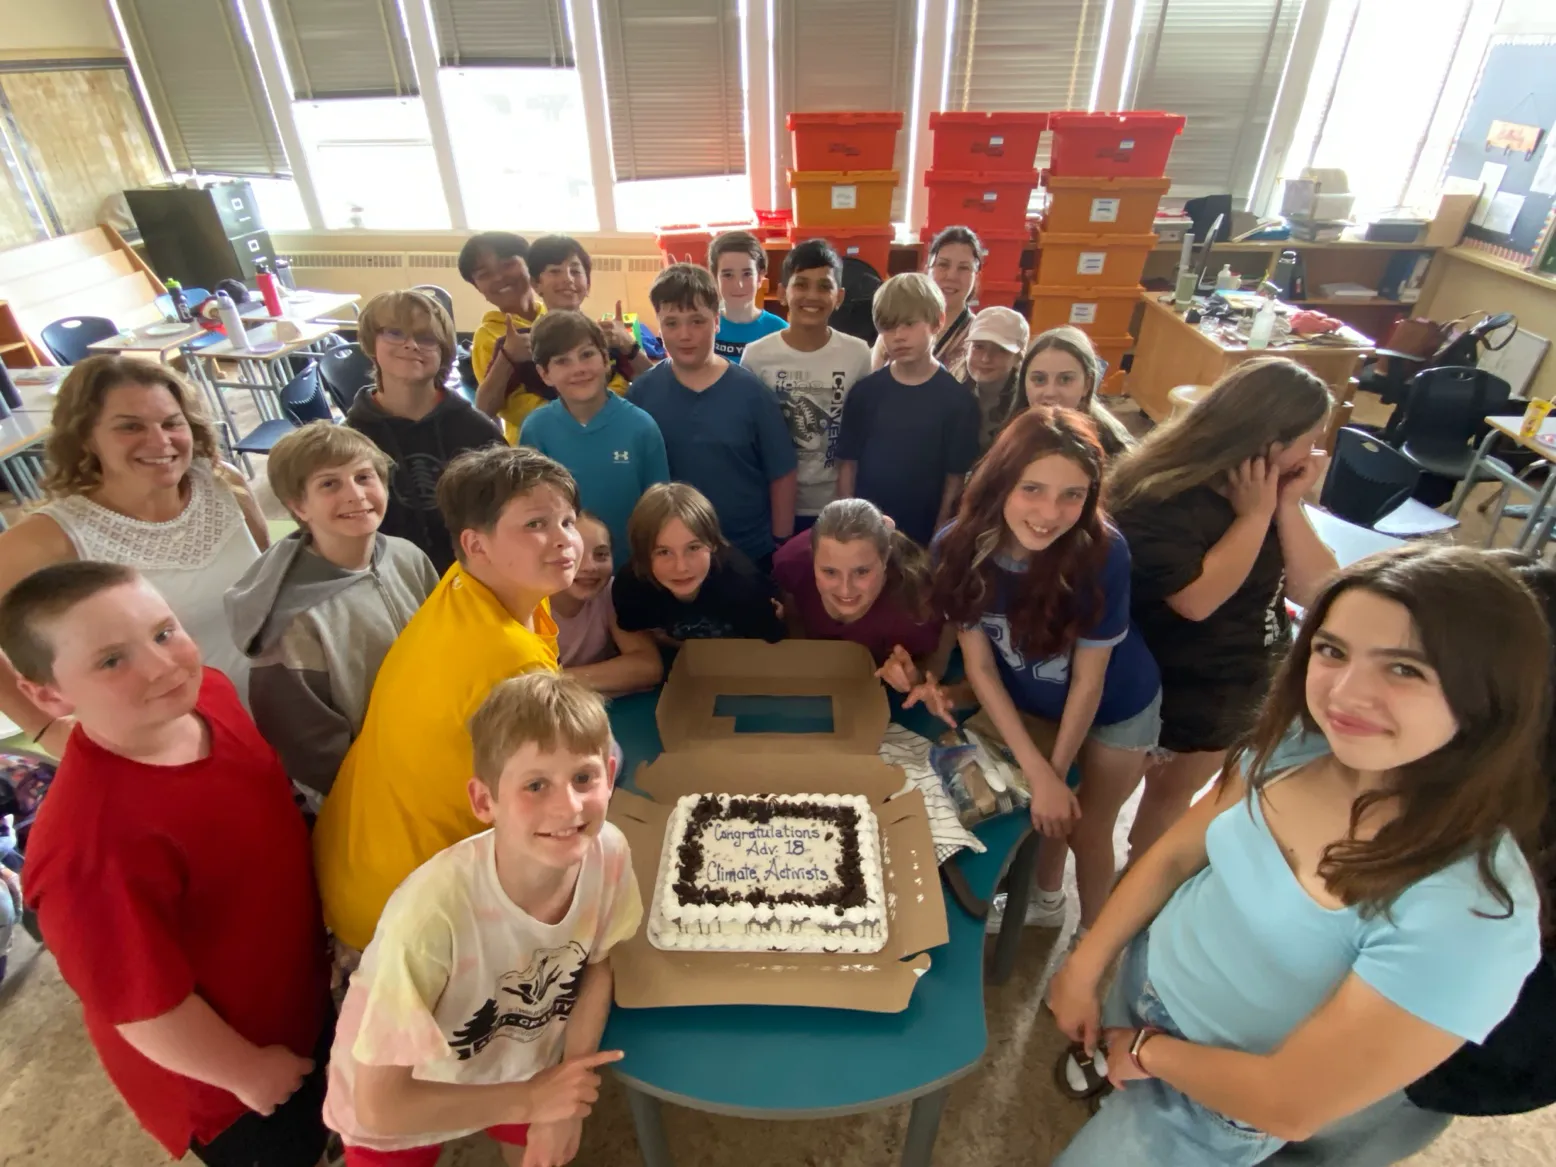
Student and Teacher Recognition and Rewards
BCSEA rewarded the hard work and dedication of students and teachers who did their best to complete the four-week program. We rewarded top performing students and classes with e-gift cards. We also offered random prize draws to encourage students to submit their cards no matter how many activities they completed. We are also sending personal thank you notes to all teachers who achieved over 75% return rate, or who filled in our teacher survey.
Acknowledgement of the CRD and partner municipalities’ sponsorship and support
BCSEA is grateful for the continued support from funders like the CRD who have made climate change education programming possible in their community. The CRD and partner municipalities were acknowledged for their support of the Cool It! Program in the following ways:
- The CRD and partner municipalities’ logos were featured on the Climate Change Card.
- CRD suggested actions were incorporated into the Climate Challenge Card – including links to specific District materials and resources.
- The CRD and partner municipalities’ logos are featured on the sponsor section of the Cool It! webpage www.coolitprogram.org/our-partners.
- Presenters acknowledged the support of the CRD and partner municipality (where applicable) during workshops and wrap-up sessions. CRD and partner municipalities’ support.
The BCSEA would like to thank the CRD for its ongoing support and partnership in achieving our shared goals of promoting of climate change science, increasing awareness of local climate action and community support, and empowering students and their families to make tangible behaviour changes towards more sustainable lifestyles.
From our entire team, thank you for your continued support!
Document Images
(2)