Attendance by Municipality and Geographic Distribution Appendices
Visual data charts and maps illustrating theatre attendance figures and geographic reach for regional arts venues.
ROYAL & MCPHERSON
ATTENDANCE BY MUNICIPALITY
MCPHERSON PLAYHOUSE:
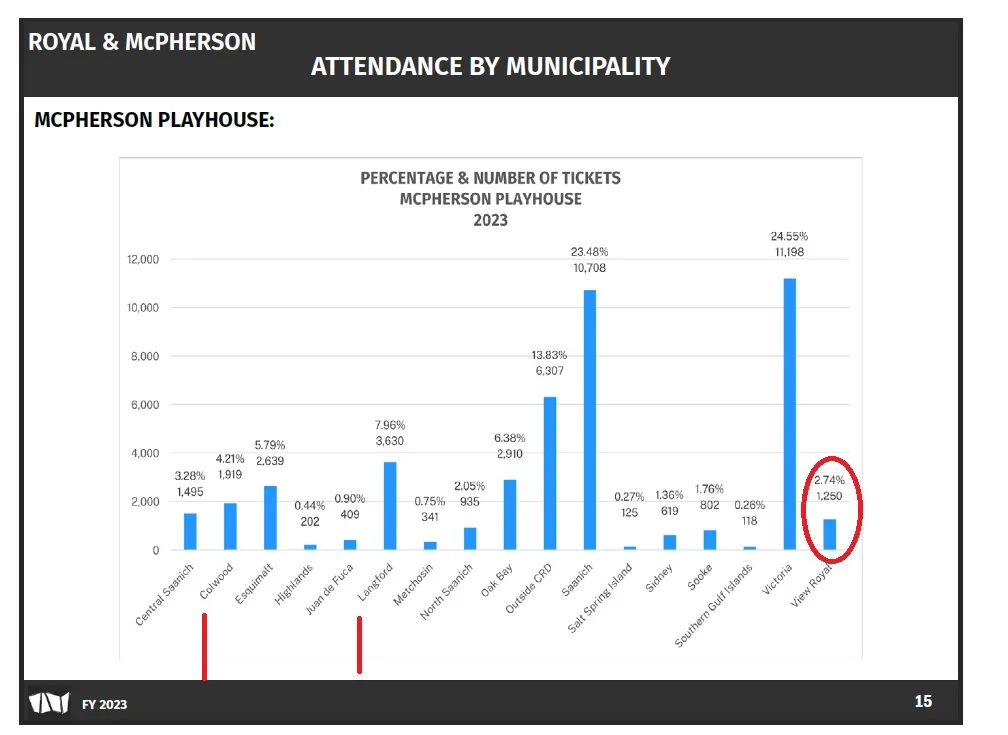
PERCENTAGE & NUMBER OF TICKETS MCPHERSON PLAYHOUSE 2023
| Municipality | Percentage | Number of Tickets |
|---|---|---|
| Central Saanich | 3.28% | 1,495 |
| Colwood | 4.21% | 1,919 |
| Esquimalt | 5.79% | 2,639 |
| Highlands | 0.44% | 202 |
| Juan de Fuca | 0.90% | 409 |
| Langford | 7.96% | 3,630 |
| Metchosin | 0.75% | 341 |
| North Saanich | 2.05% | 935 |
| Oak Bay | 6.38% | 2,910 |
| Outside CRD | 13.83% | 6,307 |
| Saanich | 23.48% | 10,708 |
| Salt Spring Island | 0.27% | 125 |
| Sidney | 1.36% | 619 |
| Sooke | 1.76% | 802 |
| Southern Gulf Islands | 0.26% | 118 |
| Victoria | 24.55% | 11,198 |
| View Royal | 2.74% | 1,250 |
Item 6.6 Appendix A
ATTENDANCE BY MUNICIPALITY
ROYAL THEATRE:
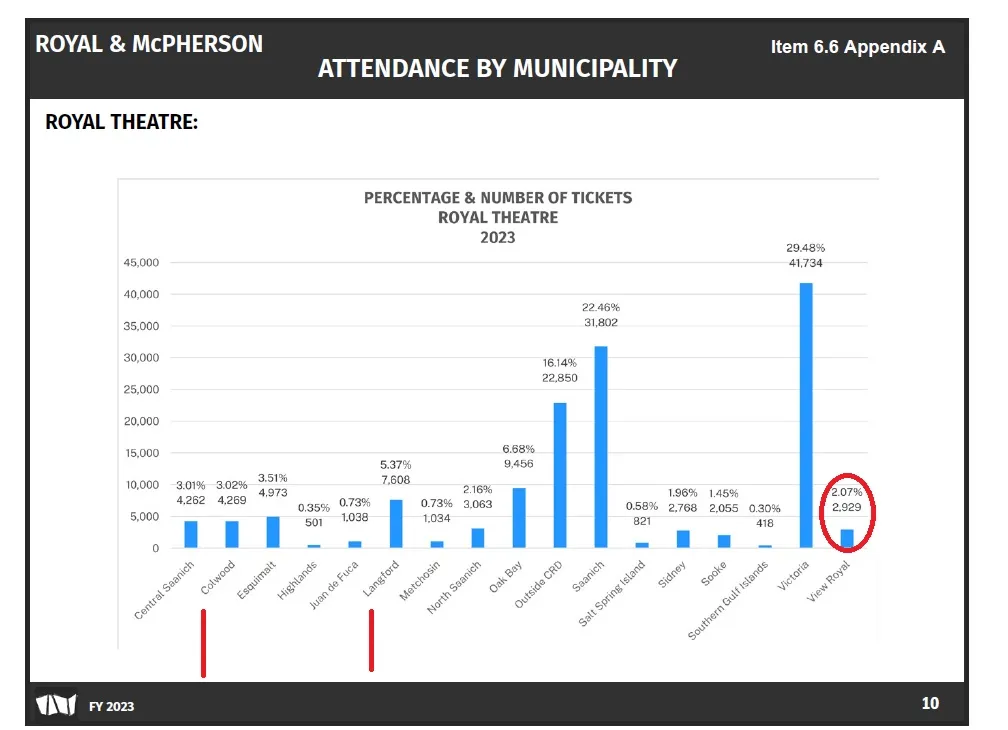
PERCENTAGE & NUMBER OF TICKETS ROYAL THEATRE 2023
| Municipality | Percentage | Number of Tickets |
|---|---|---|
| Central Saanich | 3.01% | 4,262 |
| Colwood | 3.02% | 4,269 |
| Esquimalt | 3.51% | 4,973 |
| Highlands | 0.35% | 501 |
| Juan de Fuca | 0.73% | 1,038 |
| Langford | 5.37% | 7,608 |
| Metchosin | 0.73% | 1,034 |
| North Saanich | 2.16% | 3,063 |
| Oak Bay | 6.68% | 9,456 |
| Outside CRD | 16.14% | 22,850 |
| Saanich | 22.46% | 31,802 |
| Salt Spring Island | 0.58% | 821 |
| Sidney | 1.96% | 2,768 |
| Sooke | 1.45% | 2,055 |
| Southern Gulf Islands | 0.30% | 418 |
| Victoria | 29.48% | 41,734 |
| View Royal | 2.07% | 2,929 |
Item 6.6 Appendix B
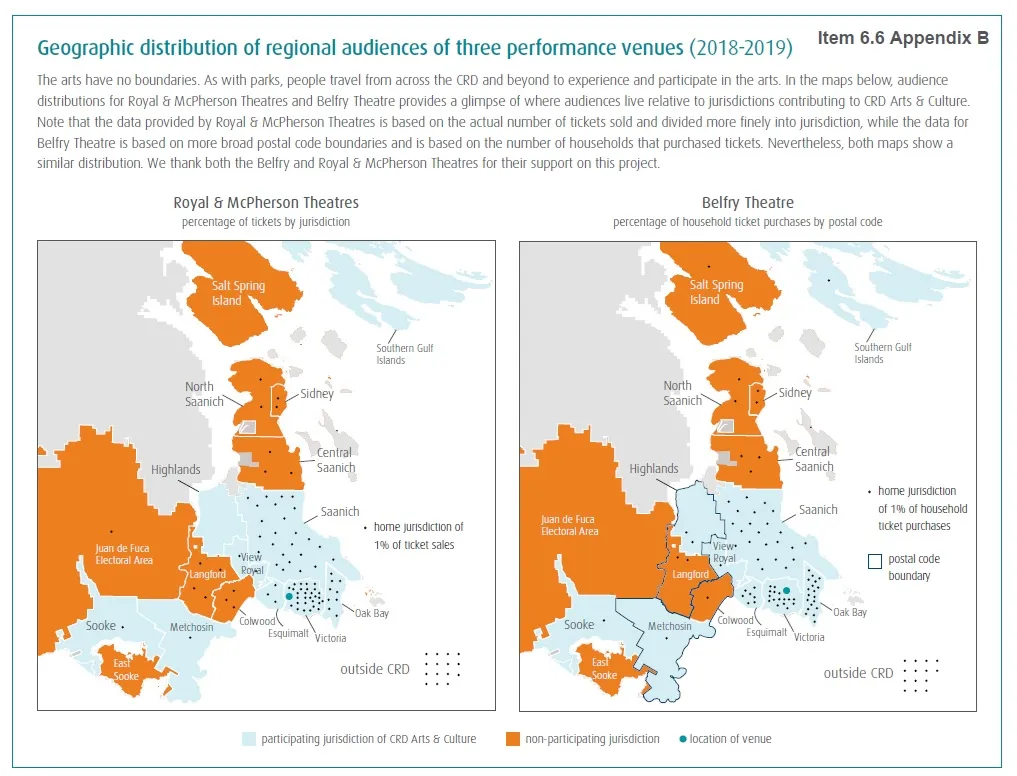
Geographic distribution of regional audiences of three performance venues (2018-2019)
The arts have no boundaries. As with parks, people travel from across the CRD and beyond to experience and participate in the arts. In the maps below, audience distributions for Royal & McPherson Theatres and Belfry Theatre provides a glimpse of where audiences live relative to jurisdictions contributing to CRD Arts & Culture. Note that the data provided by Royal & McPherson Theatres is based on the actual number of tickets sold and divided more finely into jurisdiction, while the data for Belfry Theatre is based on more broad postal code boundaries and is based on the number of households that purchased tickets. Nevertheless, both maps show a similar distribution. We thank both the Belfry and Royal & McPherson Theatres for their support on this project.