Attachment 7: A Transportation Review Report
An engineering study analyzing traffic generation, site access, and parking requirements for the proposed 20-unit development.
A Transportation Review Report
For
RESIDENTIAL DEVELOPMENT – 20-UNIT TOWNHOMES
294 & 296 Eltham Road & 242 Helmcken Road, View Royal, Victoria, BC
Prepared for
Jeffery Sengara, Owner
January 3, 2023, Updated on December 1, 2023
TABLE OF CONTENTS
- 1.0 INTRODUCTION ... 5
- 1.1 General ... 5
- 1.2 Planned Development ... 5
- 1.3 Purpose of Study ... 5
- 1.4 Methodologies ... 7
- 2.0 EXISTING CONDITIONS ... 8
- 2.1 Area Road Network ... 8
- 2.2 Existing Traffic Volumes and Conditions ... 8
- 2.4 Existing Heavy Vehicle Composition ... 11
- 3.0 PROJECTED TRAFFIC VOLUMES ... 12
- 3.1 Site Generated Trips ... 12
- 3.1.1 Pass-by Trips ... 12
- 3.1.2 Internal Trips ... 13
- 3.2 Trip Distribution ... 13
- 3.3 Trip Assignment ... 13
- 3.3.1 Site Generated Traffic Volumes ... 13
- 3.3.2 Post Development Traffic Volumes ... 13
- 4.0 EVALUATION AND RECOMMENDED IMPROVEMENTS ... 16
- 4.1 Level of Service Criteria for Intersections ... 16
- 4.2 Capacity and Level of Service Analyses ... 17
- 4.2.1 Existing 2022 Traffic Conditions ... 17
- 4.2.2 Post Development Traffic Conditions ... 18
- 4.3 Intersection Layout Assessment, Left Turn Requirement ... 18
- 4.4 Access and Major Intersections’ Sight Distance Review ... 21
- 5.0 PARKING AND TRAVEL DEMAND MANAGEMENT REVIEWS ... 29
- 5.1 Vehicle Parking Supply / Demand Analysis and Loading Requirement ... 29
- 5.2 Bicycle Parking Supply / Demand Analysis ... 29
- 5.3 Travel Demand Management ... 30
- 6.0 CONCLUSIONS AND RECOMMENDATIONS ... 31
Appendices:
- Appendix A: Project Development Site Plans
- Appendix B: Turning Movement Traffic Count Data
- Appendix C: Synchro - HCM 6th Edition Capacity Analysis Reports
List of Figures
- Figure 1a: Site Location Map ... 6
- Figure 1b: Local Context Aerial Map ... 6
- Figure 1c: Existing Intersection Lane Configuration and Control Type ... 9
- Figure 2: Existing 2022 Peak Hour Traffic Volumes ... 10
- Figure 3: Existing 2022 Pedestrian Crossing and Bicycle Peak Hour Volumes ... 10
- Figure 4: Direction of Approach and Site Access Distribution ... 14
- Figure 5: Site Generated Peak Hour Traffic Volumes ... 14
- Figure 6: Post Development Peak Hour Traffic Volumes ... 15
- Figure 7: Collision History at Helmcken Road and Eltham Intersection ... 20
- Figure 8a: Sight Distance and Visibility for 90° Intersection Approaches ... 22
- Figure 8b: Design Sight Distance For Departures From Stop Controlled Approach ... 25
- Figure 9: Sight Distance Field Measurement at Helmcken Road and Eltham Road ... 27
- Figure 10: Sight Distance Field Measurement at Access A1 on Eltham Road ... 28
List of Tables
- Table 1: Adjacent Highway Heavy Vehicle Composition (in%) ... 11
- Table 2: Trip Generation Rates, ITE Trip Generation Manual ... 12
- Table 3: Projected Site-Generated Peak-Hour Volume ... 12
- Table 4: Level of Service Criteria for Unsignalized Intersections ... 16
- Table 5: Level of Service Criteria for Signalized Intersections ... 16
- Table 6: Capacity Analysis for Existing 2022 Traffic Conditions ... 17
- Table 7: Capacity Analysis for Post Development, Opening Traffic Conditions ... 18
- Table 8: Town of View Royal’s Parking Requirements (Supply / Demand Analysis) ... 29
- Table 9: Town of View Royal’s Bicycle Parking Requirements (Supply / Demand) ... 29
1.0 INTRODUCTION
1.1 General
Mr. Jeffery Sengara retained Addoz Engineering Inc. to prepare a transportation review in support of the proposed Mixed-Use Residential Development, Townhomes to be in View Royal, Victoria, British Columbia. The proposed development will consist of a total of 20-Unit townhouses. The development will be located at 294 & 296 Eltham Road & 242 Helmcken Road, View Royal, BC. The project will be located on the northeastern quadrant of Helmcken Road and Eltham Road intersection. This transportation review is being prepared to assess potential transportation impacts of the proposed development and to satisfy View Royal's requirements for such a study as a result of the proposed development.
Figure 1a presents a site map that presents the general location of the proposed development, and Figure 1b presents a local context aerial map.
1.2 Planned Development
The proposed development will occupy the existing three houses currently located at 294 & 296 Eltham Road & 242 Helmcken Road, View Royal, BC. The proposed development will consist of 20-unit townhouses with attached car garages. The proposed site plans are attached in Appendix A of this report.
1.3 Purpose of Study
The primary purposes of this transportation review study are:
- To evaluate the traffic operations and levels of service (LOS) at the following intersections:
- Helmcken Road and Eltham Road intersection; and
- Eltham Road and Site Access intersection.
- To evaluate any potential project traffic impacts of the proposed development to the surrounding roadway network, and to determine if the roadways, site access and traffic circulations in the project vicinities would be suitable for the intended development and the amount of development traffic volumes anticipated.
- To identify suitable intersection control and geometric configurations that would be required to properly service the proposed development including conducting left-turn lane assessment for the Helmcken Road and Eltham Road intersection, based on Transportation Association of Canada (TAC)'s standards.
- Also, to identify any needed short-term and long-term roadway improvements in the project areas to enable acceptable traffic operations that would satisfy View Royal’s requirements.
1.4 Methodologies
This transportation review utilizes the following evaluation methodologies:
- Data collection including but not limited to existing roadway and intersection geometric characteristic, pavement markings, and traffic control types.
- A new peak hour traffic count collected on a typical weekday at the major study intersection.
- Trip generation estimate for the proposed development were based on appropriate Trip Generation land use categories available in the trip generation manual published by the Institute of Transportation Engineers (ITE), 11th Edition.
- Distribution of the site generated trips to/from the development site based on population, land uses, roadway network, and existing traffic patterns in the project vicinities.
- Assignment of the project trips to the adjacent roadways based on the proposed project site plan and the estimated roadway trip distribution characteristics.
- Intersection layout assessment based on the Transportation Association of Canada's standards will be completed to determine any needed improvements for the study intersection. The study will analyze whether there is a need for a left turn lane for either Helmcken Road or Eltham Road.
- Sightline field measurement and assessment will be completed for the site access intersection and the Helmcken Road / Eltham Road intersection. The town indicated they have concerns with respect to the sightlines, both vertical and horizontal, as a result of this development.
- Existing and Post Development traffic capacity analysis for the study area intersections and roadways to identify possible capacity constraints and to assess overall traffic impacts of the proposed development, which is based on the latest Highway Capacity Manual (HCM) methodologies by the Transportation Research Board, the US National Academies of Sciences, Engineering and Medicine.
2.0 EXISTING CONDITIONS
2.1 Area Road Network
There are two roadways providing access to the site as described below. These roadways are Helmcken Road and Eltham Road. A brief description of each of these roadways follows.
Helmcken Road is a two-lane two-way undivided roadway that runs in the north / south directions in the vicinity of the proposed development and intersects with Eltham Road creating a T-intersection. Helmcken Road connects the areas south of Eltham Road to provincial Highway 1 and the areas to the north of Highway 1. The speed limit on Helmcken Road is posted at 40 Km / hr. in the vicinity of the proposed development. Helmcken Road has marked bicycle lanes on the northbound and southbound direction adjacent to vehicle travel lanes.
Eltham Road is a two-lane two-way undivided paved local roadway that runs in the east / west directions in the vicinity of the site. The speed limit on Eltham Road is not posted but the prima facie speed is 30 Km/hr.
The intersection of Helmcken Road and Eltham Road is a 3-leg unsignalized intersection with stop-control sign on Eltham Road approach and a free flow operation on Helmcken Road north / south approaches. This intersection has one left/right shared lane in the westbound direction, one shared through/left lane in southbound direction, and one through/right lane in the northbound direction. Refer to Figure 1c that presents the current intersection layout for more details.
2.2 Existing Traffic Volumes and Conditions
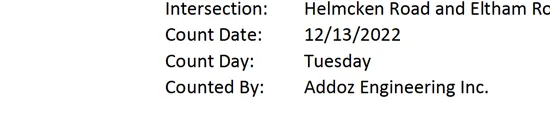
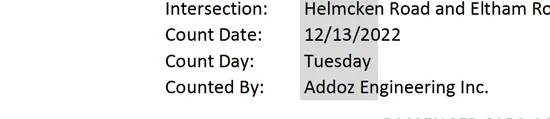
A field and desktop reconnaissance of the site and its surroundings was conducted to establish a database of the existing conditions. The peak period for the proposed residential development would typically occur during the weekday morning and afternoon periods. Turning movement traffic count data was collected on Tuesday, December 13, 2022 from 7:00 AM to 9:00 AM and from 4:00 PM to 6:00 PM for the a.m. and p.m. peak periods respectively at the following study intersection:
- Helmcken Road and Eltham Road Intersection.
The Existing 2022 AM and PM peak-hour traffic volumes for the above intersection are illustrated on Figure 2. Details of the collected traffic count data for the study intersection are contained in Appendix B.
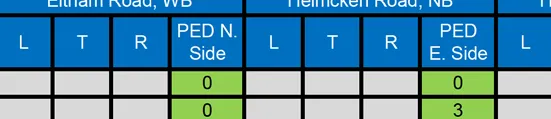
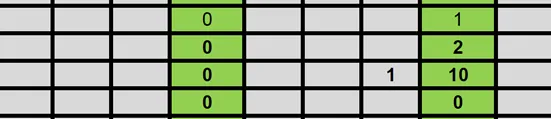
Additionally, the Existing 2022 bicycle traffic and pedestrian crossing the study intersection are presented on Figure 3. A review of Figure 3 indicates that observed bicycle traffic was low; however, pedestrian crossing was significant. The numbers of conflicting pedestrian and bicycle were considered in the Synchro capacity analyses for the study intersection.
2.4 Existing Heavy Vehicle Composition
The AM peak hour and PM peak hour heavy vehicle compositions were determined from the recent turning movement traffic count completed for this study. The resulted heavy vehicle percentages are presented in Table 1. Note that the sum of Single Unit Trucks and the Tractor Trailer Unit were considered to represent heavy vehicle traffic and their percentages are presented in the below table.
Table 1: Adjacent Highway Heavy Vehicle Composition (in %)
| Description | South of Eltham Road (Helmcken Road) | North of Eltham Road (Helmcken Road) | East of Helmcken Road (Eltham Road) | - |
|---|---|---|---|---|
| Existing 2022 Traffic Volume Data | ||||
| AM Peak Hour | 4.0% | 1.0% | 5.0% | - |
| PM Peak Hour | 3.0% | 3.0% | 0.0% | - |
The capacity analyses for major study intersection utilized above heavy vehicle percentages. Noting that for the approaches with a percentage lower than 2%, a heavy vehicle percentage of 2% was utilized in the capacity analyses for that approach.
3.0 PROJECTED TRAFFIC VOLUMES
3.1 Site Generated Trips
To estimate the number of vehicle trips expected to be generated by a development, trip generation rates are applied based on the proposed land uses and intensity. The number of trips that would be generated by a proposed development would usually be estimated based on the rates published in Trip Generation Manual, 11th Edition by the Institute of Transportation Engineers (ITE).
The trip generation rates along with the proposed land uses and the corresponding ITE land use codes are presented in Table 2. The proposed development’s generated trips are presented in Table 3.
Table 2: Trip Generation Rates ITE 11th Edition Trip Generation Manual
| Land Use | ITE Code | Dwelling Units | AM Peak Hour (In/Out/Total) | PM Peak Hour (In/Out/Total) | Daily Trips Total |
|---|---|---|---|---|---|
| Single-Family Attached Housing | 215 | Dwelling Units | 31% / 69% / 0.48 | 57% / 43% / 0.57 | 7.2 |
Table 3: Projected Site-Generated Peak-Hour and Daily Traffic Volumes
| Development | ITE Code | Density | AM Peak Hour (in/out/total) | PM Peak Hour (in/out/total) | Daily Trips Total |
|---|---|---|---|---|---|
| Proposed 20-Unit Townhouses | 215 | 20 Units | 3 / 7 / 10 | 7 / 5 / 12 | 144 |
3.1.1 Pass-by Trips
Pass-by trips are not new trips, but they are the trips that are attracted from the traffic passing the site on adjacent roadways. While pass-by trips are new trips at the access points to the site, they are not new trips on the adjacent roadway systems. Since the proposed development will include a residential Development, no pass-by trips are expected for such a development. Therefore, no reduction for pass-by trips considered.
3.1.2 Internal Trips
An internal trip is a trip that has both its origin and destination within a multi-use or mixed-use development area under investigation, which should be deducted from the total number of trips departing and entering the study site. The appropriate internal trip reduction rates are based on the characteristics of the mixed land uses. The proposed development will include a residential land use, hence internal trips are not expected for such development. Therefore, no reduction for internal trips considered.
3.2 Trip Distribution
The directions from which vehicles will approach and depart a site is a function of several variables, including the population and employment distribution within the development’s area of influence, the operational characteristics of the road system, and the ease with which drivers can travel over various sections of the roadway network without encountering congestion. The directional distribution of new project trips by the proposed Residential Development was estimated based on existing traffic patterns coupled with the above factors. The resulting directional distribution are as follows:
- 48% of site generated trips will travel to and from the north on Helmcken Road.
- 48% of site generated trips will travel to and from the south on Helmcken Road.
- 04% of site generated trips will travel to and from the east on Eltham Road.
The resulting traffic direction of approach and site access distribution is illustrated on Figure 4.
3.3 Trip Assignment
3.3.1 Site Generated Traffic Volumes
The projected peak-hour generated traffic volumes for the proposed 20-Unit Residential Development were assigned to the adjacent roadways based on the estimated directional distribution as shown on Figure 4. The resulted site generated AM peak hour and PM peak hour trips are illustrated on Figure 5.
3.3.2 Post Development Traffic Volumes
To determine the Post Development traffic volumes, the Existing 2022 traffic volumes shown on Figure 2 were added to development’s site-generated trips shown on Figure 5. The resulted Post Development, Opening, peak-hour traffic volumes are illustrated on Figure 6.
4.0 EVALUATION AND RECOMMENDED IMPROVEMENTS
4.1 Level of Service Criteria for Intersections
The intersections identified for the study were analyzed according to the methodologies presented in the 2016 Highway Capacity Manual (HCM 6th Edition). The analysis determines the "Level of Service (LOS)" of unsignalized intersections considering the factors including but not limited to number and types of lanes, traffic volumes, heavy vehicle composition, peak hour factors, pedestrian activities, etc. Levels of service are expressed in a range from "A" through "F," with "A" being the highest level of service, and "F" representing the lowest level of service. Table 4 shows the thresholds for Levels of Service "A" through "F" for unsignalized intersections that were evaluated under the current study. For comparison purpose, Table 5 presents the LOS criteria for signalized intersections.
Table 4: Level of Service Criteria for Unsignalized Intersections*
| Level of Service | Delay/Vehicle (seconds) | Description |
|---|---|---|
| A | ≤ 10.0 | Little or no delay, very low main street traffic. |
| B | 10.1 to 15.0 | Short traffic delays, many acceptable gaps. |
| C | 15.1 to 25.0 | Average traffic delays, frequent gaps still occur. |
| D | 25.1 to 35.0 | Long traffic delays, limited number of acceptable gaps. |
| E | 35.1 to 50.0 | Very long traffic delays, very small number of acceptable gaps. |
| F | > 50.0 | Extreme traffic delays, virtually no acceptable gaps in traffic. |
* Note: Capacity analysis for two-way stop-controlled intersection provides the LOS for the critical movements, not of the overall intersection.
Table 5: Level of Service Criteria for Signalized Intersections
| Level of Service | Delay/Vehicle (seconds) | Description |
|---|---|---|
| A | ≤ 10.0 | Most vehicles do not stop at all. |
| B | 10.1 to 20.0 | Some vehicles stop. |
| C | 20.1 to 35.0 | The number of vehicles stopping is significant, although many passes through without stopping. |
| D | 35.1 to 55.0 | Many vehicles stop. Individual cycle failures are noticeable. |
| E | 55.1 to 80.0 | Considered to be the limit of acceptable delay. Individual cycle failures are frequent. |
| F | > 80.0 | Unacceptable delay. |
4.2 Capacity and Level of Service Analyses
Capacity and level of service analyses were conducted for the following conditions:
- Existing 2022 Traffic Conditions.
- Post Development Traffic Conditions (with site traffic).
The software package Synchro 10 was utilized for the capacity analyses of study intersection and all site accesses. Synchro software utilizes Highway Capacity Manual (6th Edition) methodologies for the evaluations.
Note that the observed heavy vehicle percentages were utilized in the capacity analysis of study intersection. However, for the approaches where the observed percentage was less than 2% a heavy vehicle percentage of 2% was utilized in the capacity analyses for that approach.
4.2.1 Existing 2022 Traffic Conditions
Existing 2022 capacity, 95%tile queue length, delay per vehicle, and level of service analysis results for the study intersection are presented in Table 6. These results were taken from the HCM 6th Edition Un-Signalized Intersection Capacity Analyses Reports produced by Synchro software.
The detailed Synchro capacity and LOS analyses reports for all scenarios are contained in Appendix C of this report.
Table 6: Capacity Analysis for Existing 2022 Traffic Conditions
| Intersection | App. | AM Peak Hour: 95%tile Queue (VEH) | AM Peak Hour: V/C(a) Ratio | AM Peak Hour: Delay "Sec" | AM Peak Hour: LOS | PM Peak Hour: 95%tile Queue (VEH) | PM Peak Hour: V/C(a) Ratio | PM Peak Hour: Delay "Sec" | PM Peak Hour: LOS |
|---|---|---|---|---|---|---|---|---|---|
| Helmcken Road and Eltham Road | WB | 0.7 | 0.040 | 11.3 | B | 0.7 | 0.042 | 11.2 | B |
| NB | - | - | 0.0 | A | - | - | 0.0 | A | |
| SBL | 0.0 | 0.003 | 7.8 | A | 0.0 | 0.012 | 7.9 | A |
(a) The V/C values presented are for the movements with highest V/C within that approach
A review of Table 6 indicates that the study intersection is currently operating at acceptable levels of service including the stop sign controlled approach during both the AM and the PM peak hours. There is no queueing issue at any of the study intersection's approaches. Therefore, no mitigation is needed under existing traffic conditions.
4.2.2 Post Development Traffic Conditions
LOS and capacity analyses results for the Post Development, Opening, traffic conditions (with site development generated traffic) for study intersection and site access intersection are presented in Table 7.
Table 7: Capacity Analysis for Post Development, Opening, Traffic Conditions, Updated
| Unsignalized Intersection | App. | AM Peak Hour: 95%tile Queue (VEH) | AM Peak Hour: V/C(a) Ratio | AM Peak Hour: Delay "Sec" | AM Peak Hour: LOS | PM Peak Hour: 95%tile Queue (VEH) | PM Peak Hour: V/C(a) Ratio | PM Peak Hour: Delay "Sec" | PM Peak Hour: LOS |
|---|---|---|---|---|---|---|---|---|---|
| Helmcken Road and Eltham Road | WB | 1.4 | 0.055 | 11.6 | B | 1.4 | 0.052 | 11.4 | B |
| NB | - | - | 0.0 | A | - | - | 0.0 | A | |
| SBL | 0.0 | 0.004 | 7.8 | A | 0.0 | 0.015 | 7.9 | A | |
| Eltham Road and Access A1 | EBL | 0.0 | 0.002 | 7.3 | A | 0.0 | 0.004 | 7.3 | A |
| WB | - | - | 0.0 | A | - | - | 0.0 | A | |
| SB | 0.0 | 0.007 | 8.4 | A | 0.0 | 0.005 | 8.5 | A |
(a) The V/C values presented are for the movements with highest V/C within that approach
A review of Table 7 indicates that the major study intersection would continue to operate at acceptable levels of service including the stop sign controlled approaches without any issues, during both the AM and PM peak hours. Also, the site access intersection at Eltham Road would operate at acceptable levels of service. Therefore, no mitigation would be required under the Post Development traffic conditions.
4.3 Intersection Layout Assessment, Left Turn Requirement
The Intersection layout assessments were conducted based on TAC Guidelines as per the "Geometric Design Guide for Canadian Roads", June 2017 Edition. The concern for the study intersection of Helmcken Road and Eltham Road is the SB left-turn and the WB left-turn movements. The following was excerpted directly from the above referenced guide:
"Left-Turn Lane Warrants: Page 122: 9.17.2 GUIDELINES FOR THE APPLICATION OF LEFT-TURN LANES The left-turn lane requirements for two-lane and four-lane divided, and undivided roadways are based on volumes warrants and collision warrants.
Volume Warrants Volume warrants for left turns are typically based on capacity analysis. When opposing traffic volumes are such that left-turning vehicles must wait for a gap to make their turn, they interfere with the through traffic. The magnitude of this interference depends on the opposing volume, the advancing volume, and the percentage of left-turning vehicles. When traffic signals are warranted, storage lengths are subject to the signal cycle timing.
Safety Warrants A left-turn storage lane maybe also considered at locations where four or more collisions related to left turns occur per year, or where six or more occur within a period of two years, provided the collisions are type that could reasonably be expected to be eliminated by providing a left-turn lane. The minimum storage length for the collision warrant is 15 m."
As per the above guidelines, the volume warrants are typically based on the capacity analysis. Since the completed Synchro capacity analysis for existing 2022 and Post Development conditions did not show any operational deficiency or unacceptable levels of service, the installation of a left-turn only lane in the SB or in the WB are NOT warranted based on volume warrants. Refer to Table 7 above that presents the capacity analyses results for the Post Development conditions. The SB left-turn would operate at LOS "A" and the WB approach would operate at LOS "B", with almost no queues forming.
In order to check if exclusive left turn lanes are warranted based on the safety warrant criteria, the past five-year collision data was obtained from the Insurance Corporation of British Columbia (ICBC) from their online collision history page. The links to the website statistics, and the specific link to study intersection's collision data follows, respectively:
- https://www.icbc.com/about-icbc/newsroom/pages/Statistics.aspx
- https://public.tableau.com/app/profile/icbc/viz/VancouverIslandCrashes/VIDashboard
Figure 7 below presents a screenshot that was taken directly from ICBC website. The total number of crashes that occurred between 2017 and 2021 at the study intersection was 2 crashes only. Addoz Engineering Inc. tried to obtain more details about these two crashes such as date of occurrence, type of crashes, etc. However, this data could not be disclosed by ICBC as it is connected to the specific vehicles that were involved in the collisions, and Licence plate numbers are required to obtain collision details.
Going back to the safety warrant, considering the worst-case condition, which is the two crashes occurred in the same year and were related to left-turns (SB or WB), exclusive left-turn lanes are not warranted because the safety warrant states that "four or more collisions related to left turns occur per year, or where six or more occur within a period of two years". Since only two collisions occurred at the study intersection, the warrant has not been met. Therefore, SB and WB left-turn only lanes are NOT warranted at the study intersection.
4.4 Access and Major Intersections’ Sight Distance Review
There are two types of sight distances that could be evaluated at the at-grade intersections, the first is for vehicles approaching the intersection and the second is for vehicles departing the intersection from the stopped position. Both sight distances were evaluated in the field at Eltham Road and the proposed site access intersection as well as at the Helmcken Road and Eltham Road intersection. The requirements along with the field observations for each sight distance are presented below:
I. SIGHT TRIANGLE FOR APPROACHES
On the approaches to an intersection, the required sight distances depend upon the approach speeds and the particular action that the drivers may be required to take before reaching the point of potential conflict. In general, each driver has four possible actions: accelerate, continue at present speed, slow down or stop.
Many of the urban road intersections in British Columbia generally have a stop control for intersecting road and free flow for the main road. This is also true for the study major and site access intersections. The Helmcken Road and Eltham Road intersection has a stop sign control on Eltham Road approach and free flow on Helmcken Road north/south approaches. Similarly, the site access would have a stop control on the access approach and free flow on the Eltham Road east/west approaches. To determine the minimum sight triangle for the study intersections, Figure 8a that contains the sight distance and visibility at 90° intersections for approaches with stop control was consulted.
The posted speed limit on Helmcken Road is 40 Km/h and the prima facia speed on Eltham Road is 30 Km/h. For purposes of this analyses, the posted speed limit has been considered to be the design speed, which is 40 Km/h for Helmcken Road and 30 Km/h for Eltham Road. Based on the above criteria and reviewing the table shown on Figure 8a below, the minimum sight triangle values required for approaches at the study intersection are determined as follows, refer to the sight triangle shown on Figure 8a with yellow highlights:
The a = 30 metres and the b = 25 metres
Measurement of Sight Distances for Approaches
Sighting and target rods were constructed out of 2-inch by 2-inch wood. The prepared target rod was 1.30-metre-tall to represent the passenger vehicle height and the prepared sighting rod was 1.07-metre-tall to represent the approaching driver's eye height (passenger vehicle). The target and sighting rods are presented in the below picture for clarification purpose with the sighting rod on the left and the target rod on the right.
[Image of sighting and target rods held by a person]
Addoz Engineering Inc.’s staff visited the Helmcken Road and Eltham Road intersection on Tuesday December 13, 2022. The field staff started by checking the minimum sight triangle distances, a = 30m and b = 25m. As illustrated on Figure 8a, the staff member with the target rod stationed on the WB approach at 25m distance from the middle of the NB travel lane and the staff member with the sighting rod stood at 30m distance along Helmcken Road, one time to the south and the other time to the north. The sighting staff member was able to see the target rod without any issues or obstructions. Therefore, the minimum approach sight distances requirement is met at the Helmcken Road and Eltham Road intersection.
This procedure was not completed for the planned site access intersection because of the more local nature of Eltham Road. The more important sight distance to be available at this intersection is for the proposed site departing vehicles, which is discussed in details in the following pages.
II. MINIMUM SIGHT DISTANCE FOR DEPARTURES (CROSSING AND LEFT TURNS)
The driver of a stopped vehicle must be able to see a sufficient distance along the main (or through) highway to cross over it safely before an approaching vehicle reaches the intersection, even if a vehicle comes into view just as the stopped vehicle departs. The length of the main (or through) highway open to view must be greater than the product of its design speed and the time necessary for the stopped vehicle to start and cross the road. The minimum required sight distance along the main (or through) road is given by the formula:
D = V(J + t) / 3.6 ....................................................................................[1] Where: D is the minimum crossing sight distance along the main (or through) road from the intersection in metres. V is the design speed of the main (or through) roadway in kilometres per hour, which is considered 40 Km/hr. for Helmcken Road and 30 Km/hr. for Eltham Road. J is the perception-reaction time of the crossing driver (assumed two seconds). t is the acceleration time to cross the main (or through) road’s pavement in seconds. The time (t) is given for a range of crossing distances for the six design vehicles in Figure D-4.2.2.1a of the "Highway Geometric Design Guide" Chapter D. The t value for the Passenger design vehicle is 4.8 seconds. Inputting the numerical values in formula [1] provides the following:
DHelmcken = 40 (2+4.8) / 3.6 = 75.6 metres DEltham = 30 (2+4.8) / 3.6 = 56.7 metres
Therefore, the 75.6 metres is the minimum crossing sight distance required at the major study intersection of Helmcken Road/Eltham Road intersection. Also, the 56.7 metres is the minimum crossing or left turning sight distance required at the Site Access and Eltham intersection. These minimum distances must be available for the Helmcken Road/Eltham Road intersection and the proposed site access departing drivers to Eltham Road, respectively. Figure 8b presents the minimum intersection design sight distance based on the "Geometric Design Guide for Canadian Roads" TAC Standards, published in June 2017. The green highlighted and the yellow highlighted values on Figure 8b are consistent with the above calculated distances.
Field Measurement of Sight Distances for Departures
For the purposes of this exercise a 1.07-metre-tall sighting rod was prepared to represent the departing driver's eye height. Also, a 1.30-metre-tall target rod was prepared to represent vehicle's height on Helmcken Road approaches (to the north and to the south of Helmcken Road).
Addoz Engineering Inc.’s field staff started by checking the minimum departure sight distance of 76m as determined above. Note that this distance applies to Helmcken Road and Eltham Road intersection for the left turn onto Helmcken Road from Eltham Road WB approach.
Eltham Road Westbound at Helmcken Road:
Figure 9 presents the results for Eltham Road WB field measurement. The staff member with the target rod stationed on Helmcken Road at 76m distance from the WB Eltham Road stop bar. The staff member with the 1.30m target rod stood behind the stop bar on Eltham Road WB direction. The sighting staff member was able to see the target rod without any issues or obstructions and kept moving away until they reach the point where they are not able to see the target rod. These are the available sight distances that were recorded on Figure 9. A review of these distances indicates that there is a maximum of 95m sightline available to/from the north to Eltham Road. With respect to the south direction, Helmcken Road meets Island Highway at 83 metres from Eltham, this was assumed to be the maximum as further to the south is the Island Highway travel lanes. Therefore, the minimum departure sight distance requirement is met at the Eltham Road T-intersection WB approach.
Note about Figure 9: One may say how the sightline could pass through the trees to the north of Eltham Road? However, these trees are relatively high and the sightline is available along the low elevations (80cm to 130cm). Also, Helmcken Road is sloping downgrade in the northbound direction, which makes the view clearer to Eltham Road at low elevations.
Access A1 Southbound at Eltham Road:
Figure 10 presents the results for Planned Site Access A1 SB field measurement. The staff member with the target rod stationed on Eltham Road at 56m distance to the east of site access point, where future stop bar would be located. The staff member with the 1.30m target rod stood behind the stop bar on Access A1 SB direction. The sighting staff member was able to see the target rod without any issues or obstructions and kept moving away to the east until they reach the point where they are not able to see the target rod. This was the available sight distance that was recorded on Figure 10. For Eltham Road west of the planned site access point, the available distance measured was 37m, which is the maximum distance available, which was easily sighted without obstructions.
A review of Figure 10 indicates that there is a maximum of 58m sightline available to/from the east to Access point A1. With respect to the west direction, Eltham Road intersects Helmcken Road and the distance available to the centre line of the road was measured as 37m, which is slightly lower than the minimum requirement. However, Eltham Road is really a local road and the actual drivers' speed is around 30 Km/h or lower. Therefore, the minimum departure sight distance requirement is met at the Site Access A1 T-intersection SB approach.
5.0 PARKING AND TRAVEL DEMAND MANAGEMENT REVIEWS
5.1 Vehicle Parking Supply / Demand Analysis and Loading Requirement
A summary of the parking supply / demand for the proposed Residential development is presented in Table 8. The rates presented in the below table were taken from the Town of View Royal’s 900 — Zoning Bylaw standards included in Section 5.10, "Parking and Loading Schedule". As far as the parking supply, the development has a total of 34 vehicle parking spaces of which 7 are small car stalls.
Table 8: Town of View Royal’s Parking Requirements (Supply / Demand Analysis)
| Development Detail | Description | Density (Units) | Parking Rate | Parking Requirement (Demand) | Supply |
|---|---|---|---|---|---|
| Townhouse Development | 3-bedroom Townhouse | 20 | 1.5 Stall per dwelling unit | 30 | 27 Standard |
| 7 Small | |||||
| Visitor Parking | 0 | 0 | 2 Regular, 1 Small | ||
| Totals | 20 | 30 | 37 |
A review of Table 8 indicates that the parking supply is exceeding the parking bylaw requirement with 7 surplus parking spaces. Therefore, the Town of View Royal’s bylaw off-street parking requirements are satisfied.
5.2 Bicycle Parking Supply / Demand Analysis
A summary of the bicycle parking supply / demand for the proposed Residential Development is presented in Table 9. The rates presented in the below table were taken from the Town of View Royal’s 900 – Zoning Bylaw standards included in Section 5.11 under "Bicycle Parking" for Off-Street Bicycle Parking requirements.
Table 9: Town of View Royal’s Bicycle Parking Requirements (Supply / Demand)
| Description | Density / Number of Dwelling Units | Parking Rate | Required Bicycle Parking (Bylaw) | Supply |
|---|---|---|---|---|
| Residential Townhouse Development | 20 units | 1 per unit (Class 1) | 20 stalls | Class 1 Horizontal 10 |
| Class 1 Vertical 30 | ||||
| Total | 20 Stalls | 40 Stalls |
A review of Table 9 indicates that the number of bicycle parking spaces provided in the development is 40 spaces. The bicycle supply exceeds the Town of View Royal’s bicycle parking requirements by 20 stalls. These extra bicycle racks would encourage the development residents to utilize the bicycle for their transportation needs. Therefore, Town of View Royal’s bicycle parking requirements are met.
5.3 Travel Demand Management
Travel demand management (TDM) strategies were investigated as part of this study. This development encourages the utilization of alternative modes of transport. The following transportation management initiatives are being considered and implemented to encourage non-vehicle modes of transportation:
- Bicycle parking at a rate exceeding 1.0 per unit is being provided. The total bicycle spaces provided for the development with 20 spaces extra significantly exceeds Town’s bicycle parking bylaw requirement.
- Bicycle parking will be provided indoors in a safe and secure locations.
- Ramps to the residential development will be provided for cyclists to access the bike storage facilities.
- Plenty of sidewalk areas are provided around the development to encourage walking to/from the residences.
6.0 CONCLUSIONS AND RECOMMENDATIONS
This study analyzed the traffic impacts of the proposed Residential Development to be in View Royal, Victoria, British Columbia. The proposed development will consist of a total of 20-Unit townhouses. The development will be located at 294 & 296 Eltham Road & 242 Helmcken Road. The estimated number of total site generated trips entering and exiting the development would be 10 trips during the AM peak hour, 12 trips during the PM peak hour and 144 daily trips. The following conclusions / recommendations have been reached by this transportation review study:
- LOS and capacity analyses indicated that under the Existing 2022 traffic conditions, the study intersection of Helmcken Road and Eltham Road is currently operating at acceptable levels of service with ample capacities and no vehicle queuing. Therefore, no intersection improvements are required for this study intersection under existing conditions.
- Post Development, Opening with Full Project Site Traffic, LOS analyses indicated that the study intersection of Helmcken Road and Eltham Road would continue to operate at acceptable levels of service including the stop-controlled approach without any operational issues. Therefore, mitigation measures would NOT be needed under the post development conditions.
- The proposed site access intersection on Eltham Road would operate acceptably and would not require any mitigations.
- Intersection layout assessment was completed for the Helmcken Road and Eltham Road intersection based on TAC Guidelines. The purpose of the assessment was to determine whether SB left-turn only lane or / and WB left-turn only lane would be required. The results of the assessment indicated that exclusive left-turn only lanes are not warranted in both, SB and WB approaches of the intersection.
- One of the warrants for exclusive left-turn lanes depends on historical collisions at the study intersection, the safety warrant. The total number of collisions that occurred at the intersection of Helmcken Road and Eltham Road between 2017 and 2021 was two collisions only. This is considered low and indicates safe intersection operations.
- Intersection Sight Distance Reviews were completed for the Helmcken Road / Eltham Road intersection and the planned Site Access intersection on Eltham Road. The purposes of these reviews are to make sure that required minimum sight distances would be available. The results of these reviews indicated the following:
- The minimum approach sight distance requirement is met for the Helmcken Road and Eltham Road intersection.
- The minimum departure sight distance requirement of 76m is met at the study intersection of Helmcken Road and Eltham Road for the north and south directions. Approximately 83m sightline to/from the south to Eltham Road is available and 95m sightline to/from the north is available based on field measurement.
- The minimum departure sight distance requirement of 56m is met at the site access intersection on Eltham Road to/from east of the Access. Approximately 58m sightline to/from the east is available based on field measurement.
- The minimum departure sight distance requirement of 56m is NOT met at the site access intersection on Eltham Road to/from west of the Access. Approximately 37m sightline to/from the west is available based on field measurement. Eltham Road ends as it intersects with Helmcken Road.
- It is believed that the assumed 30 Km/h. speed on Eltham Road may be little high as this is a very local road and drivers would usually be driving below 30 Km/h. speed. The sightline requirement for less than 30 Km/h. would be lower than 56m. Therefore, the available 37m to the west of the site access is considered acceptable.
- Vehicle parking supply / demand analysis has been completed for the proposed Residential Development. The results indicated that parking supply is meeting the parking requirement with seven surplus parking spaces. Therefore, the Town of View Royal’s bylaw off-street parking requirements are satisfied.
- Bicycle parking supply / demand analysis for the proposed Residential Development was completed. The results indicated that the number of bicycle parking spaces provided exceeds Town’s bicycle parking requirements by 20 stalls.
- Travel demand management (TDM) strategies were investigated, and the following initiatives are being considered:
- Bicycle parking at a rate exceeding 1.0 per unit is being provided. The total bicycle spaces provided for the development with 20 spaces extra significantly exceeds Town’s bicycle parking bylaw requirement.
- Bicycle parking will be provided indoors in a safe and secure locations.
- Ramps to the residential development will be provided for cyclists to access the bike storage facilities.
- Plenty of sidewalk areas are provided around the development to encourage walking to/from the residences.
In summary, this transportation review concludes that the proposed 20-Unit Townhouse Residential Development will have some impact on the traffic operations of the future road network. However, this impact would not reach a level that would negatively impact nearby roadways or intersections.
Appendix A: Project Development Site Plan
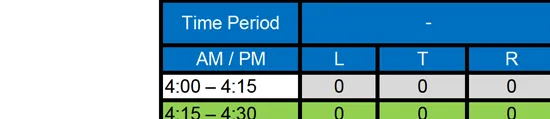
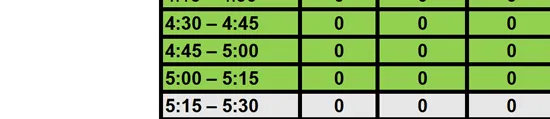
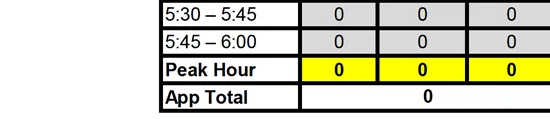
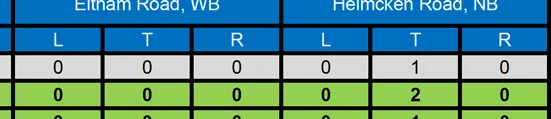
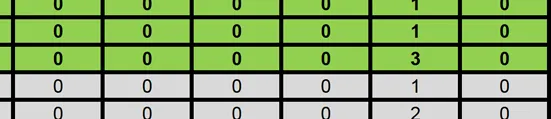
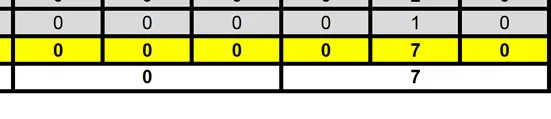
Appendix B: Intersection Turning Movement Traffic Count Data
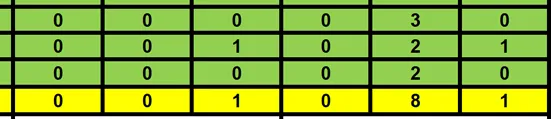
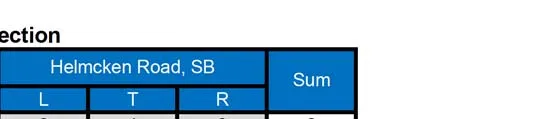
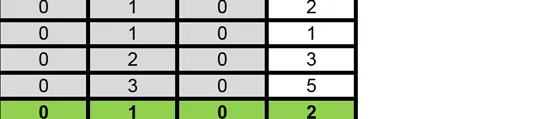
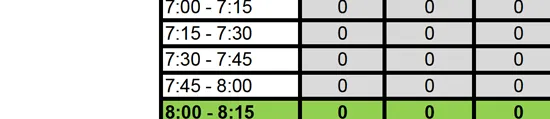
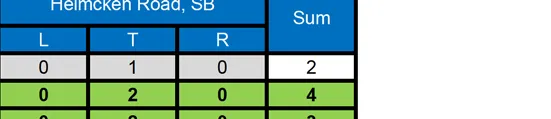
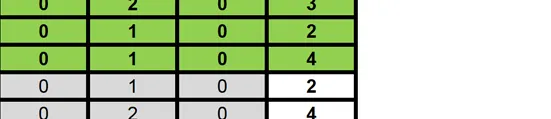
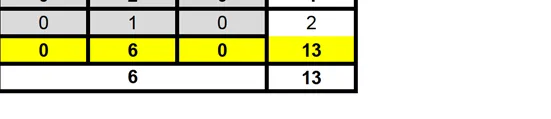
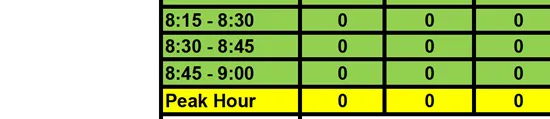
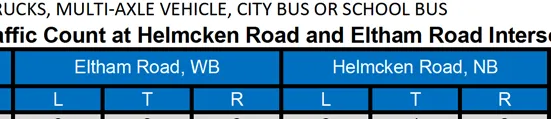
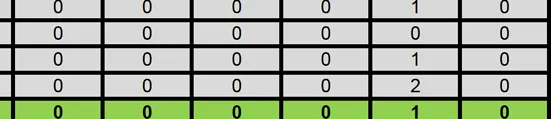
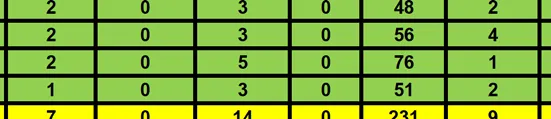
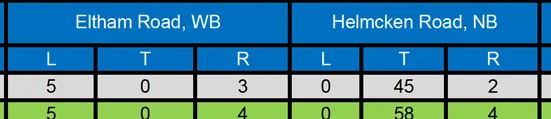
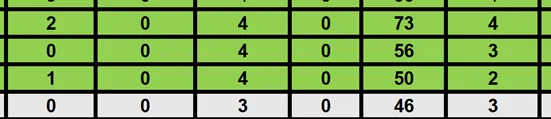
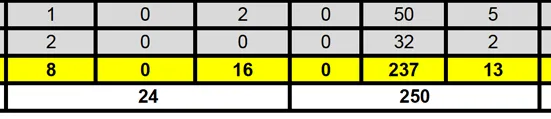
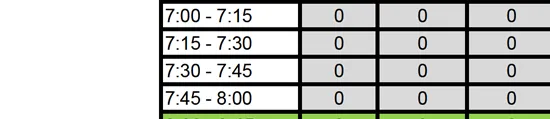
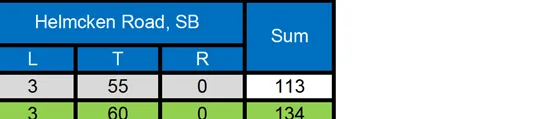
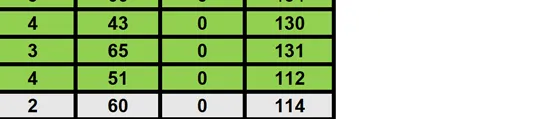
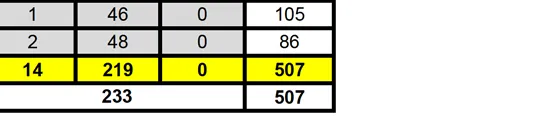
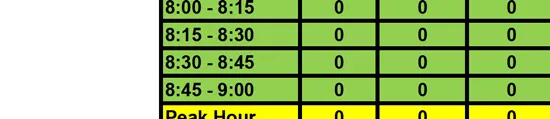
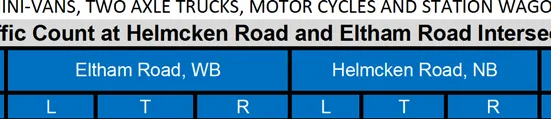
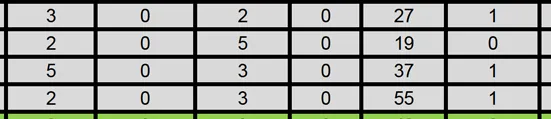
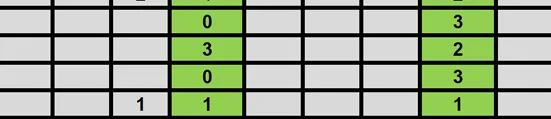
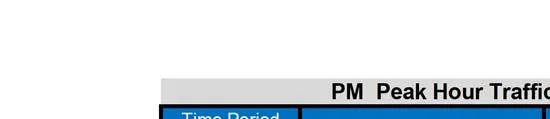
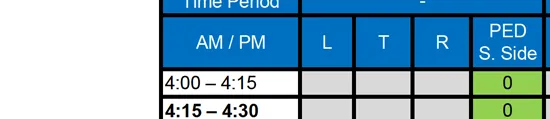
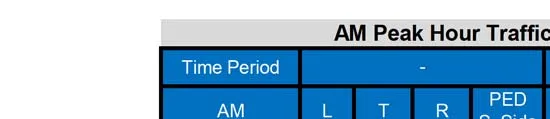
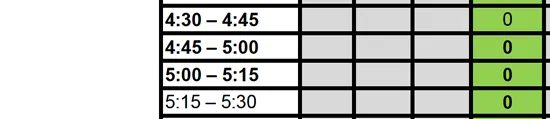
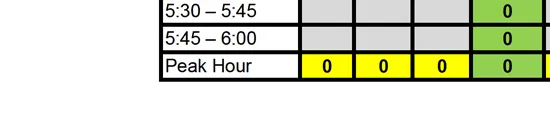
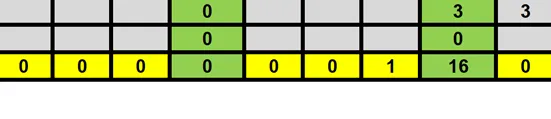
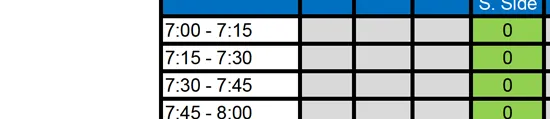
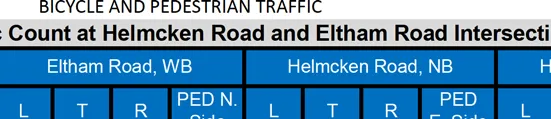
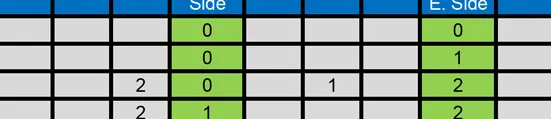
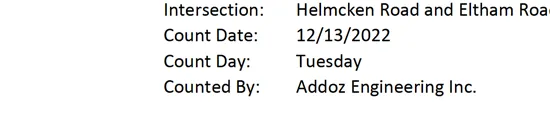
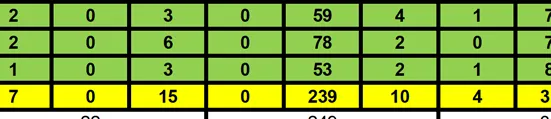
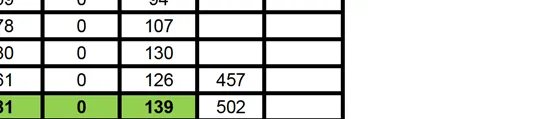
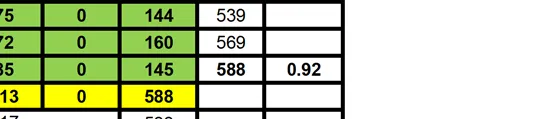
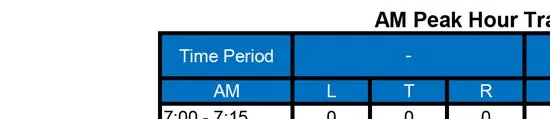
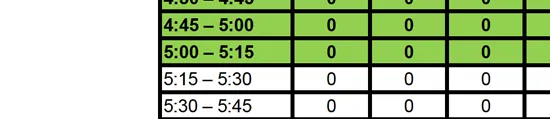
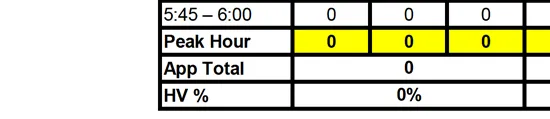
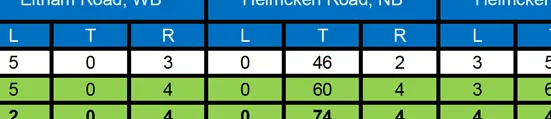
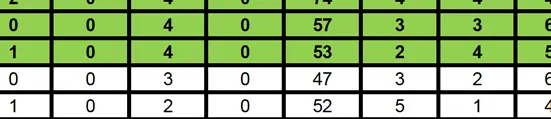
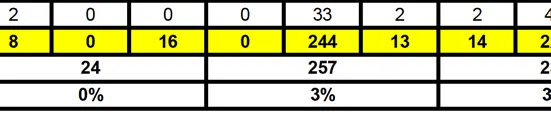
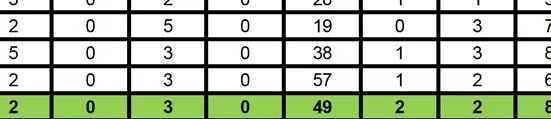
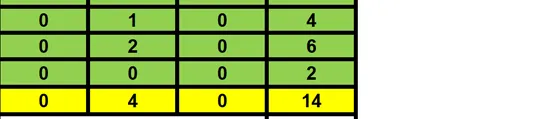
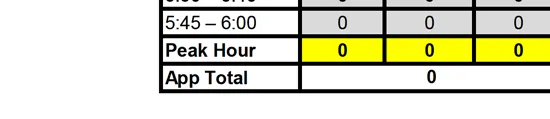
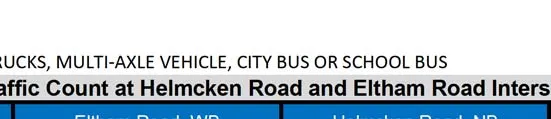
[Image 38, 39, 40, 41: Turning Movement Count Data Tables for Helmcken Rd & Eltham Rd intersection (collected Dec 13, 2022)]
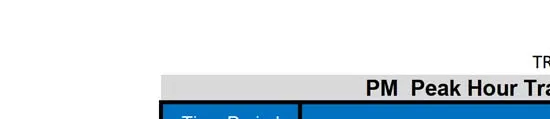
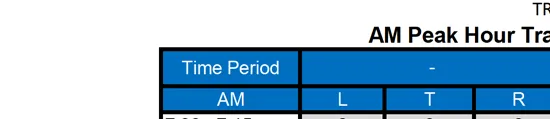
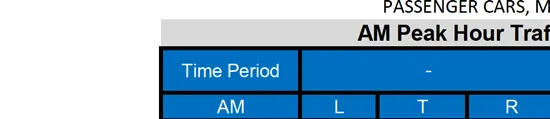
AM Peak Hour Traffic Count at Helmcken Road and Eltham Road Intersection
All Vehicles (7:45 AM - 8:45 AM)
| Approach | Left | Through | Right |
|---|---|---|---|
| Eltham Road, WB | 7 | 0 | 15 |
| Helmcken Road, NB | 0 | 239 | 10 |
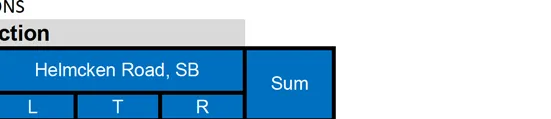
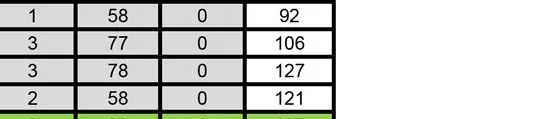
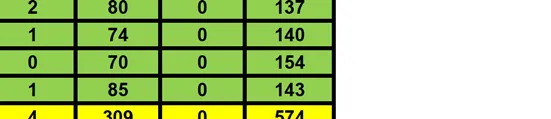
| Helmcken Road, SB | 4 | 313 | 0 |
| Peak Hour Total | 588 |
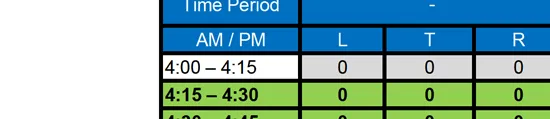
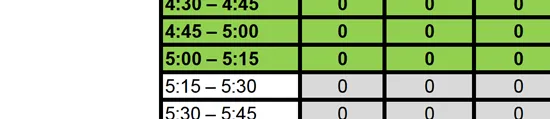
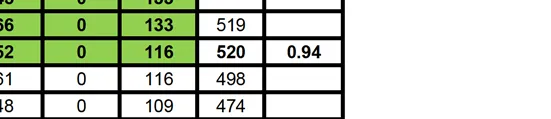
PM Peak Hour Traffic Count at Helmcken Road and Eltham Road Intersection
All Vehicles (4:30 PM - 5:30 PM)
| Approach | Left | Through | Right |
|---|---|---|---|
| Eltham Road, WB | 8 | 0 | 16 |
| Helmcken Road, NB | 0 | 244 | 13 |
| Helmcken Road, SB | 14 | 225 | 0 |
| Peak Hour Total | 520 |
Appendix C: Synchro - HCM 6th Edition Capacity Analysis Reports
Document Images
(109)
Aerial view collage showing site location and project renderings
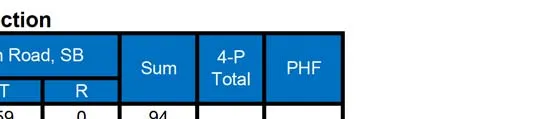
Figure 1a: Site Location Map and Figure 1b: Local Context Aerial Map
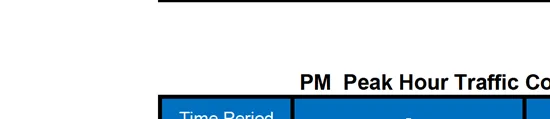
Figure 1c: Existing Study Area Intersection Lane Configuration and Control Type
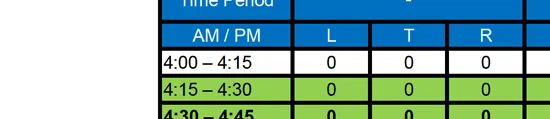
Figure 2: Existing 2022 Peak Hour Traffic Volumes and Figure 3: Existing 2022 Bike and Pedestrian Peak Hour Volumes

Figure 4: Direction of Approach and Site Access Distribution and Figure 5: Site Generated Peak Hour Traffic Volumes
Figure 6: Post Development Peak Hour Traffic Volumes (Figure 2 + Figure 5)
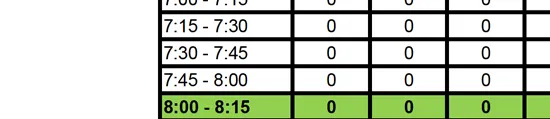
Figure 7: Helmcken Road and Eltham Road Collision History, 2017 to 2021 Data (Source: ICBC Website)
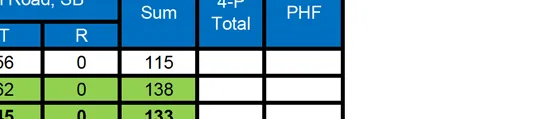
Figure 8a: Sight Distance and Visibility at 90° Intersections for Approaches with Stop Control (Source: Alberta Infrastructure, 1999)
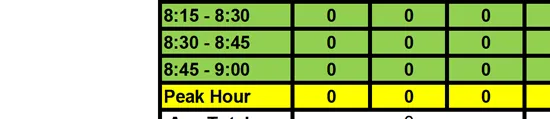
Figure 8b: Design Intersection Sight Distances for Departures from Stop Controlled Approaches (Source: TAC Geometric Design Guide for Canadian Roads, 2017)

Figure 9: Sight Distance Field Measurement at Helmcken Road and Eltham Road Intersection
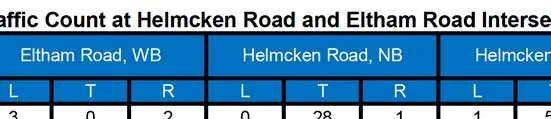
Figure 10: Sight Distance Field Measurement at Planned Access A1 on Eltham Road



Site Plan Dwelling A100 showing layout of buildings BLDG 1-5, drive aisles, and site access from Eltham Road
Synchro 10 Report - Existing 2022 AM Peak Hour, Helmcken Rd & Eltham Rd
Synchro 10 Report - Existing 2022 PM Peak Hour, Helmcken Rd & Eltham Rd
Synchro 10 Report - Post Development AM Peak Hour, Helmcken Rd & Eltham Rd
Synchro 10 Report - Post Development AM Peak Hour, Eltham Rd & Access A1
Synchro 10 Report - Post Development PM Peak Hour, Helmcken Rd & Eltham Rd