Project Summary C-137: West Shore RCMP building expansion
A detailed summary for the capital construction of the expanded RCMP facility, including debt servicing costs and population projections.
Project Summary
Project Name: West Shore RCMP building expansion Project Number: 2-2-12301-310 CC1103/1-2-08300-75x CC101-99 Submitted by: K. Anema, Chief Administrative Officer Priority: Required
Executive Summary
Jointly owned by The Town of View Royal and the Cities of Langford and Colwood (“the Communities”), the West Shore RCMP Detachment is located at 698 Atkins Avenue in Langford. The existing detachment is approximately 37,000 ft², comprised of two largely separate facilities: one built in the 1960s (approx. 10,600 ft²), and a newer structure built in 1999 (approx. 26,400 ft²). Investments have been made in the current detachment, but the facility is nearing capacity. Projections by the RCMP show the need for increased space in the next one to four years. As the Communities continue to grow, so too does the need for specialized and diversified policing services, increased use of technology, modern facilities, and a larger staff contingent to maintain the current level of service in the region.
Business problem and opportunity
A feasibility study explored the need for an expanded RCMP facility together with a review of redevelopment of the existing site versus options to relocate elsewhere within the Communities. A recommendation is made to remain at, and redevelop, the existing location on Atkins Avenue, as it is deemed to be more economical than relocating and building new.
Proposed project objectives
A twenty-year planning horizon was used:
- to align with the minimum debt financing that will likely accompany this project
- to mirror the estimated capacity needs with the financing horizon
- assuming a 2023/2024 construction start, occupancy would be 2025/2026
- near-term “excess space” could be leased to other agencies
- construction cost escalation supports building now vs later
Business risks
The Police Unit Agreement between the Municipality and Canada includes a requirement that the Town supply accommodation for the Royal Canadian Mounted Police. Failure to provide suitable accommodation can result in Canada supplying the building with the Town paying the cost of provision.
Proposed sources of funding
Municipal Finance Authority 20-year debt financing
Costs and benefits
| Costs | FY1 | FY2 | FY3 | FY4 | FY5 | 5-year Total |
|---|---|---|---|---|---|---|
| Capital | 12,800,000 | 12,800,000 | ||||
| Operational | 1,049,369 | 1,049,369 | 1,049,369 | 3,148,107 | ||
| Total | 0 | 12,800,000 | 1,049,369 | 1,049,369 | 1,049,369 | 15,948,107 |
| Benefits | ||||||
| Tangible | ||||||
| Intangible |
Recommendation
THAT the Committee recommend the 2023-2027 Financial Plan include the West Shore RCMP building expansion in 2024 to be funded by MFA long term debt.
Additional Information
Population projections were needed to help determine future space requirements and are assumed as follows in Table 1.
Table 1
| 2021 Population | 2045 Population Estimate | Annual Growth Assumption | |
|---|---|---|---|
| View Royal | 11,575 | 16,692 | 1.86% |
| Colwood | 18,961 | 34,295 | 2.50% |
| Langford | 45,584 | 103,133 | 6% (2022-2025) 4% (2026-2030) 3% (2031-2035) 2.5% (2036-2045) |
| Metchosin | 5,067 | 7,034 | 1.53% |
| Highlands, Songhees Nation, Esquimalt Nation | 4,645 | 6,147 | 2.31% Highlands 0.00% for Songhees and Esquimalt |
| Total | 85,832 | 167,301 |
Police to population ratios were also needed to help determine future space requirements. The ratios assumed in Table 2 are estimates. Each community will likely determine their police to population ratios annually as part of their financial planning processes.
Table 2
| 2045 Population Estimate | Police:Population Estimate | Corresponding Headcount | Current | |
|---|---|---|---|---|
| View Royal | 16,692 | 1:875 | 19 | |
| Colwood | 34,295 | 1:875 | 39 | |
| Langford | 103,133 | 1:750 | 138 | |
| Metchosin | 7,034 | 1:875 | 8 | |
| Highlands, Songhees Nation, Esquimalt Nation | 6,147 | 1:930 | 6 | |
| RCMP FTE total | 210 | 96 | ||
| Administrative | 70 | 51 | ||
| Total FTE | 281 | 147 |
The RCMP then provided space requirement estimates based on future RCMP FTE counts.
Table 3
| Square feet | |
|---|---|
| General Units | 39,042 |
| Common Units-Major Crimes/Serious Crime | 13,719 |
| Special Units/Large Detachment | 7,250 |
| Sub Total | 60,011 |
| Gross Up | 32,406 |
| Total Required | 92,417 |
We then benchmarked future space requirements against a comparable (Kelowna) and current West Shore facilities on a per capita and per FTE basis.
Table 4
| West Shore Current | West Shore 2045 | Kelowna | |
|---|---|---|---|
| Population served | 85,832 | 167,301 | 142,000 |
| RCMP FTE | 96 | 210 | 214 |
| Total FTE | 147 | 281 | 314 |
| Policing Ratio | 1:885 | 1:795 | 1:664 |
| Square Footage | 37,067 | 92,417 | 106,000 |
| Sq.ft./capita | 0.44 | .55 | .75 |
| Sq.ft/Total FTE | 252 | 329 | 338 |
The feasibility study ultimately recommended a building size of 92,417 ft² together with 2.5 acres of parking to support our policing functions 20 years hence. In the near term, portions of an expanded facility would be leased to other agencies (likely policing related) until such time that occupancy is needed for Communities policing purposes.
A further recommendation was returned to remain at, and redevelop, the existing location on Atkins Avenue, as it was deemed to be more economical than relocating and building new. Additionally, it was noted to be the preferred site over alternative options due to its central location and ease of access to major transportation routes.
Table 5: Estimated Capital Costs
| Item | Cost |
|---|---|
| Demolition | $633,346 |
| Site Servicing | $647,080 |
| Surface Parking | $1,767,131 |
| Building Construction | $44,443,329* |
| Sub Total | $47,490,886 |
| Net Zero Standard (5%) | $1,939,573 |
| Post Disaster Standard (10%) | $3,702,433 |
| Furniture, Fixtures, & Equipment (2.5%) | $1,187,272 |
| Land Acquisition (6 properties) | $5,400,000 |
| Price Escalation to 2024 (3.5% per year) | $4,253,569 |
| Project Delivery Services (12%) | $7,676,848 |
| Contingency (15%) | $10,747,587 |
| Estimated capital cost (+/- 25%) | $82.4M |
*Includes $6m in seismic upgrades for the 1999 facility (approximately 26,000 ft²) together with approximately 66,000 ft² in new construction.
Table 6: Estimated Municipal Contributions
| Municipality | 50% Population (2021) 50% Assessment (2021) | Capital Cost Contributions |
|---|---|---|
| Langford | 60.13% | $49.6M |
| View Royal | 15.56% | $12.8M |
| Colwood | 24.31% | $20.1M |
Next Steps
The Joint Steering Committee (3 CAOs) has recommended to pursue a Integrated Project Delivery (IPD) procurement approach, which will enable the Communities to come to a proposed budget while meeting project requirements in the most efficient manner.
With approval of the recommended budget of $1,200,000, the Communities will proceed with procuring an IPD Advisor and IPD team to develop a Validation Report in mid-2023. A Validation Report reflects the IPD Team’s commitment to achieve the target cost, budget, appropriate level of design, contingency, risk, schedule and other details to ensure owner requirements will be met. One community (likely Langford) will act is fiscal agent for the Communities through this process.
This work will enable the collective Communities stakeholder group to make a decision on whether to proceed with the proposed project.
Project Financing
Long-term borrowing will be required for Colwood’s contribution to this project, and we may determine to begin the borrowing process parallel with the Validation stage of procurement. Long-term borrowing is secured through a loan authorization bylaw, which requires approval of the electors, and the Inspector of Municipalities. Steps in the borrowing process are as follows:
- Loan authorization bylaw drafted, and council or board gives it three readings
- Municipal council or electoral area director provide consent (if applicable)
- Provincial review and statutory approval by the Inspector of Municipalities (6-8 weeks)
- Approval of the electors (if applicable, 8-11 weeks)
- Adoption of the bylaw by the council or board
- Challenge period (1 month)
- Provincial review and certificate of approval by the Inspector of Municipalities (2-4 weeks)
- Municipal council passes security issuing resolution and agreement (municipal borrowing only)
- Regional district drafts security issuing bylaw and board gives it three readings and adoption
- Challenge period for security issuing bylaw (10 days)
- Provincial review of the security issuing bylaw and certificate of approval by the Inspector of Municipalities (2-4 weeks)
- Security issuing by the Municipal Finance Authority
Debt Servicing
Should the project proceed as currently envisioned, View Royal will need to build into our annual budgets the costs of principal and interest repayment over time and determine a borrowing period for the loan. The capacity and capability of the building is being scaled for the 20-year horizon, however the building itself should provide useful life over a 50-year time scale.
| 20-Year | 30-Year | |
|---|---|---|
| Amount to borrow | $12,800,000 | $12,800,000 |
| Indicative interest rate | 4.67% | 4.67% |
| Annual Payment | $1,049,369 | $844,123 |
| Estimated interest cost | $8,911,416 | $7,209,749 |
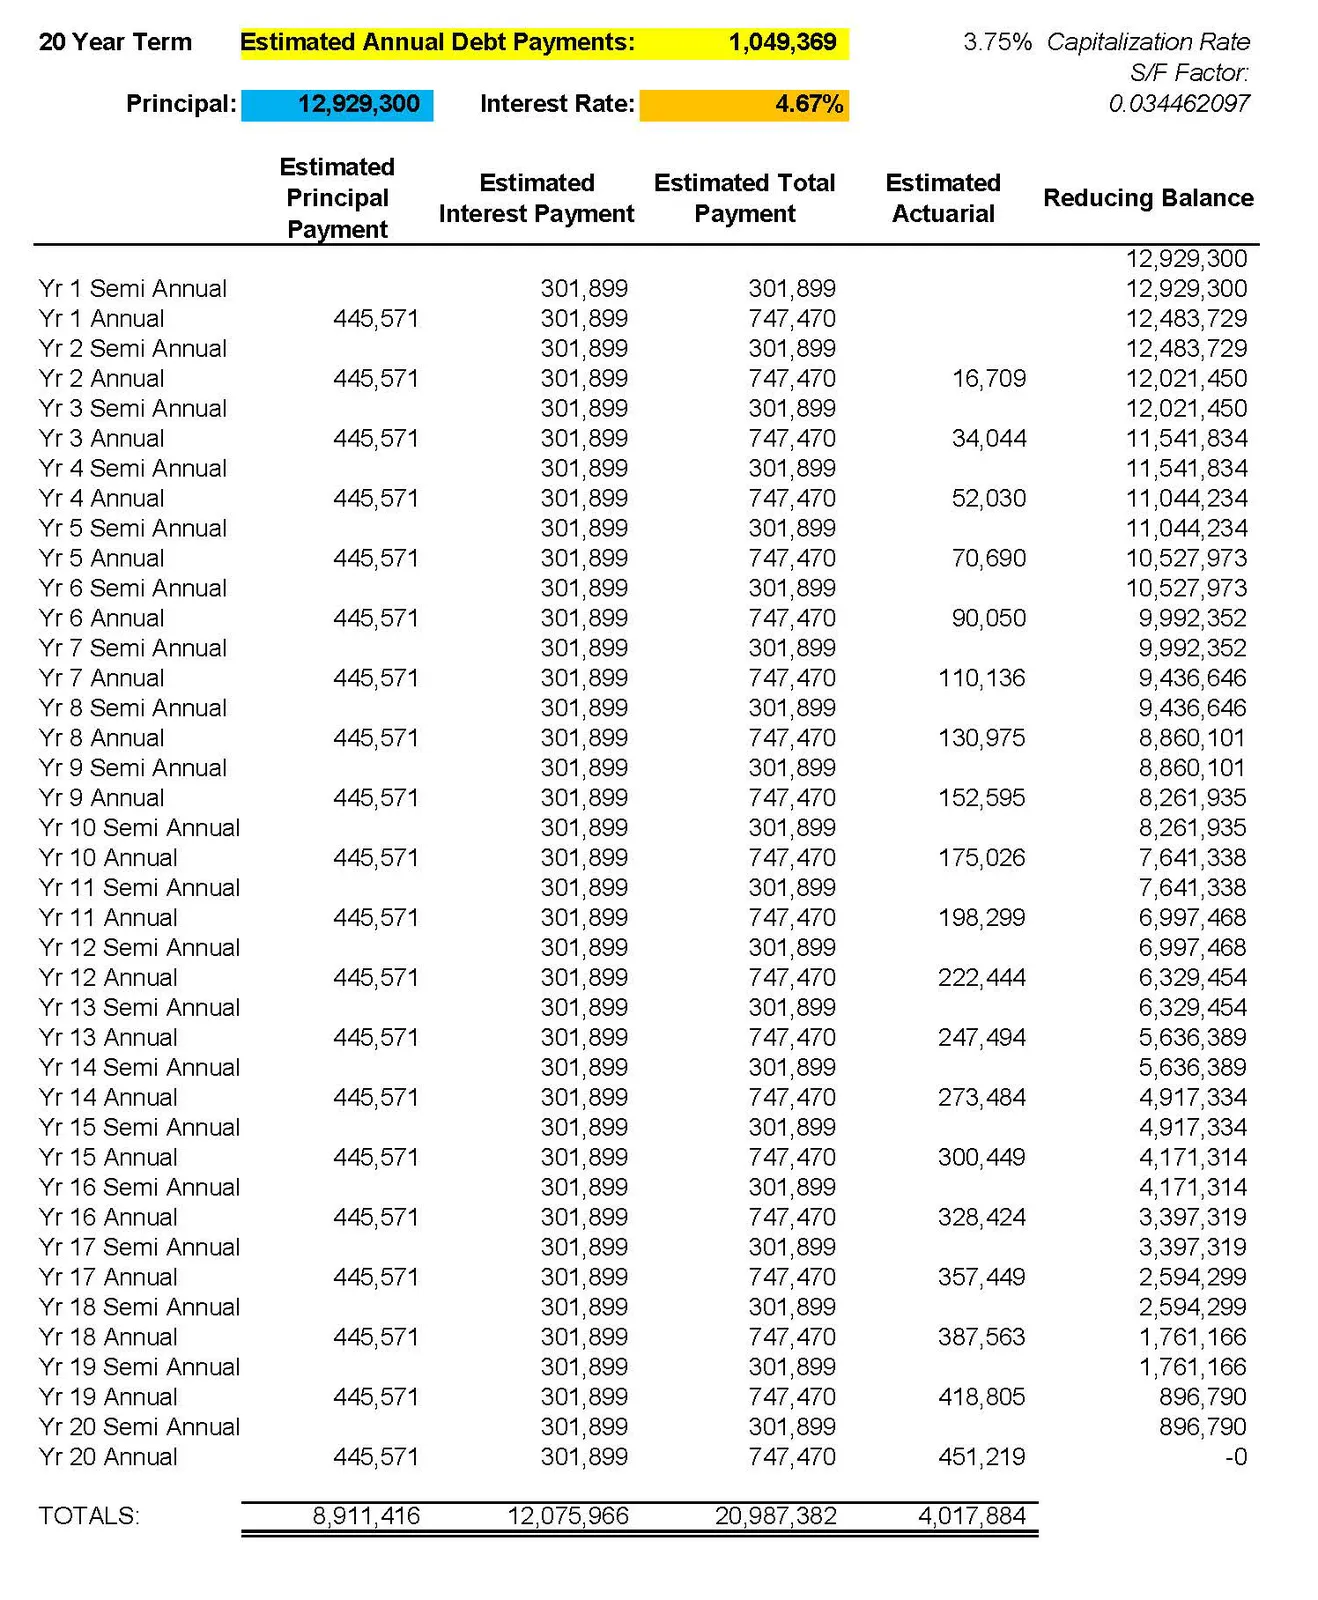
20-year debt amortization schedule (includes required 1% debt reserve fund contribution):
20 Year Term Estimated Annual Debt Payments: 1,049,369 Principal: 12,929,300 Interest Rate: 4.67% Capitalization Rate: 3.75% S/F Factor: 0.034462097
| Period | Estimated Principal Payment | Estimated Interest Payment | Estimated Total Payment | Estimated Actuarial | Reducing Balance |
|---|---|---|---|---|---|
| 12,929,300 | |||||
| Yr 1 Semi Annual | 301,899 | 301,899 | 12,929,300 | ||
| Yr 1 Annual | 445,571 | 301,899 | 747,470 | 12,483,729 | |
| Yr 2 Semi Annual | 301,899 | 301,899 | 12,483,729 | ||
| Yr 2 Annual | 445,571 | 301,899 | 747,470 | 16,709 | 12,021,450 |
| Yr 3 Semi Annual | 301,899 | 301,899 | 12,021,450 | ||
| Yr 3 Annual | 445,571 | 301,899 | 747,470 | 34,044 | 11,541,834 |
| Yr 4 Semi Annual | 301,899 | 301,899 | 11,541,834 | ||
| Yr 4 Annual | 445,571 | 301,899 | 747,470 | 52,030 | 11,044,234 |
| Yr 5 Semi Annual | 301,899 | 301,899 | 11,044,234 | ||
| Yr 5 Annual | 445,571 | 301,899 | 747,470 | 70,690 | 10,527,973 |
| Yr 6 Semi Annual | 301,899 | 301,899 | 10,527,973 | ||
| Yr 6 Annual | 445,571 | 301,899 | 747,470 | 90,050 | 9,992,352 |
| Yr 7 Semi Annual | 301,899 | 301,899 | 9,992,352 | ||
| Yr 7 Annual | 445,571 | 301,899 | 747,470 | 110,136 | 9,436,646 |
| Yr 8 Semi Annual | 301,899 | 301,899 | 9,436,646 | ||
| Yr 8 Annual | 445,571 | 301,899 | 747,470 | 130,975 | 8,860,101 |
| Yr 9 Semi Annual | 301,899 | 301,899 | 8,860,101 | ||
| Yr 9 Annual | 445,571 | 301,899 | 747,470 | 152,595 | 8,261,935 |
| Yr 10 Semi Annual | 301,899 | 301,899 | 8,261,935 | ||
| Yr 10 Annual | 445,571 | 301,899 | 747,470 | 175,026 | 7,641,338 |
| Yr 11 Semi Annual | 301,899 | 301,899 | 7,641,338 | ||
| Yr 11 Annual | 445,571 | 301,899 | 747,470 | 198,299 | 6,997,468 |
| Yr 12 Semi Annual | 301,899 | 301,899 | 6,997,468 | ||
| Yr 12 Annual | 445,571 | 301,899 | 747,470 | 222,444 | 6,329,454 |
| Yr 13 Semi Annual | 301,899 | 301,899 | 6,329,454 | ||
| Yr 13 Annual | 445,571 | 301,899 | 747,470 | 247,494 | 5,636,389 |
| Yr 14 Semi Annual | 301,899 | 301,899 | 5,636,389 | ||
| Yr 14 Annual | 445,571 | 301,899 | 747,470 | 273,484 | 4,917,334 |
| Yr 15 Semi Annual | 301,899 | 301,899 | 4,917,334 | ||
| Yr 15 Annual | 445,571 | 301,899 | 747,470 | 300,449 | 4,171,314 |
| Yr 16 Semi Annual | 301,899 | 301,899 | 4,171,314 | ||
| Yr 16 Annual | 445,571 | 301,899 | 747,470 | 328,424 | 3,397,319 |
| Yr 17 Semi Annual | 301,899 | 301,899 | 3,397,319 | ||
| Yr 17 Annual | 445,571 | 301,899 | 747,470 | 357,449 | 2,594,299 |
| Yr 18 Semi Annual | 301,899 | 301,899 | 2,594,299 | ||
| Yr 18 Annual | 445,571 | 301,899 | 747,470 | 387,563 | 1,761,166 |
| Yr 19 Semi Annual | 301,899 | 301,899 | 1,761,166 | ||
| Yr 19 Annual | 445,571 | 301,899 | 747,470 | 418,805 | 896,790 |
| Yr 20 Semi Annual | 301,899 | 301,899 | 896,790 | ||
| Yr 20 Annual | 445,571 | 301,899 | 747,470 | 451,219 | -0 |
| TOTALS: | 8,911,416 | 12,075,966 | 20,987,382 | 4,017,884 |