CUSTOMER SATISFACTION TRACKING REPORT Q2 2023 - YOUTH TRANSIT DATA
Data from BC Transit tracking the frequency of bus use, satisfaction, and impact of free transit for children under 12.
Customer Tracking Surveys
Customer Satisfaction Tracking Report Q2 2023
Frequency of Riding the Bus by Children 12 and Under
Current Reporting Quarter: Q3 2023 (JUL - SEP)
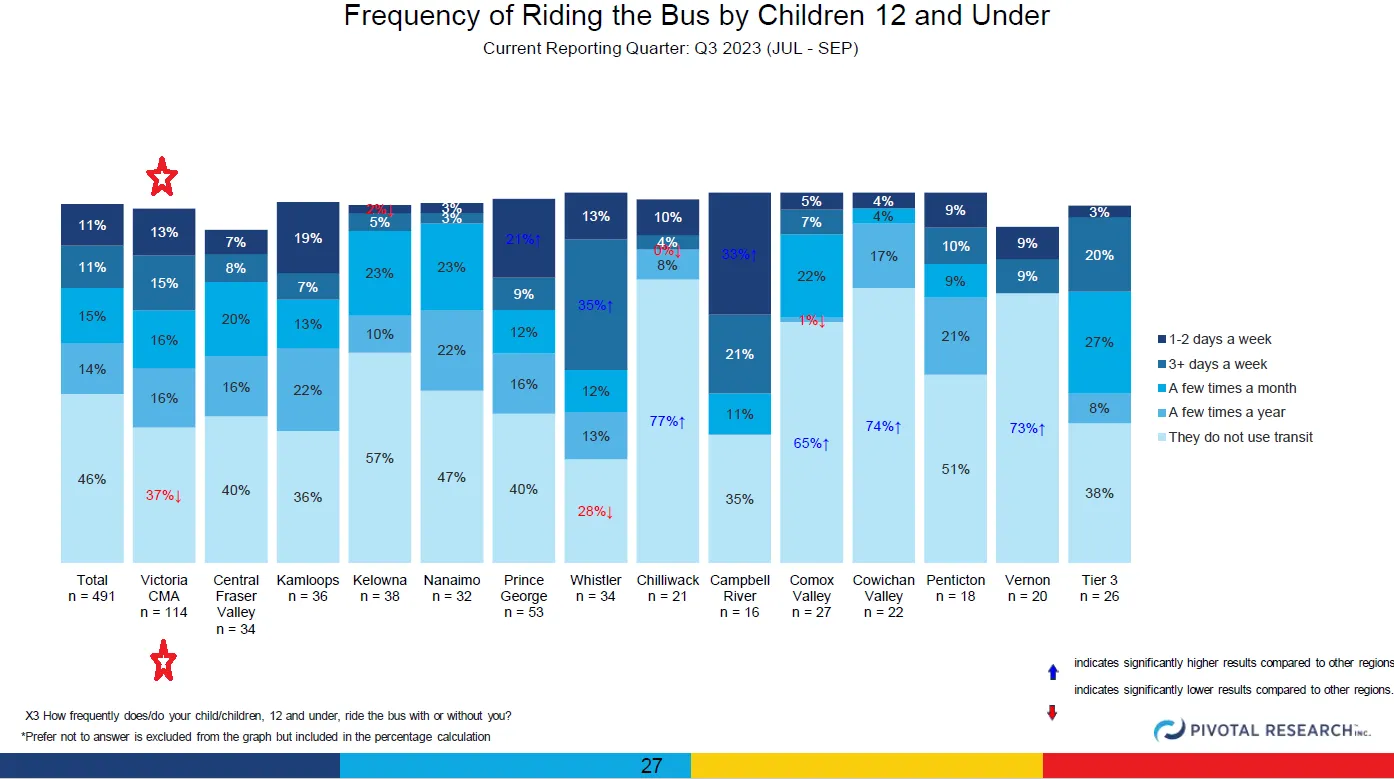
Survey Question: X3 How frequently does/do your child/children, 12 and under, ride the bus with or without you? *Prefer not to answer is excluded from the graph but included in the percentage calculation
Impact of Free Transit on Transit Usage for Children 12 and Under
Current Reporting Quarter: Q3 2023 (JUL - SEP)
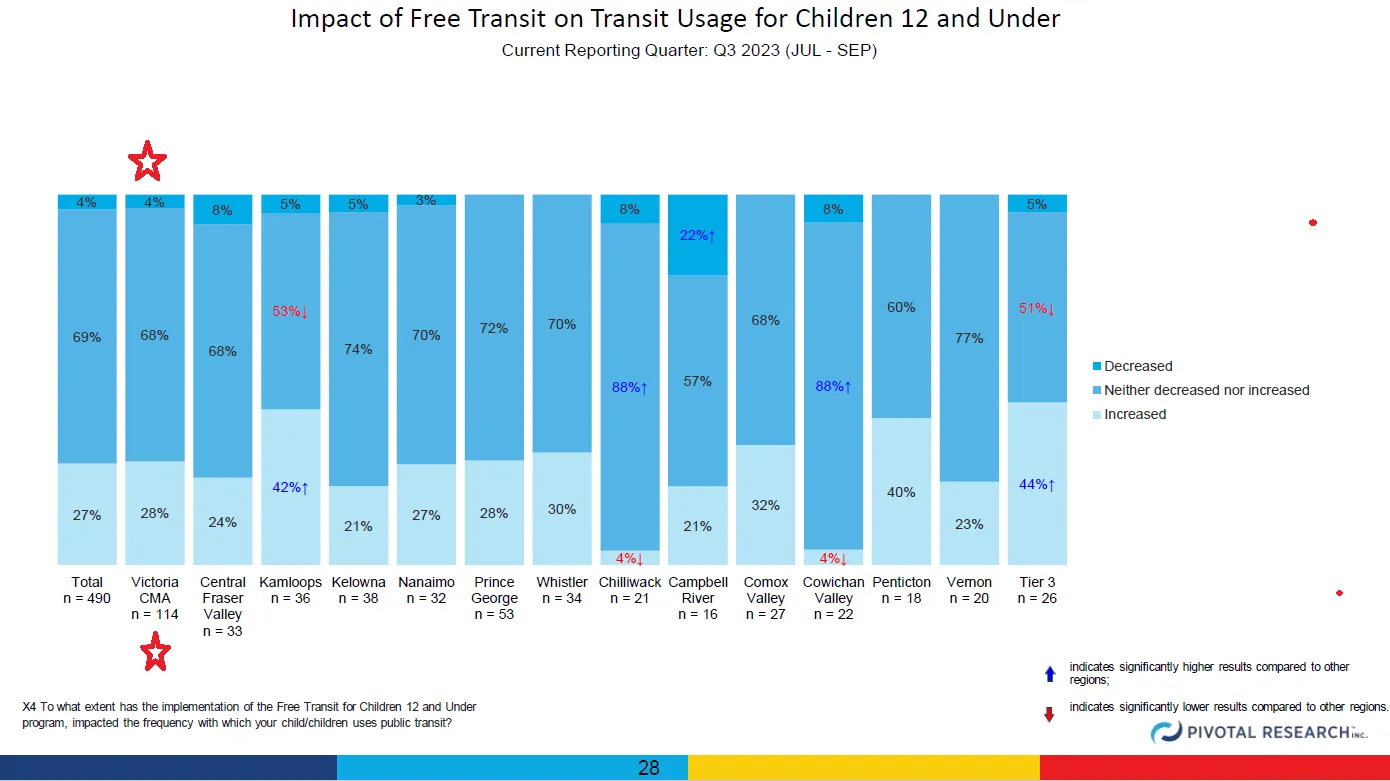
Survey Question: X4 To what extent has the implementation of the Free Transit for Children 12 and Under program, impacted the frequency with which your child/children uses public transit?
Importance of Free Transit for Children 12 and Under
Current Reporting Quarter: Q3 2023 (JUL - SEP)
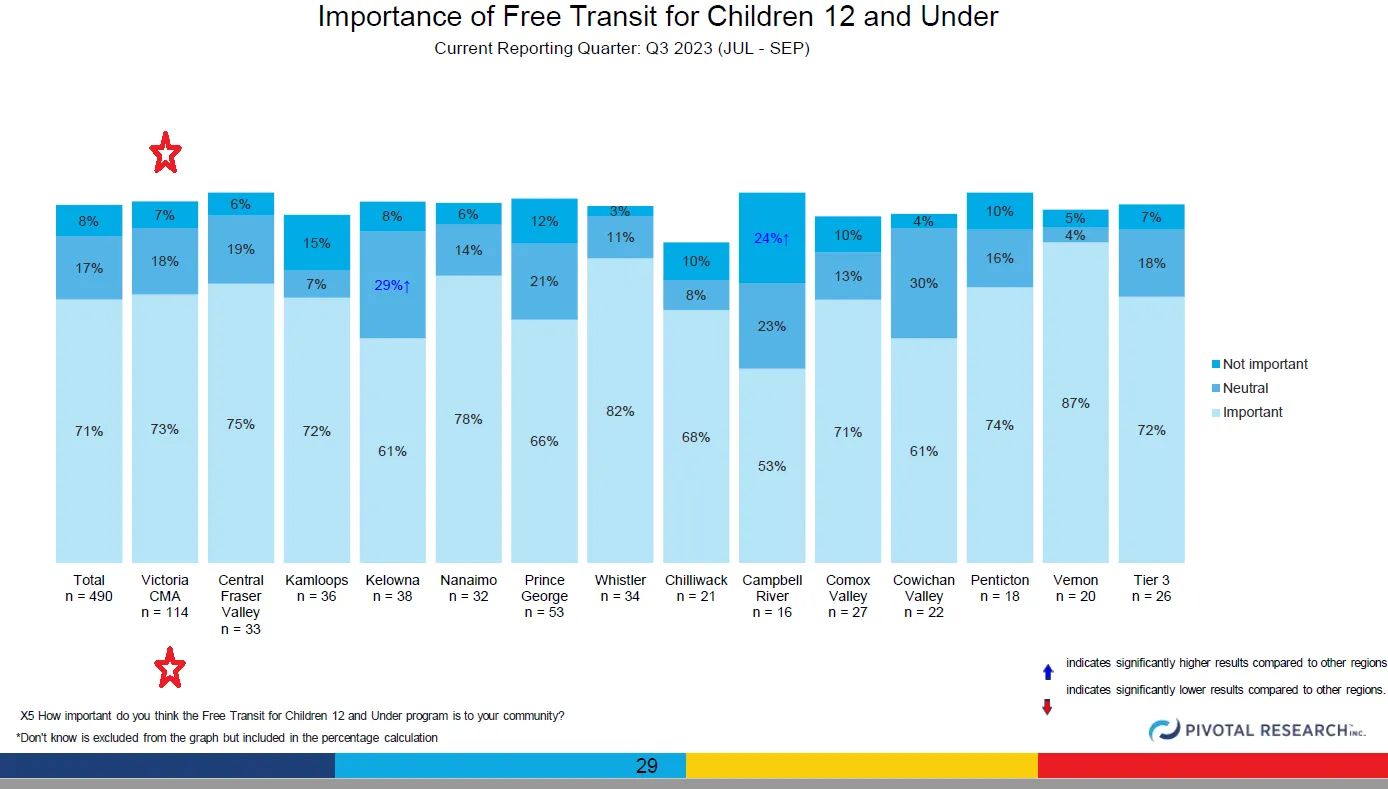
Survey Question: X5 How important do you think the Free Transit for Children 12 and Under program is to your community? *Don't know is excluded from the graph but included in the percentage calculation
Satisfaction of Free Transit for Children 12 and Under
Current Reporting Quarter: Q3 2023 (JUL - SEP)
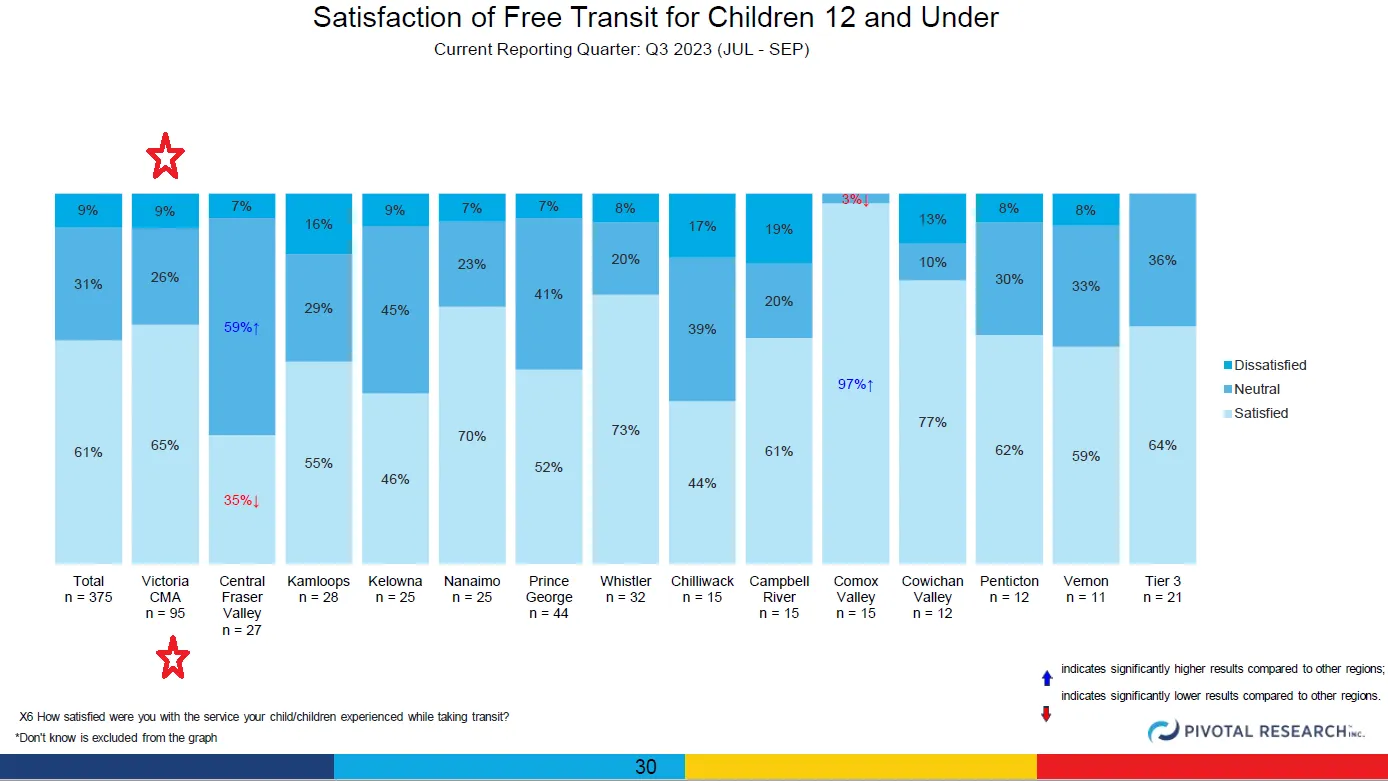
Survey Question: X6 How satisfied were you with the service your child/children experienced while taking transit? *Don't know is excluded from the graph
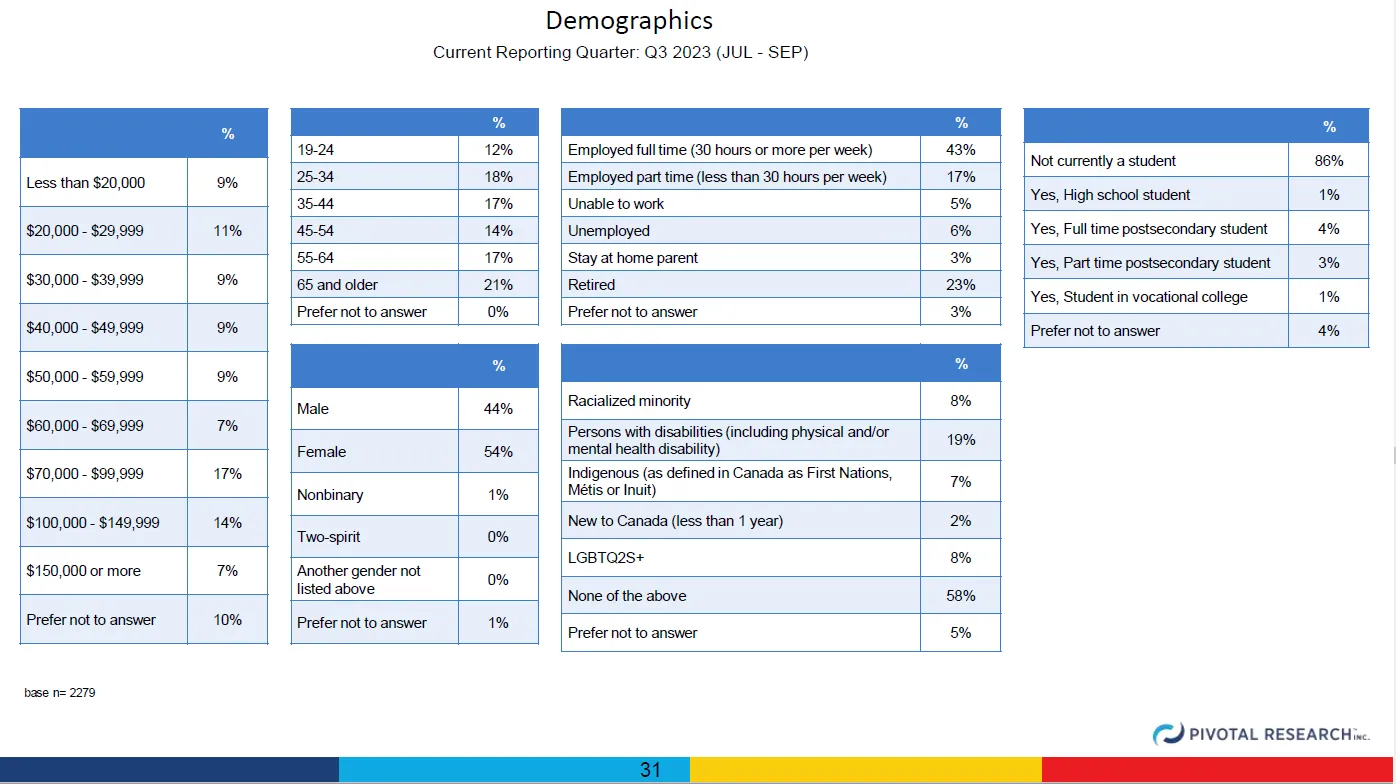
Demographics
Current Reporting Quarter: Q3 2023 (JUL - SEP)
| Income | % |
|---|---|
| Less than $20,000 | 9% |
| $20,000 - $29,999 | 11% |
| $30,000 - $39,999 | 9% |
| $40,000 - $49,999 | 9% |
| $50,000 - $59,999 | 9% |
| $60,000 - $69,999 | 7% |
| $70,000 - $99,999 | 17% |
| $100,000 - $149,999 | 14% |
| $150,000 or more | 7% |
| Prefer not to answer | 10% |
| Age | % |
|---|---|
| 19-24 | 12% |
| 25-34 | 18% |
| 35-44 | 17% |
| 45-54 | 14% |
| 55-64 | 17% |
| 65 and older | 21% |
| Prefer not to answer | 0% |
| Gender | % |
|---|---|
| Male | 44% |
| Female | 54% |
| Nonbinary | 1% |
| Two-spirit | 0% |
| Another gender not listed above | 0% |
| Prefer not to answer | 1% |
| Employment Status | % |
|---|---|
| Employed full time (30 hours or more per week) | 43% |
| Employed part time (less than 30 hours per week) | 17% |
| Unable to work | 5% |
| Unemployed | 6% |
| Stay at home parent | 3% |
| Retired | 23% |
| Prefer not to answer | 3% |
| Background / Identity | % |
|---|---|
| Racialized minority | 8% |
| Persons with disabilities (including physical and/or mental health disability) | 19% |
| Indigenous (as defined in Canada as First Nations, Métis or Inuit) | 7% |
| New to Canada (less than 1 year) | 2% |
| LGBTQ2S+ | 8% |
| None of the above | 58% |
| Prefer not to answer | 5% |
| Student Status | % |
|---|---|
| Not currently a student | 86% |
| Yes, High school student | 1% |
| Yes, Full time postsecondary student | 4% |
| Yes, Part time postsecondary student | 3% |
| Yes, Student in vocational college | 1% |
| Prefer not to answer | 4% |
base n = 2279