TOWN OF VIEW ROYAL COMMUNITY CLIMATE ACTION PLAN 2012
The full community climate plan detailing GHG inventories, forecasts for 2017, and specific reduction initiatives across sectors.
Town of View Royal COMMUNITY CLIMATE ACTION PLAN
For the 2007 Inventory Year 2012

Prepared for: Town of View Royal 45 View Royal Ave. Victoria, BC Canada V9B 1A6
Prepared by: Hyla Environmental Services Ltd. Port Moody, BC Canada (604) 469-2910 rhaycock@hesltd.ca

Acknowledgement
This is a draft document for internal discussion only. The proposed reduction initiatives and the resulting proposed reduction target have not been presented to Council for endorsement.
Staff are gratefully acknowledged for their efforts in the development of this plan.
This study has been produced with the assistance of the Green Municipal Fund, a fund financed by the Government of Canada and administered by the Federation of Canadian Municipalities.
About Hyla Environmental Services Ltd.
HES Ltd. specializes in developing corporate and community energy and emissions plans for municipal government and departments within senior levels of government (regional, provincial, and federal). With over 13 years of dedicated experience to emissions management, HES’ work extends to corporate and community sustainability plans, including integrated community sustainability plans. HES has developed software, Energy and Emissions Reporting and Monitoring System™ (EEMRS™), which is used to calculate emissions, develop emissions forecasts, and integrate account-level management to produce accurate, cost effective emissions management strategies. HES is a leader in this field having completed over 120 corporate energy and emissions inventories and 30 emissions management strategies. As well, HES produced the preliminary community-wide energy and emissions inventories for all municipal governments (189) in British Columbia on behalf of the Province of British Columbia’s Ministry of Environment in 2009.
Acronyms
- CO2 – Carbon Dioxide
- CO2e – Carbon Dioxide Equivalent
- EEMRS™ – Energy and Emissions Monitoring and Reporting System™
- GHG – Greenhouse Gas
- HES – Hyla Environmental Services Ltd.
Executive Summary
Climate change is a global problem that requires local solutions. Local government across Canada have adopted a coordinated response to mitigate and manage greenhouse gas (GHG) emissions by integrating energy and carbon management into the municipal planning process.
The Community Climate Action Plan is being developed to meet Provincial Bill 27 requirements and the Town’s voluntary commitments to the Federation of Canadian Municipalities’ Partners for Climate Protection; and, the Provincial Climate Action Charter.
The scope of the community inventory for energy and GHG emissions covers residential buildings, commercial buildings, community transportation, and community solid waste. The inventory does not include air, water, and rail in the transportation sector nor agriculture and sequestration from trees.
Though Bill 27 only requires local governments in British Columbia to include GHG reduction targets in Official Community Plans, the Town is committed to developing both corporate and community GHG emissions plans. The Town’s corporate energy and emissions plan was endorsed by Council in the spring of 2011.

Inventory Summary
In the 2007 base year, greenhouse gas emissions from the Town of View Royal’s community totalled 32,314 tonnes CO2e. On Road Transportation made up the greatest percent of GHG emissions at 69 percent.
Forecast Summary
A forecast of GHG emissions for the 2017 target year was developed using the best available data. Overall GHG emissions are expected to increase by one percent to 32,753 tonnes CO2e (Table E1). Forecast emission increases have been moderated by zero GHG emissions from all electricity supplied by BC Hydro and the implementation of federal climate change legislation such as a tailpipe emissions standard.
Table E1 - GHG Emissions Forecast
| Forecasted Parameter | Base Year 2007 | Forecast Year 2017 | Percent Increase 2007 - 2017 |
|---|---|---|---|
| Emissions (tonnes CO2e) | 32,315 | 32,753 | 1% |
Reduction Target Summary
The reduction target for the Town’s community initiative is based on a ten-year period in accordance with the Federation of Canadian Municipalities’ (FCM) PCP Program. With the Town’s chosen base year of 2007 the target year is 2017, leaving the Town a five year (2012-2017) period to implement this plan.
The majority of the community’s potential reduction initiatives are achieved in the on-road transportation sector through the implementation of a tailpipe emissions standard and reductions in vehicle use through increased transit use, walking, and cycling.
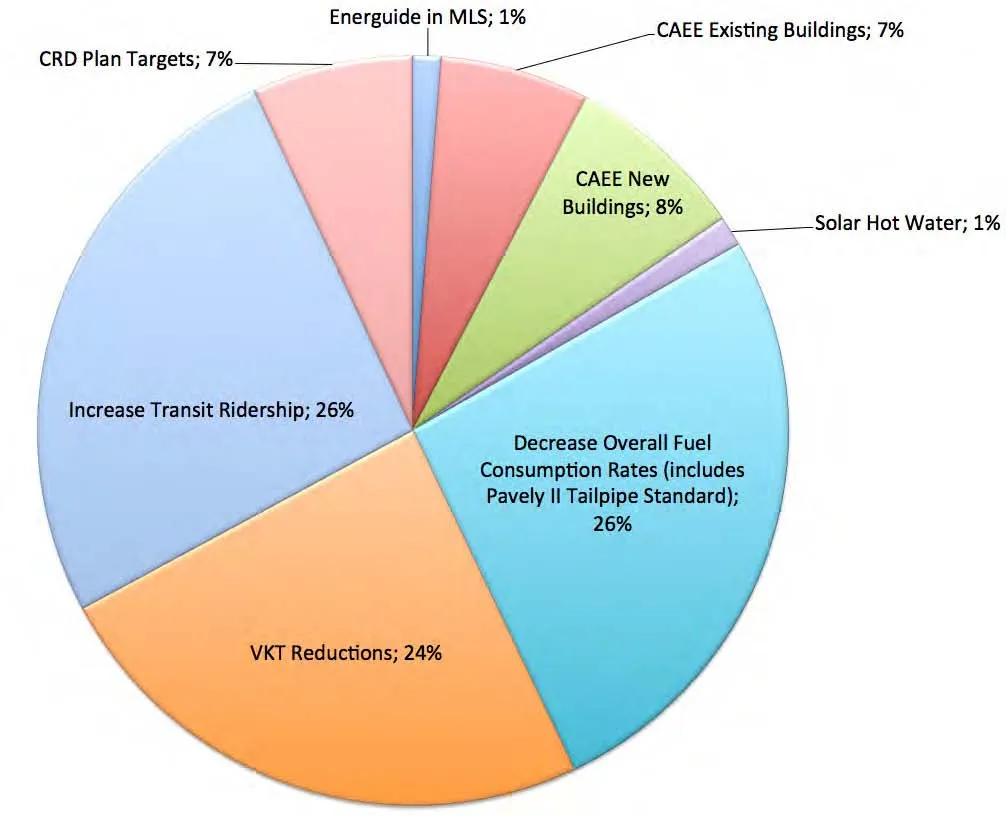
By implementing the initiatives described in this report, the Town of View Royal would be able to reduce GHG emissions by 12 percent below 2007 levels by 2017. See the pie chart for a breakdown of categories of reduction initiatives (Chart E1) and Table E2 for a summary of the potential reductions in each community sector.
Chart E1 - Breakout of Reduction Initiatives
Table E2 - Reduction Initiatives
| Sector | Reduction Initiative | Level of Government | Reduction Quantity GHGs (t CO2e) | Percent of Total Reductions | Cost | Level of Effectiveness | Priority |
|---|---|---|---|---|---|---|---|
| Buildings | New Buildings Targets | Municipal with Financial Resources | 294 | 8% | L | H | 1 |
| EnerGuide Rating in Multiple Listing Service (MLS) Advertising | Senior Government | 46 | 1% | L | L | 3 | |
| Existing Buildings Targets | Municipal with Financial Resources | 242 | 7% | L | L | 2 | |
| Solar Hot Water | Municipal with Financial Resources | 49 | 1% | M | L | 4 | |
| Subtotal | 631 | ||||||
| On Road Transportation | Decrease Overall Fuel Consumption Rates (includes Pavely II Tailpipe Standard) | Senior Government plus ‘encouragement’ from View Royal | 987 | 26% | L | H | 1 |
| VKT Reductions | Shared | 912 | 24% | H | H | 2 | |
| Increase Transit Ridership | Shared | 977 | 26% | H | H | 2 | |
| Subtotal | 3,507 | ||||||
| Solid Waste | CRD Plan Targets | Shared | 262 | 7% | H | H | 1 |
| Subtotal | 262 | ||||||
| Total | 4,400 | 100% |
Level of Effectiveness: H = High (3% or greater, except when noted); M = Moderate 2%; L = Low (1% or less); U = Unknown Cost: H = $100,000’s; M = $10,000’s; L = $1,000’s; U = Unknown; N/A = None (senior government) NOTE: Priority 1 is assigned to initiatives with low costs and high effectiveness whereas lower priorities are assigned to initiatives with higher costs and less effectiveness. Where costs are incurred by senior government (e.g., transit improvements), and the effectiveness is high, higher priority has been assigned.
Community Reduction Target Statement:
The Town’s reduction target statement is:
An emission reduction target of ~4,400 tonnes CO2e is recommended for the Town of View Royal. This reduction amount will decrease community emissions 12 percent below 2007 levels by 2017.
The reduction target of 12 percent is separated into sectors in Table E3. The greatest proportion of reductions are from the on road transportation sector.
Table E3 - Reduction Initiatives
| Sector | Base Year Emissions (2007) Tonnes CO2e | Projected GHG Emissions with Legislation (2017) Tonnes CO2e | Potential GHG Emission Reductions Tonnes CO2e | GHG Emissions After Plan Implementation Tonnes CO2e | Percent Reduction of Projected Emissions |
|---|---|---|---|---|---|
| Residential Buildings | 3,860 | 3,670 | 631 | 3,039 | -21% |
| Commercial Buildings | 5,986 | 5,518 | 5,518 | -8% | |
| On Road Transportation | 22,119 | 23,216 | 3,507 | 19,086 | -14% |
| Solid Waste | 349 | 349 | 262 | 87 | -75.0% |
| Total | 32,314 | 32,753 | 4,400 | 28,353 | -12% |
1 Introduction, Inventory, and Forecast
This document describes the Town’s community inventory of energy consumption and GHG emissions, provides a forecast of GHG emissions, and identifies potential GHG emissions reduction actions. The actions suggested are for buildings, land use, transportation, and solid waste; however, many land use decisions mentioned in this report are long term strategies covered in the Town’s OCP.
1.1 Introduction
The Town of View Royal’s Climate Action plan will be used by staff as an information, consultation, and implementation paper. The information outlined herein will complement work already completed for the Town’s Corporate Energy and GHG Emissions Plan (2011) and supports the GHG reduction target embedded in the Town’s Official Community Plan (OCP).

1.1.1 Scope
Hyla Environmental Services (HES) was hired by the Town to undertake the development of the Community Climate Action Plan. The scope of this document is to:
- Provide a framework for the Plan;
- Develop a forecast of emissions for the 2017 target year;
- Include legislated changes that will occur prior to the 2017 target year in the forecast;
- Identify reduction initiatives that will be undertaken by senior government;
- Identify reduction initiatives that will be undertaken by the Town, including identification of initiatives that will require additional resources, and initiatives that can be undertaken with existing resources;
- Where possible, provide coarse estimates of resource requirements for reduction initiatives that can be undertaken by the Town;
- Outline the monitoring program to be considered by the Town; and,
- Provide an implementation matrix.
1.1.3 Consultation Process
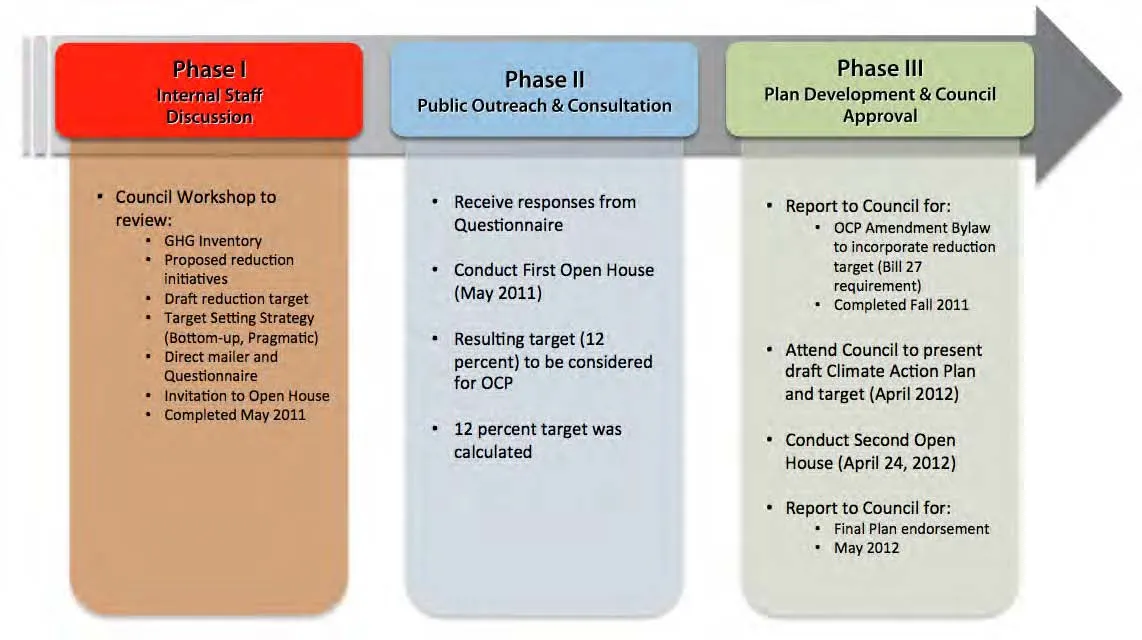
The development of the Final Climate Action Plan coincided with a stakeholder and public consultation process designed to gather comments and responses from interested Town residents and business owners. Figure 1.1 represents the process for plan development which includes stakeholder and public consultation.
1.1.4 Regional and Local Context
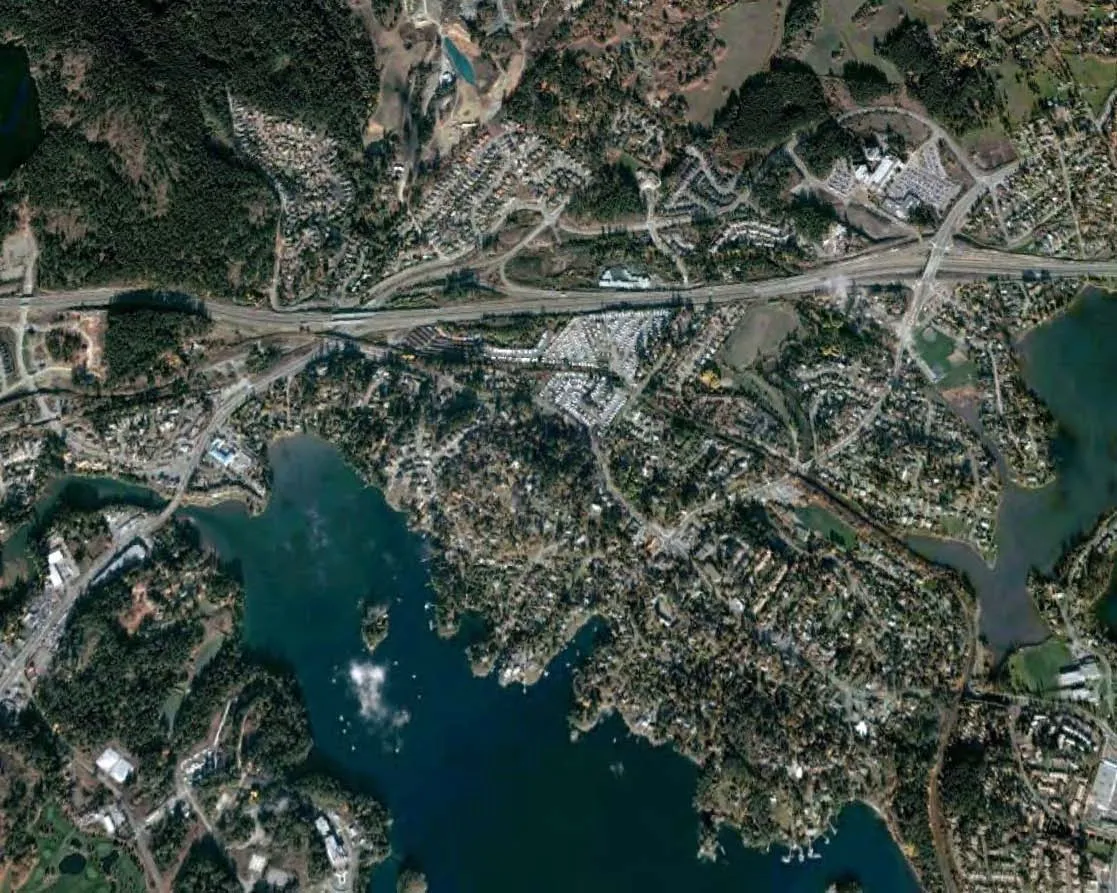
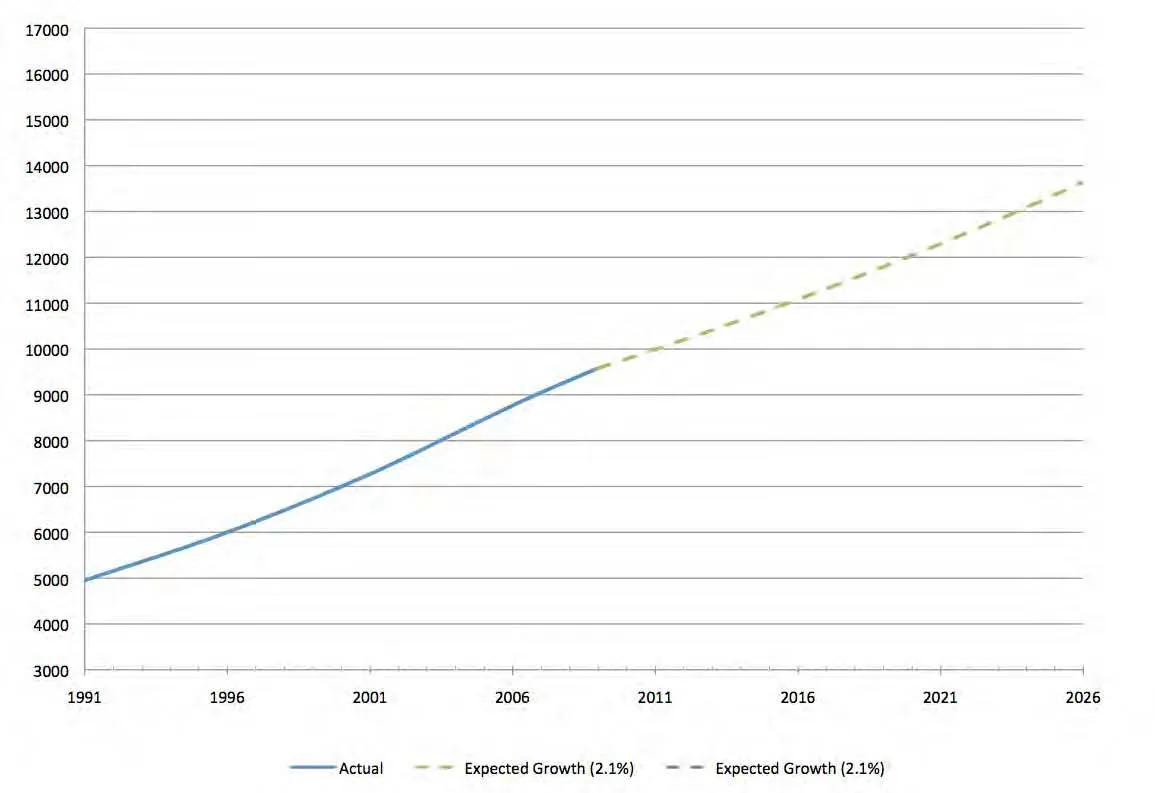
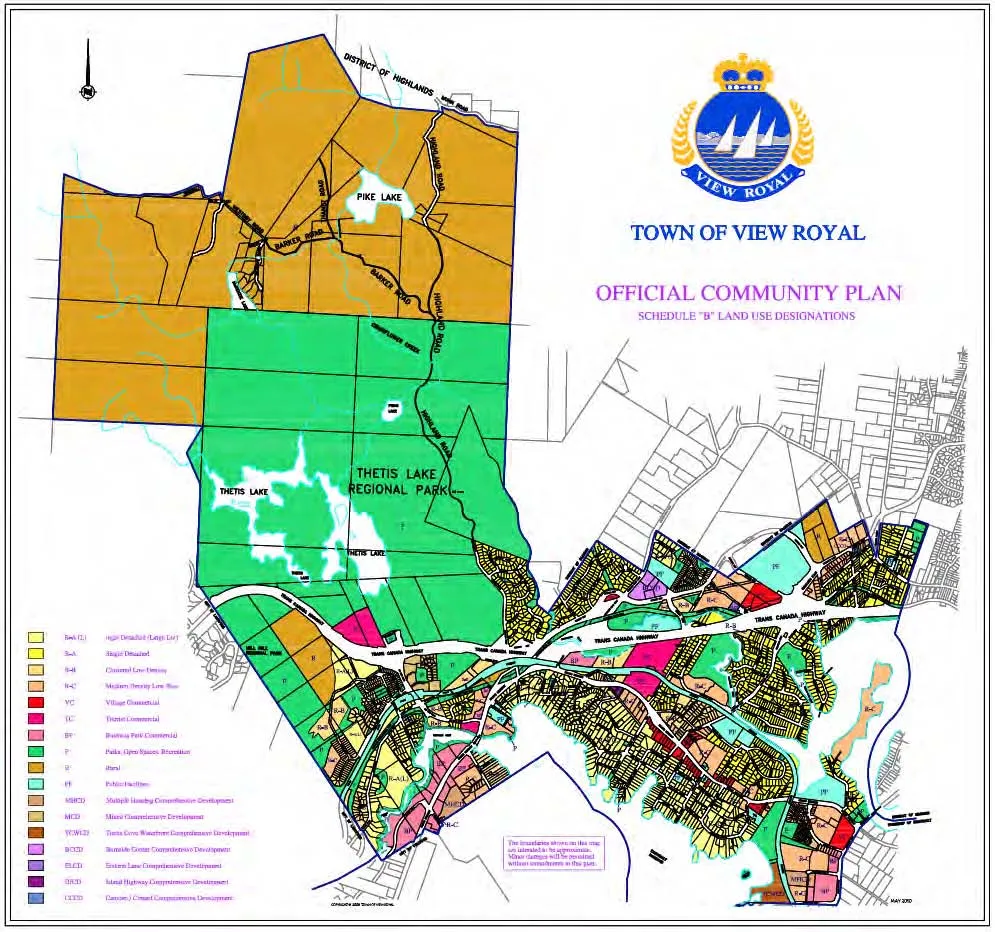
View Royal is a small, but rapidly growing community with a population of just over 9,000. The municipality covers an area of just over 16 square kilometres (Figure 1.2); however, development is not distributed equally through the town: the southern, waterfront portion is much more highly developed and the northern portion is mainly parkland and rural lots.
1.2 Community Energy and GHG Inventory
1.2.2 Community Inventory by Sector
Table 1.1 - Community Energy and Emissions by Sector (2007)
| Sector | Total Energy (GJ) | Total Emissions (CO2e tonnes) | Percent Energy | Percent Emissions |
|---|---|---|---|---|
| Buildings | 499,320 | 9,846 | 63% | 30% |
| On Road Transportation | 298,159 | 22,119 | 37% | 68% |
| Solid Waste | 349 | 0% | 1% | |
| Total | 797,479 | 32,314 | 100% | 100% |
1.2.3 Community Inventory by Emissions Source
Table 1.2 - Community Emission Sources (2007)
| Energy Type | Total Consumption | Total GJ | Percent Energy | Total Emissions (CO2e tonnes) | Percent Emissions |
|---|---|---|---|---|---|
| Electricity | 82,564,819 kWh | 297,233 | 37% | 2,147 | 7% |
| Natural Gas | 201,100 GJ | 201,100 | 25% | 7,541 | 23% |
| Fuel Oil | 22,912 litres | 886 | 0% | 65 | 0% |
| Propane | 31,140 litres | 788 | 0% | 736 | 2% |
| Gasoline | 8,145,488 litres | 282,323 | 35% | 20,387 | 63% |
| Diesel Fuel | 391,647 litres | 15,149 | 2% | 1,089 | 3% |
| Solid Waste | 349 | 1% | |||
| Total | 797,479 | 100% | 32,314 | 100% |
1.2.4 Community Buildings Energy and Emissions Inventory
1.2.7 On Road Transportation Energy and Emissions Inventory
Table 1.7 - Community Energy Consumption and GHG Emissions Summary
| Sector | Energy Type/Unit | Consumption | Energy (GJ) | GHG Emissions (Tonnes of CO2e) 2007 |
|---|---|---|---|---|
| Buildings | ||||
| Residential Buildings | Elect | 51,173,622 kWh | 184,225 | 1,331 |
| Nat Gas | 63,235 GJ | 63,235 | 2,371 | |
| Fuel Oil | 22,912 L | 886 | 65 | |
| Propane | 3,959 L | 100 | 94 | |
| Subtotal | 3,860 | |||
| Commercial Buildings | Elect | 31,391,197 kWh | 113,008 | 816 |
| Nat Gas | 137,865 GJ | 137,865 | 5,170 | |
| Subtotal | 5,986 | |||
| On Road Transportation | Gasoline | 8,145,488 L | 282,323 | 20,387 |
| Diesel | 391,647 L | 15,149 | 1,089 | |
| Propane | 27,181 GJ | 688 | 642 | |
| Subtotal | 22,119 | |||
| Solid Waste | Tonnes | NA | NA | 349 |
| TOTAL | 797,479 GJ | 32,314 t |
1.3 Community Forecasts
2 Reduction Initiatives
2.3 Community Buildings
2.3.2 Local Government Policy and Programs
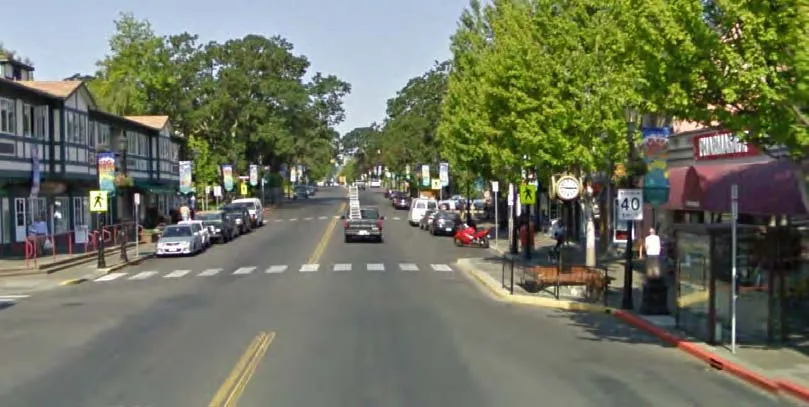
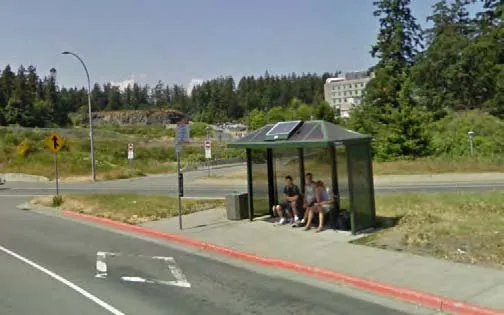
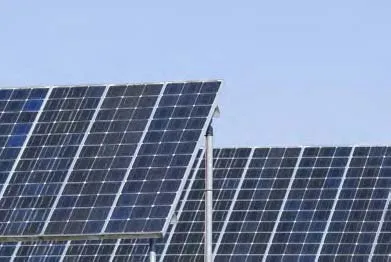
Table 2.5 - GHG Reductions from Solar Hot Water
| Reduction Initiative | Level of Government | Energy Savings (GJ) | Energy Cost Savings | GHG Reductions (t CO2e) |
|---|---|---|---|---|
| Solar Hot Water | Municipality With Financial Resources | 1,832 | $20,161 | 49 |
Local building efficiency actions:
- Upgrade Windows: Responsibility: Municipal; Funding: Provincial/Federal or TBD. Energy efficient windows can substantially reduce the cost of heating as 33 percent of heat is lost through single paned windows.
- Weatherize Homes: Responsibility: Municipal; Funding: Provincial/Federal or TBD. Simple measures like sealing cracks and weather stripping can reduce CO2 leakage and heat loss.
- Install Low Flow Shower Heads & Faucets: Responsibility: Municipal; Funding: Provincial/Federal or TBD. These reduce the use of hot water and thus decrease energy use and GHG emissions.
- Encourage Lowering Building Temperature at Night: Responsibility: Municipal; Funding: Provincial/Federal or TBD. Lowering temperature by just a few degrees at night can have a large impact on energy use.
- Shorten Showers: Responsibility: Municipal; Funding: Provincial/Federal or TBD. Reducing shower length can help reduce hot water use. Aim for uptake by 30% of households.
- Use Cold Water for Washing Clothes: Responsibility: Municipal; Funding: Provincial/Federal or TBD. Not using hot water saves energy and reduces GHG emissions. Aim for uptake by 30% of households.
- Use Energy-Saving Setting to Dry Dishes: Responsibility: Municipal; Funding: Provincial/Federal or TBD. Air drying requires no additional energy. Aim for uptake by 30% of households.
- Turn Off Lights When Not in Use: Responsibility: Municipal; Funding: Provincial/Federal or TBD. Aim for uptake by 30% of households.
- Turn Off Electronics When Not in Use: Responsibility: Municipal; Funding: Provincial/Federal or TBD. Aim for uptake by 30% of households.
- Get Rid of Second Fridge: Responsibility: Municipal; Funding: Provincial/Federal or TBD. The City should encourage households to get rid of older, less efficient models.
2.4 Land use and Urban Design
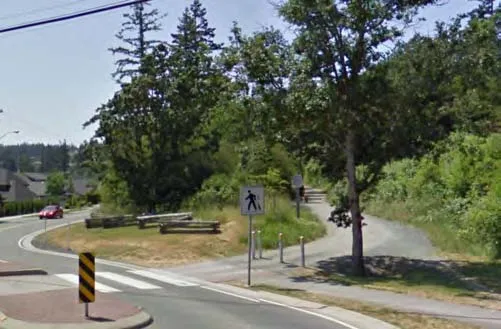
2.5 Community Transportation


3 Implementation, Monitoring & Reporting, and Resources
3.1 Implementation
Table 3.1 - Implementation (Excerpts)
| Reduction Category | Reduction Subcategory | Recommendation | Action | Priority | Resources Required | Year |
|---|---|---|---|---|---|---|
| Community Buildings – Senior Government Policy and Programs – Federal Government | EnerGuide rating in Multiple Listing Service (MLS) Advertising | The Town is participating in the CRD’s pilot to encourage EnerGuide ratings in MLS property listings. | 1 | N/A | Make public aware of audits | |
| Community Buildings – Local Government Policy and Programs – Existing Buildings Targets | Improvements to Management and Operations Practices | Promote changes to the management and operations practices for existing commercial and industrial buildings. | Staff query to Ministry of Energy, Mines and Petroleum Resources regarding provincial program and Council report to join if and when program has resources. Otherwise, promotional materials from BC Hydro and Fortis BC to be utilized. | 1 | Existing staff. Provincial funds to implement as proposed by staff in response to funding calls | 2012 |
| Community Buildings – Local Government Policy and Programs – CAEE New Buildings Targets | Energy Efficient Construction | Encourage energy efficient construction. For instance, encourage the use of recyclable materials during construction, and the installation of energy efficient appliances in new building. | Undertake Supporting Programs Education (SPE) seminar for staff's outreach to community | 1 | Local consultant to develop ($1K - $3K) | 2012 |
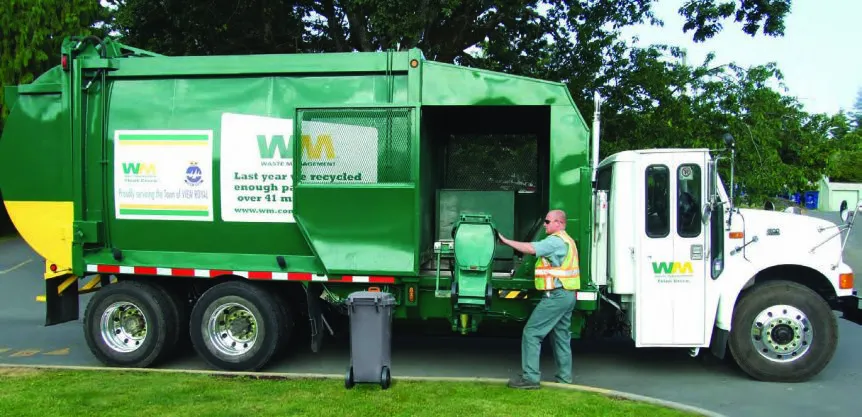
Appendix II - Residential Garbage and Household Food Waste Collection
Appendix III - Community Comparisons
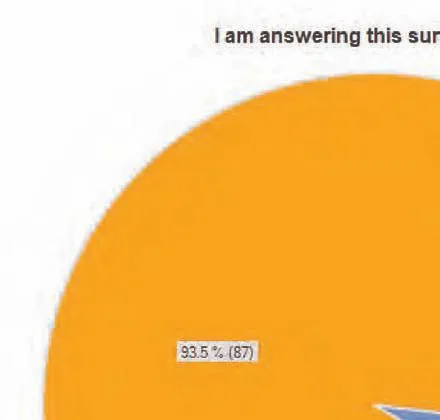
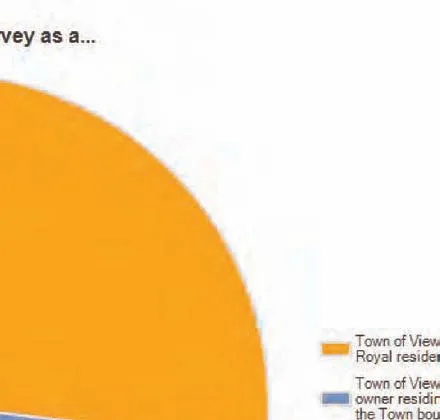
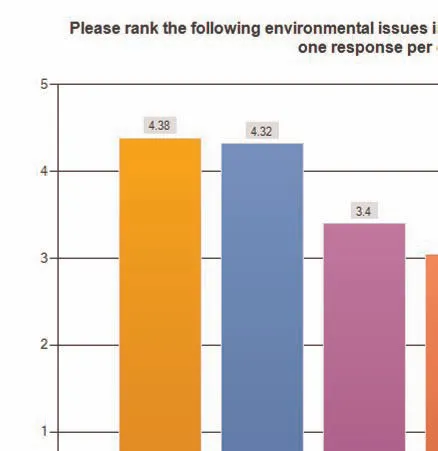
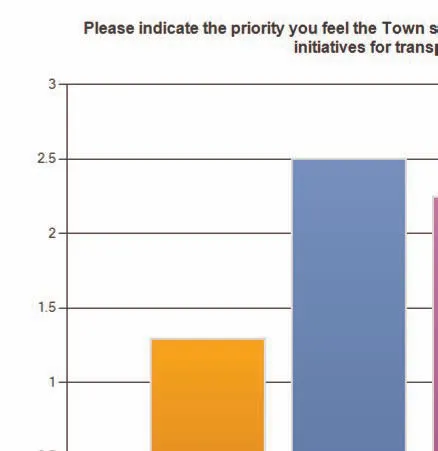
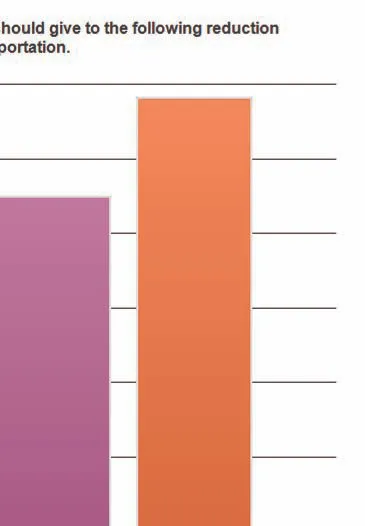
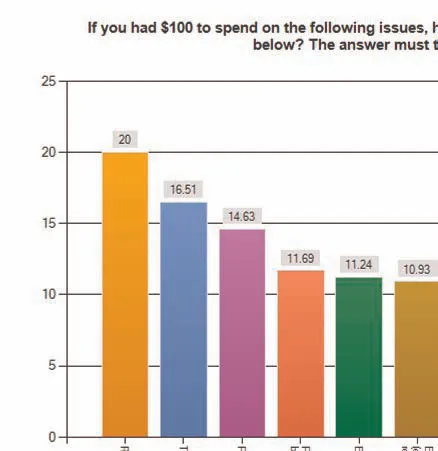
Appendix V - Climate Action Questionnaire Results
Appendix VI - Official Community Plan Map

Document Images
(32)

Close-up of vibrant purple flowers

A wide landscape view of forested mountains and valleys

Close-up of a ripening apple on a branch
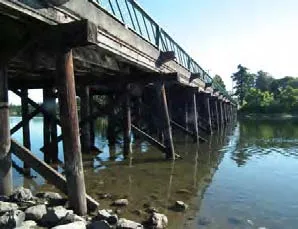
Low angle view of a wooden pier or bridge extending over water


Chart 1.1 - Donut chart of Consumption by Sector: Buildings 62.6% and On Road Transportation 37.4%

Chart 1.2 - Donut chart of Emissions by Sector: On Road Transportation 68.5%, Buildings 30.5%, and Solid Waste 1.1%

Chart 1.3 - Consumption by Source donut chart with Electricity at 37.3%, Natural Gas 25.2%, and Gasoline 35.4%

Chart 1.4 - Emissions by Source donut chart with Gasoline at 63.1% and Natural Gas 23.3%

Chart 1.5 - Consumption by Building Subsector: Residential Buildings 50.2% and Commercial Buildings 49.8%

Chart 1.6 - Emissions by Building Subsector: Commercial Buildings 60.8% and Residential Buildings 39.2%

Chart 1.7 - Energy Consumption by Vehicle Class: Light Trucks, Vans, and SUVs 49.3%, Small Passenger Cars 27.9%, Large Passenger Cars 16.9%
A BC Transit double-decker bus on the road

Map 2.7 - Distance to Commercial Areas showing areas within 100, 200, 300, and 400 metres of commercial locations

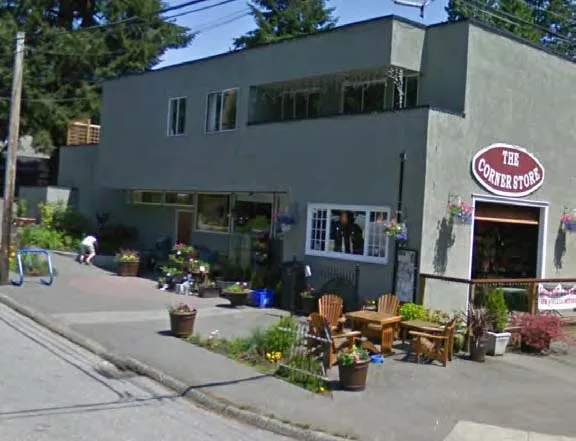
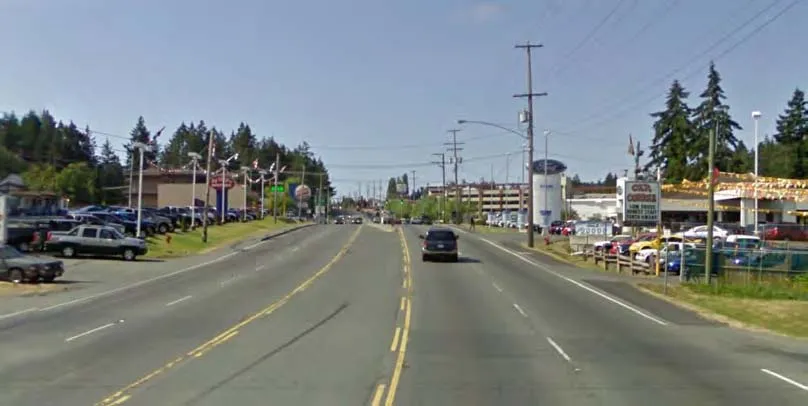
Figure 2.3 - Top: Photo of a pedestrian friendly development with wide sidewalks and transit shelters. Bottom: Photo of an automobile oriented development with large parking lots and wide roads.

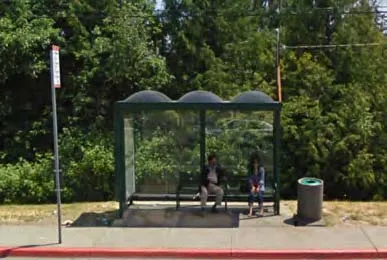
Figure 2.4 - Transit Shelter near Trans Canada Highway showing a modern glass shelter

Map 2.8 - Percentage of People Who Commute to Work by Public Transit by census area, ranging from 6% to 16%

Map 2.9 - Distance to Public Transit showing areas within 100 to 400 metres of a transit route

Figure 2.6 - Proposed Victoria Region 25 Year Transit Network map showing rapid and frequent transit networks
Figure A3 - Bar chart comparing Apartments with fewer than 5 stories across BC municipalities
Figure A6 - Bar chart comparing Private Vehicle to Work percentages across BC municipalities

Q1 pie chart - 93.5% (87) of respondents were Town of View Royal residents; 6.5% (6) were business owners

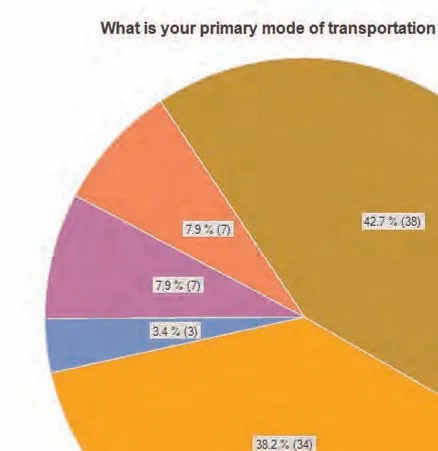
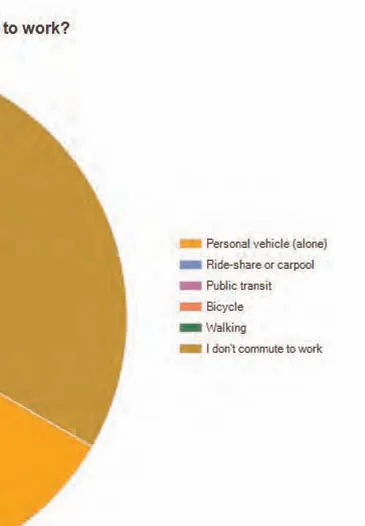
Q5 pie chart - Primary mode of transportation to work: Personal vehicle alone (42.7%), Public transit (38.2%), Bicycle (7.9%), Ride-share (7.9%), Walking (3.4%)

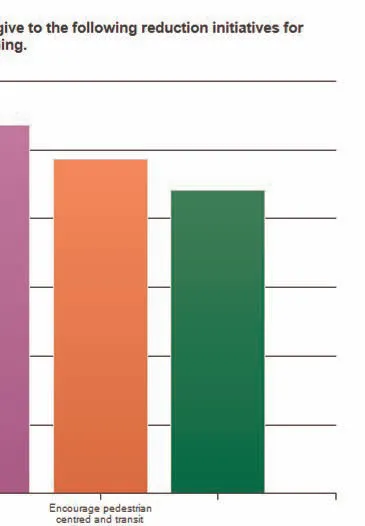
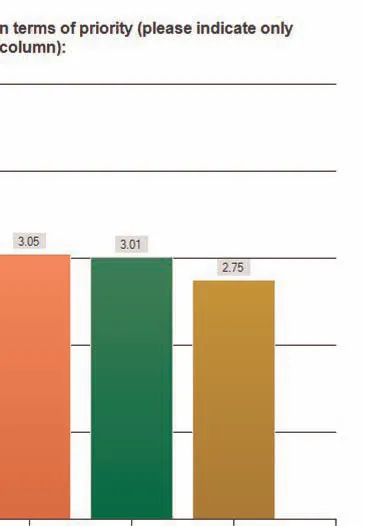
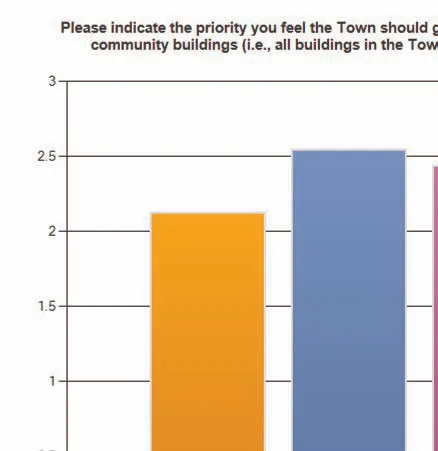
Q11 bar chart - Priorities for community building initiatives
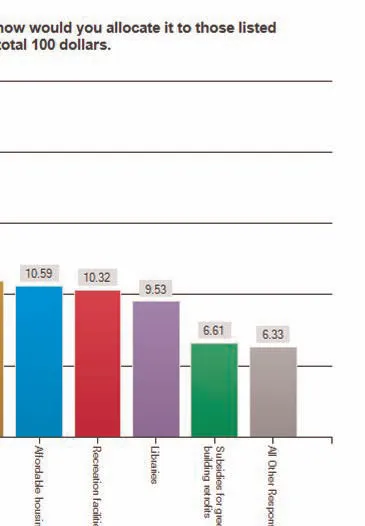
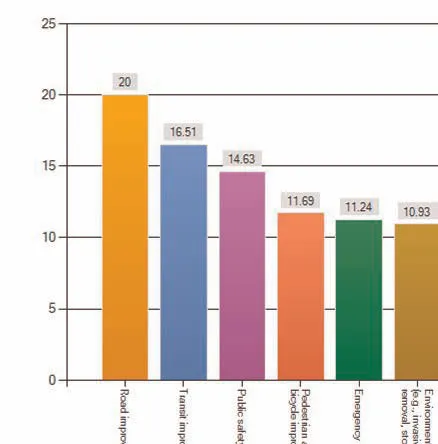
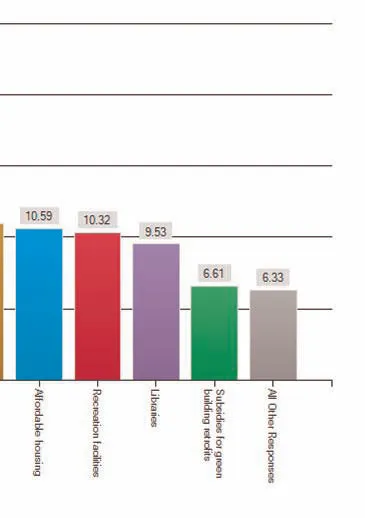
Q14 bar chart (Part 1) - $100 spending allocation: Road improvements $20.00, Transit improvements $16.51, Public safety $14.63
A green Waste Management truck collecting a curbside bin
Garbage Regulations infographic showing "YES" items: non-recyclables, plastic wrap, foil pouches, broken glass, etc.