WEST SHORE PARKS AND RECREATION SOCIETY Financial Statements (Dec 31, 2011)
Audited financial statements including statement of operations and cash flows for the 2011 fiscal year.
Financial Statements of
WEST SHORE PARKS AND RECREATION SOCIETY
Year ended December 31, 2011
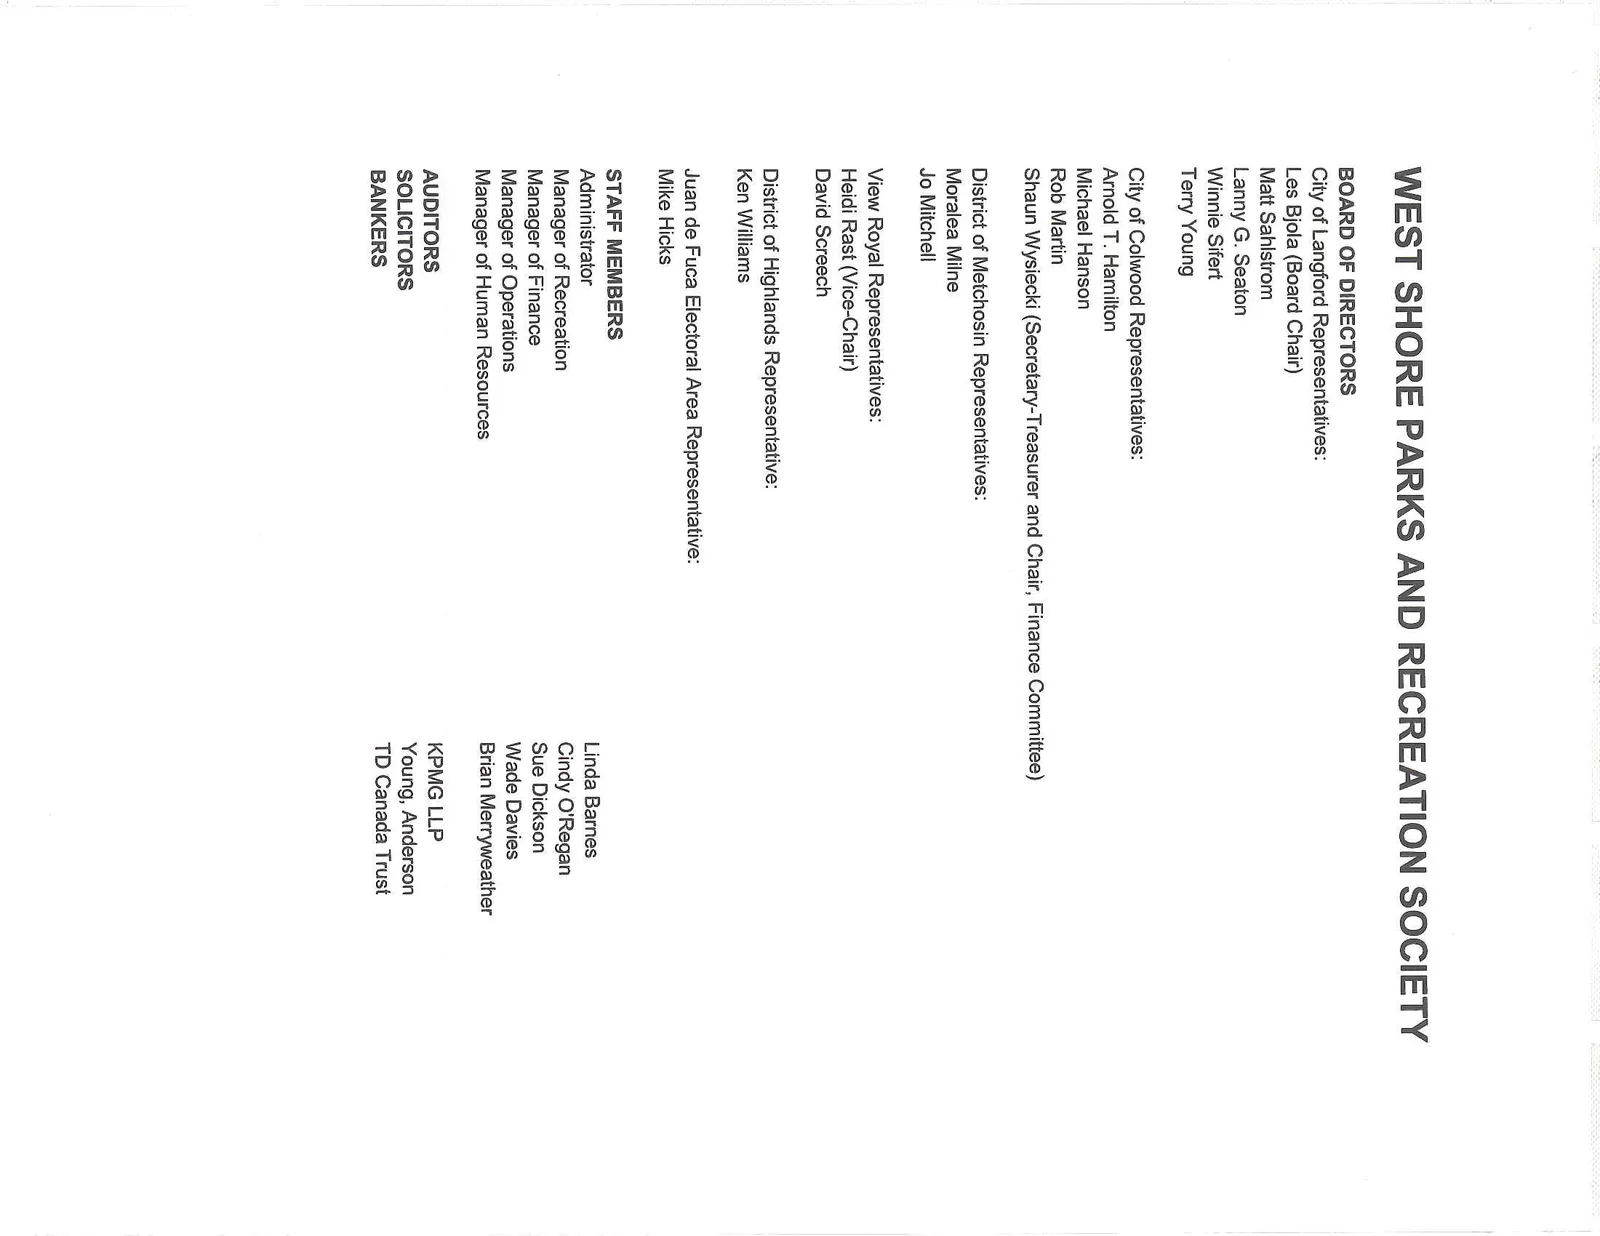
BOARD OF DIRECTORS
City of Langford Representatives:
- Les Bjola (Board Chair)
- Matt Sahlstrom
- Lanny G. Seaton
- Winnie Sifert
- Terry Young
City of Colwood Representatives:
- Arnold T. Hamilton
- Michael Hanson
- Rob Martin
- Shaun Wysiecki (Secretary-Treasurer and Chair, Finance Committee)
District of Metchosin Representatives:
- Moralea Milne
- Jo Mitchell
View Royal Representatives:
- Heidi Rast (Vice-Chair)
- David Screech
District of Highlands Representative:
- Ken Williams
Juan de Fuca Electoral Area Representative:
- Mike Hicks
STAFF MEMBERS
- Administrator: Linda Barnes
- Manager of Recreation: Cindy O'Regan
- Manager of Finance: Sue Dickson
- Manager of Operations: Wade Davies
- Manager of Human Resources: Brian Merryweather
AUDITORS: KPMG LLP SOLICITORS: Young, Anderson BANKERS: TD Canada Trust
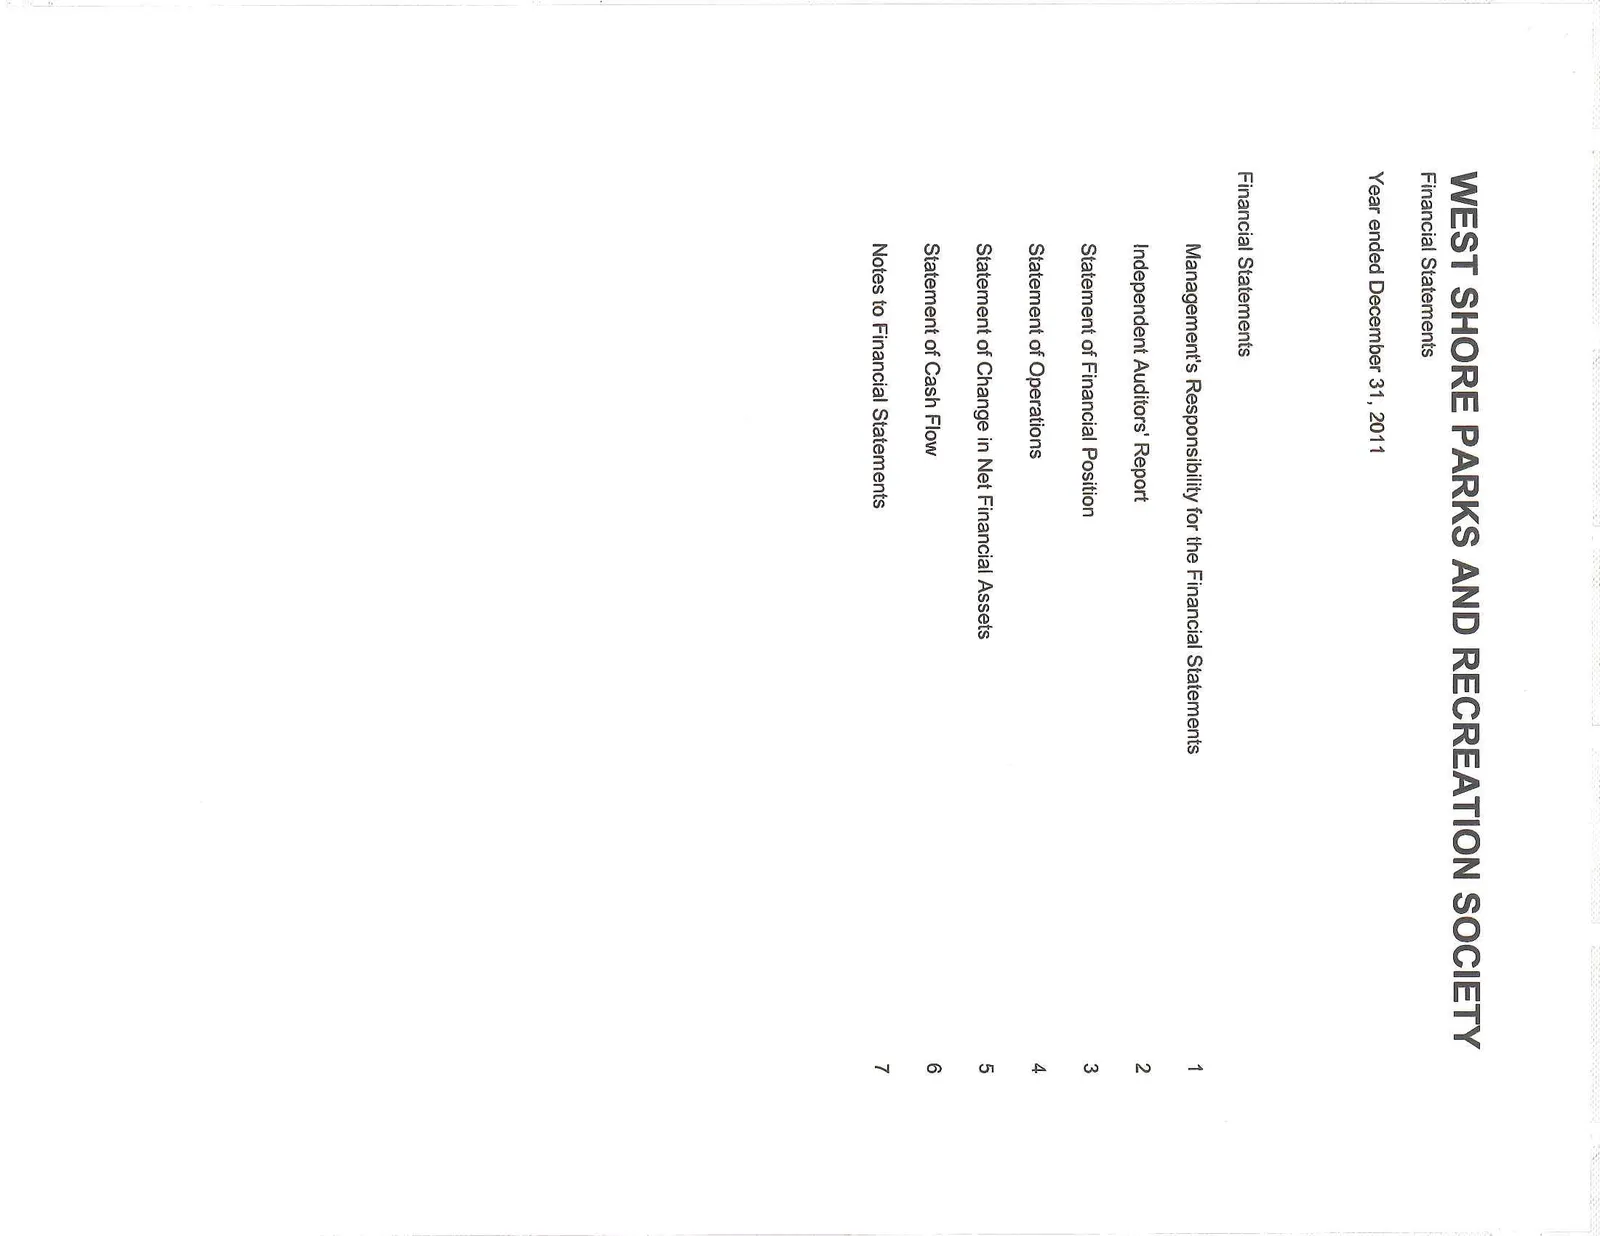
TABLE OF CONTENTS
| Financial Statements | Page |
|---|---|
| Management's Responsibility for the Financial Statements | 1 |
| Independent Auditors' Report | 2 |
| Statement of Financial Position | 3 |
| Statement of Operations | 4 |
| Statement of Change in Net Financial Assets | 5 |
| Statement of Cash Flow | 6 |
| Notes to Financial Statements | 7 |
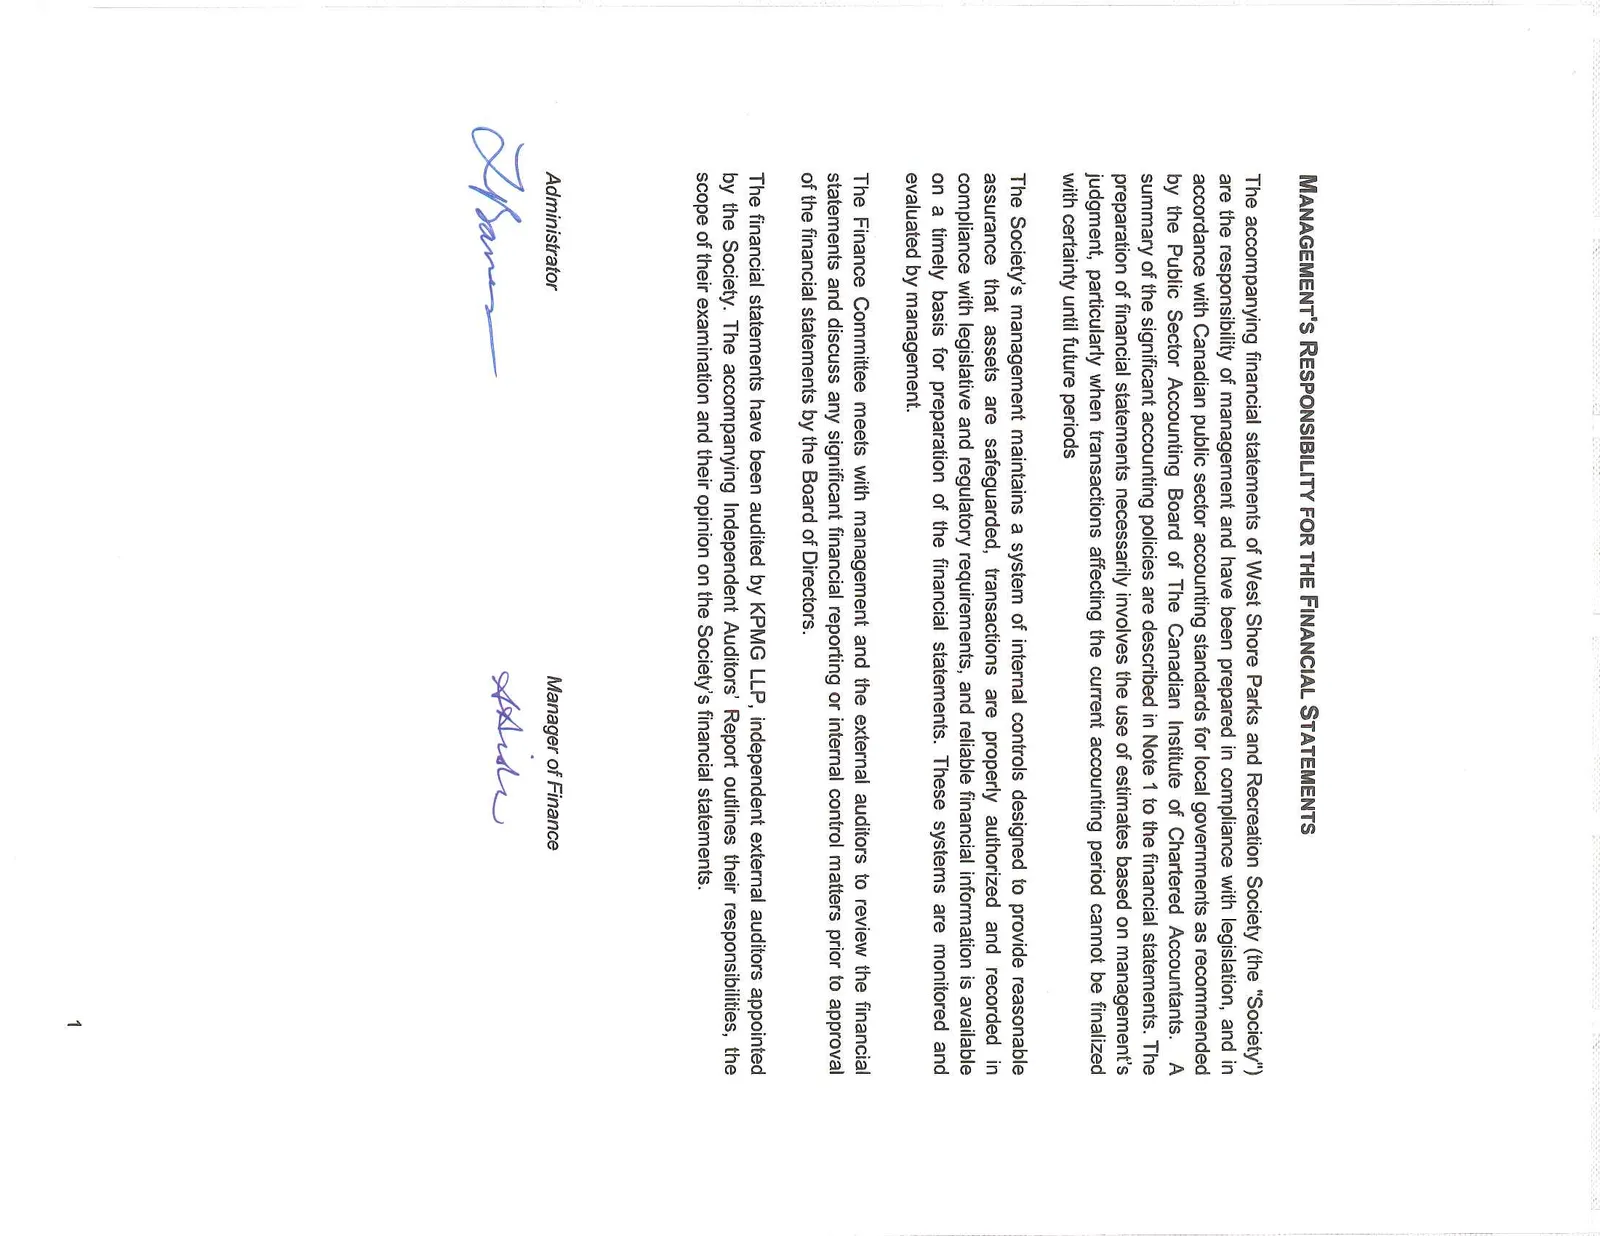
MANAGEMENT'S RESPONSIBILITY FOR THE FINANCIAL STATEMENTS
The accompanying financial statements of West Shore Parks and Recreation Society (the "Society") are the responsibility of management and have been prepared in compliance with legislation, and in accordance with Canadian public sector accounting standards for local governments as recommended by the Public Sector Accounting Board of The Canadian Institute of Chartered Accountants. A summary of the significant accounting policies are described in Note 1 to the financial statements. The preparation of financial statements necessarily involves the use of estimates based on management's judgment, particularly when transactions affecting the current accounting period cannot be finalized with certainty until future periods.
The Society's management maintains a system of internal controls designed to provide reasonable assurance that assets are safeguarded, transactions are properly authorized and recorded in compliance with legislative and regulatory requirements, and reliable financial information is available on a timely basis for preparation of the financial statements. These systems are monitored and evaluated by management.
The Finance Committee meets with management and the external auditors to review the financial statements and discuss any significant financial reporting or internal control matters prior to approval of the financial statements by the Board of Directors.
The financial statements have been audited by KPMG LLP, independent external auditors appointed by the Society. The accompanying Independent Auditors' Report outlines their responsibilities, the scope of their examination and their opinion on the Society's financial statements.
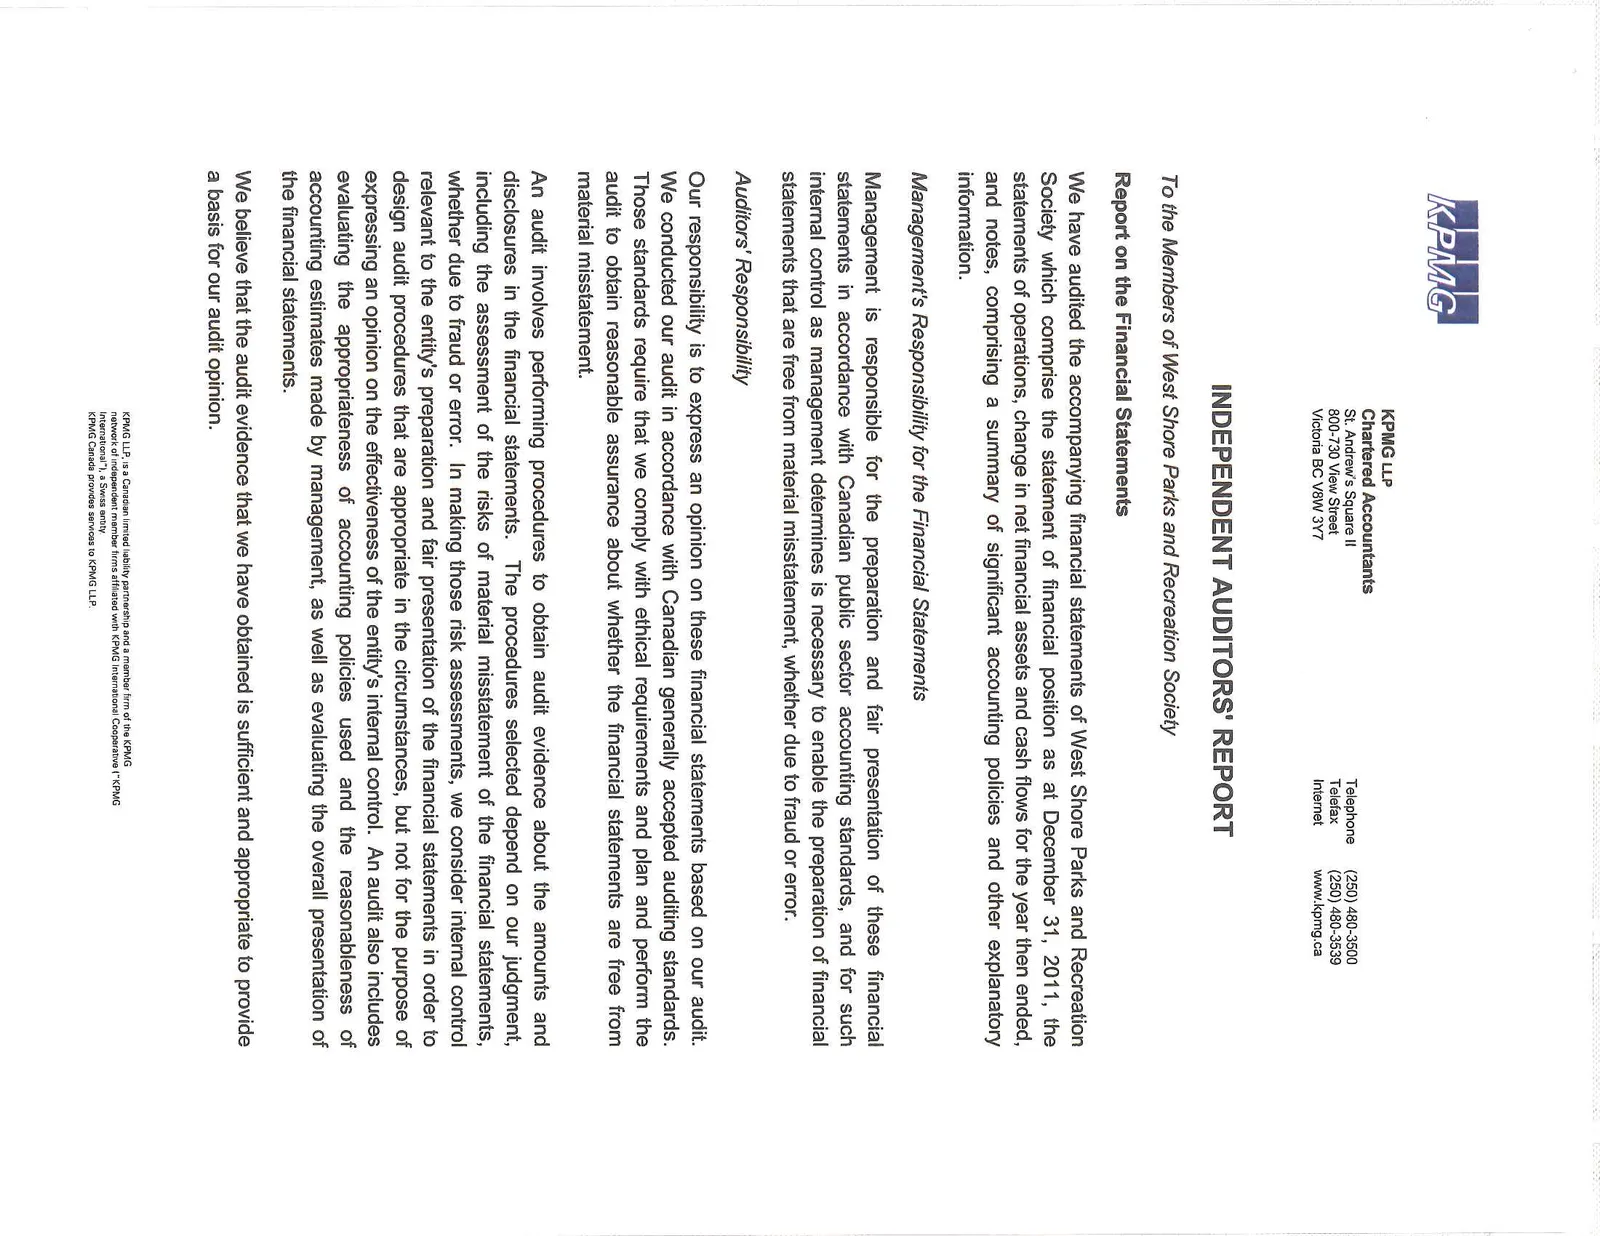
INDEPENDENT AUDITORS' REPORT
To the Members of West Shore Parks and Recreation Society
Report on the Financial Statements
We have audited the accompanying financial statements of West Shore Parks and Recreation Society which comprise the statement of financial position as at December 31, 2011, the statements of operations, change in net financial assets and cash flows for the year then ended, and notes, comprising a summary of significant accounting policies and other explanatory information.
Management's Responsibility for the Financial Statements
Management is responsible for the preparation and fair presentation of these financial statements in accordance with Canadian public sector accounting standards, and for such internal control as management determines is necessary to enable the preparation of financial statements that are free from material misstatement, whether due to fraud or error.
Auditors' Responsibility
Our responsibility is to express an opinion on these financial statements based on our audit. We conducted our audit in accordance with Canadian generally accepted auditing standards. Those standards require that we comply with ethical requirements and plan and perform the audit to obtain reasonable assurance about whether the financial statements are free from material misstatement.
An audit involves performing procedures to obtain audit evidence about the amounts and disclosures in the financial statements. The procedures selected depend on our judgment, including the assessment of the risks of material misstatement of the financial statements, whether due to fraud or error. In making those risk assessments, we consider internal control relevant to the entity's preparation and fair presentation of the financial statements in order to design audit procedures that are appropriate in the circumstances, but not for the purpose of expressing an opinion on the effectiveness of the entity's internal control. An audit also includes evaluating the appropriateness of accounting policies used and the reasonableness of accounting estimates made by management, as well as evaluating the overall presentation of the financial statements.
We believe that the audit evidence that we have obtained is sufficient and appropriate to provide a basis for our audit opinion.
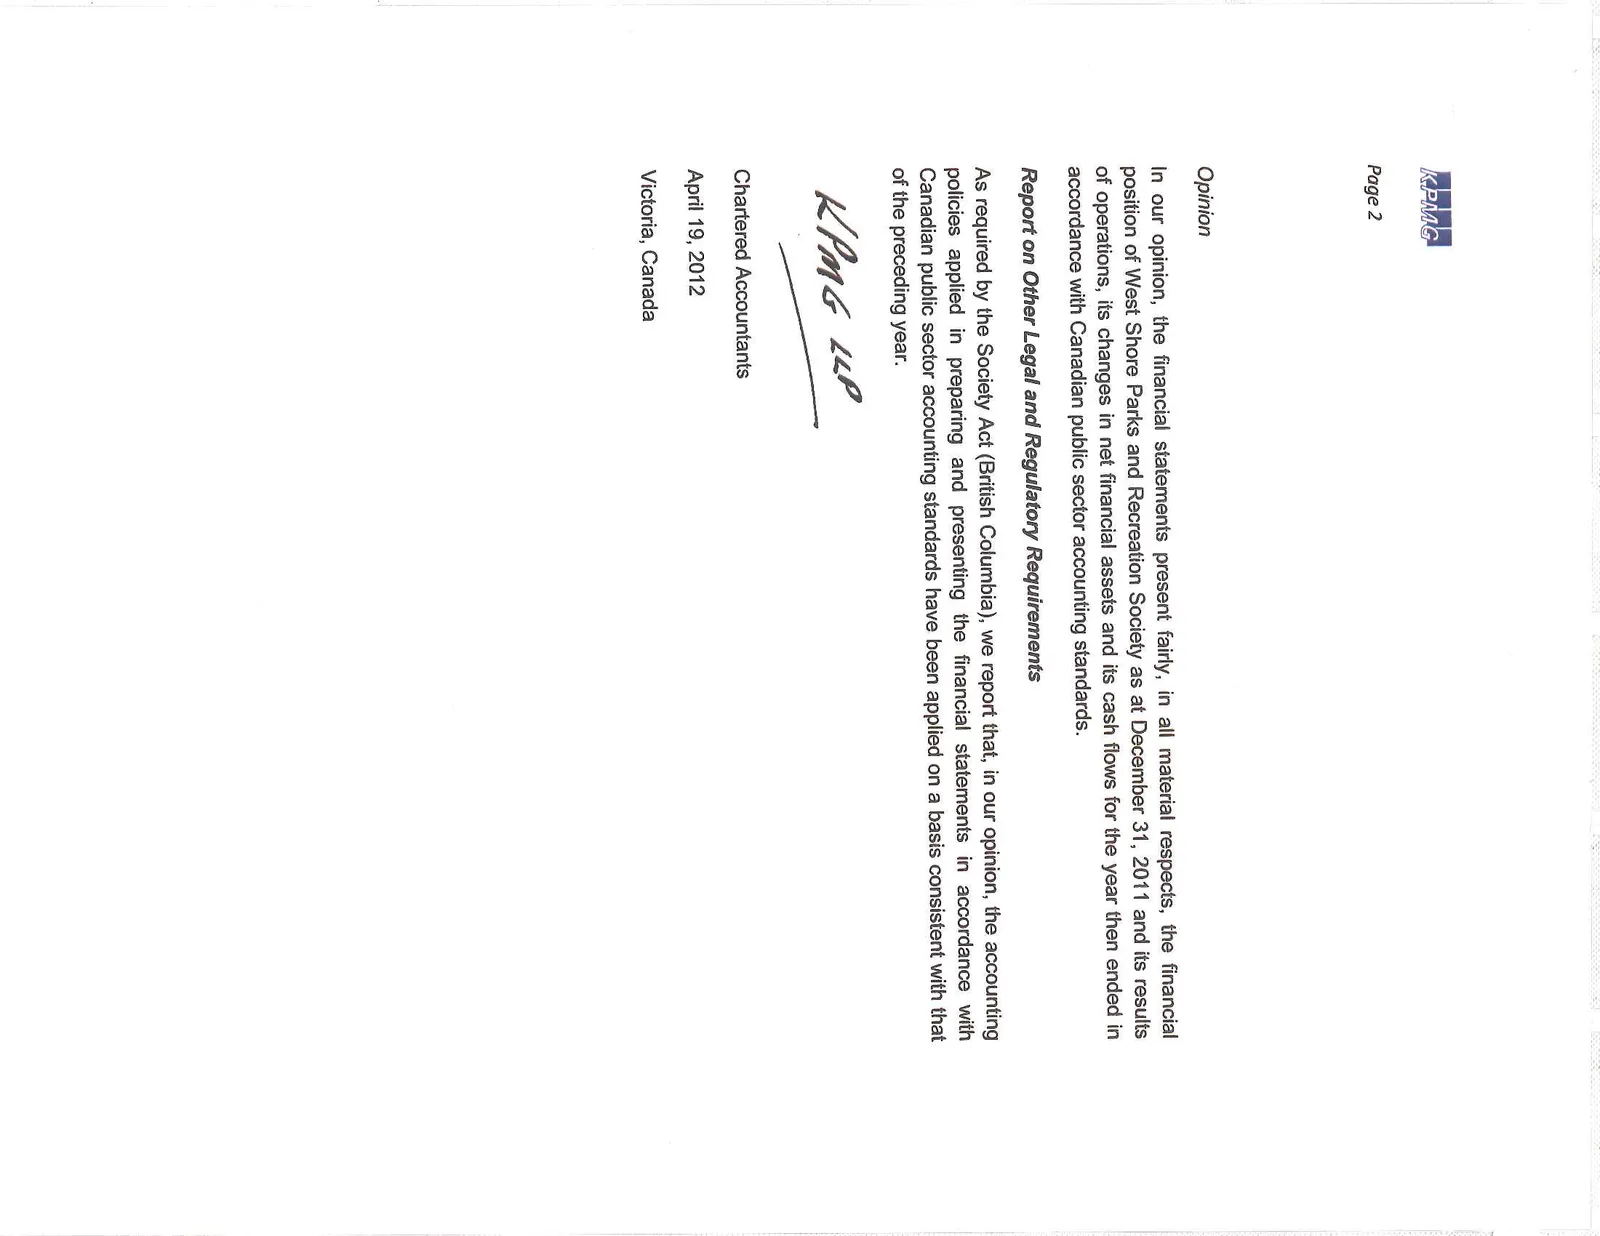
Opinion
In our opinion, the financial statements present fairly, in all material respects, the financial position of West Shore Parks and Recreation Society as at December 31, 2011 and its results of operations, its changes in net financial assets and its cash flows for the year then ended in accordance with Canadian public sector accounting standards.
Report on Other Legal and Regulatory Requirements
As required by the Society Act (British Columbia), we report that, in our opinion, the accounting policies applied in preparing and presenting the financial statements in accordance with Canadian public sector accounting standards have been applied on a basis consistent with that of the preceding year.
Chartered Accountants April 19, 2012 Victoria, Canada
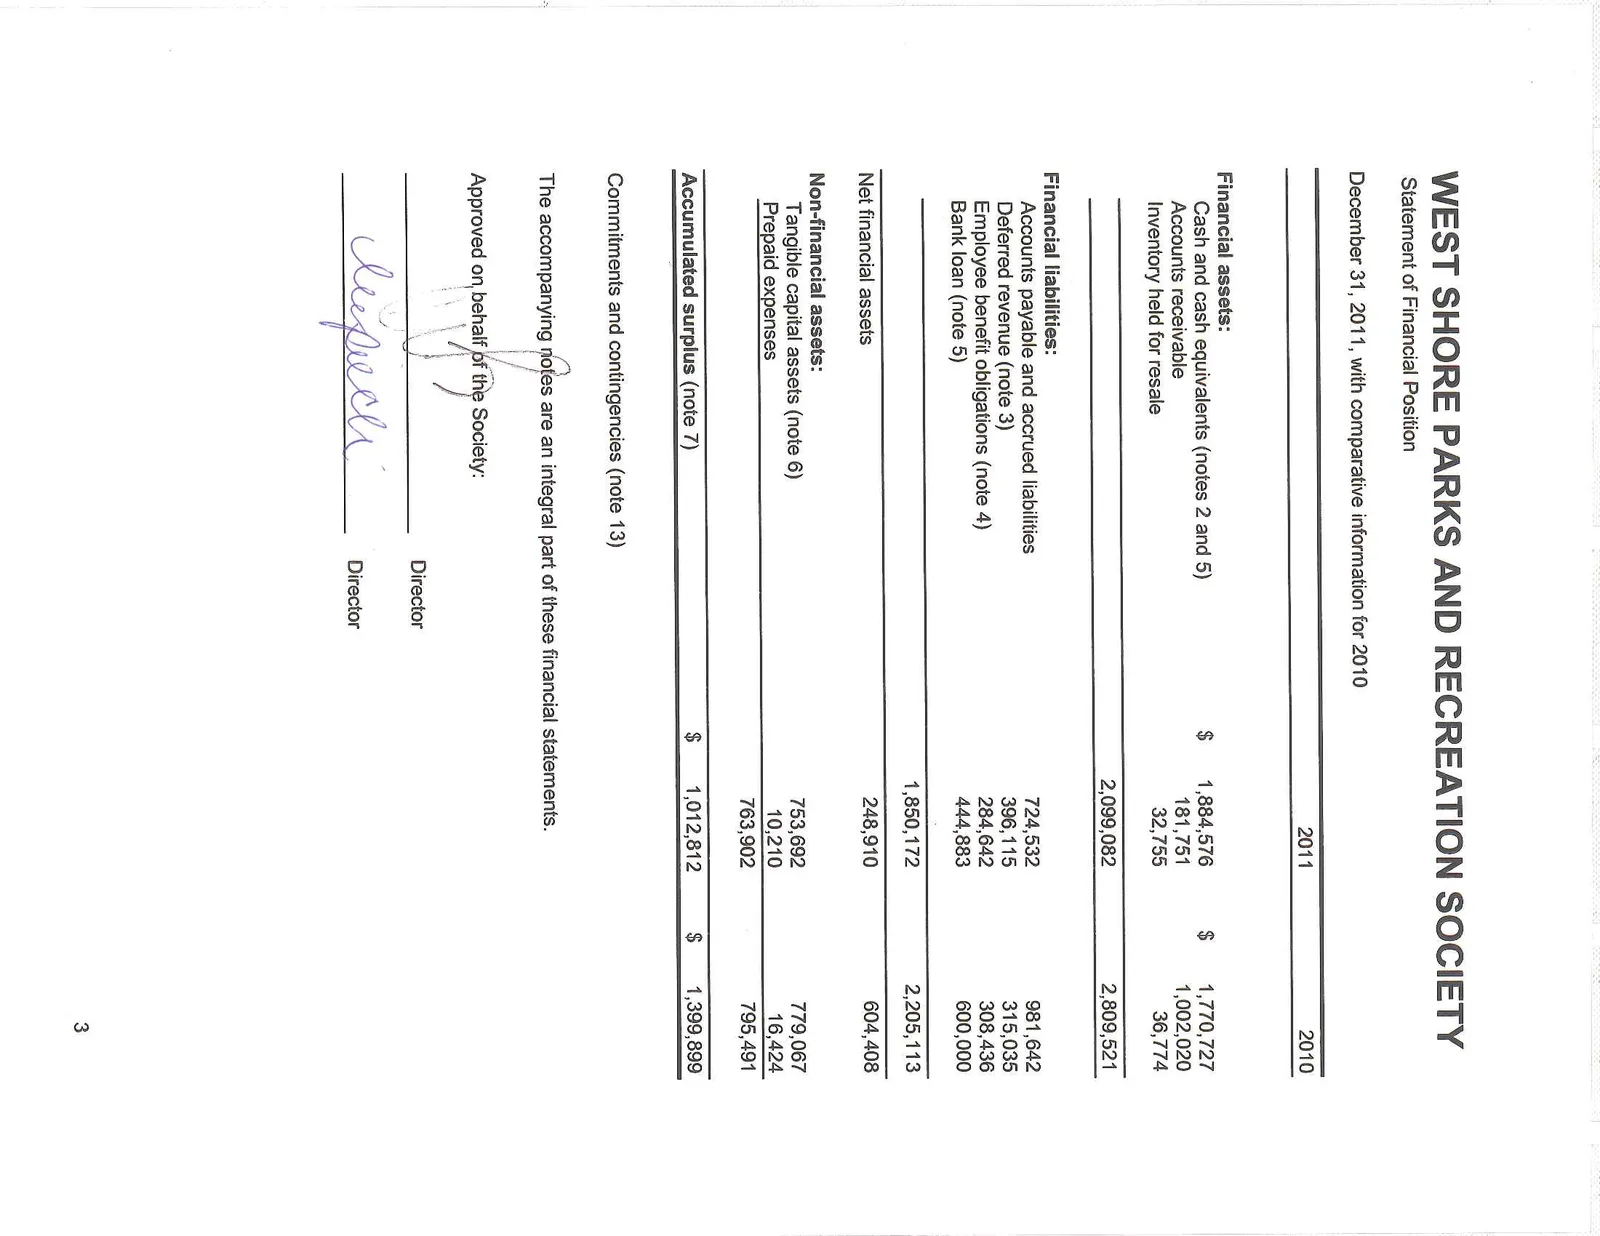
WEST SHORE PARKS AND RECREATION SOCIETY
Statement of Financial Position
December 31, 2011, with comparative information for 2010
| 2011 | 2010 | |
|---|---|---|
| Financial assets: | ||
| Cash and cash equivalents (notes 2 and 5) | $ 1,884,576 | $ 1,770,727 |
| Accounts receivable | 181,751 | 1,002,020 |
| Inventory held for resale | 32,755 | 36,774 |
| 2,099,082 | 2,809,521 | |
| Financial liabilities: | ||
| Accounts payable and accrued liabilities | 724,532 | 981,642 |
| Deferred revenue (note 3) | 396,115 | 315,035 |
| Employee benefit obligations (note 4) | 284,642 | 308,436 |
| Bank loan (note 5) | 444,883 | 600,000 |
| 1,850,172 | 2,205,113 | |
| Net financial assets | 248,910 | 604,408 |
| Non-financial assets: | ||
| Tangible capital assets (note 6) | 753,692 | 779,067 |
| Prepaid expenses | 10,210 | 16,424 |
| 763,902 | 795,491 | |
| Accumulated surplus (note 7) | $ 1,012,812 | $ 1,399,899 |
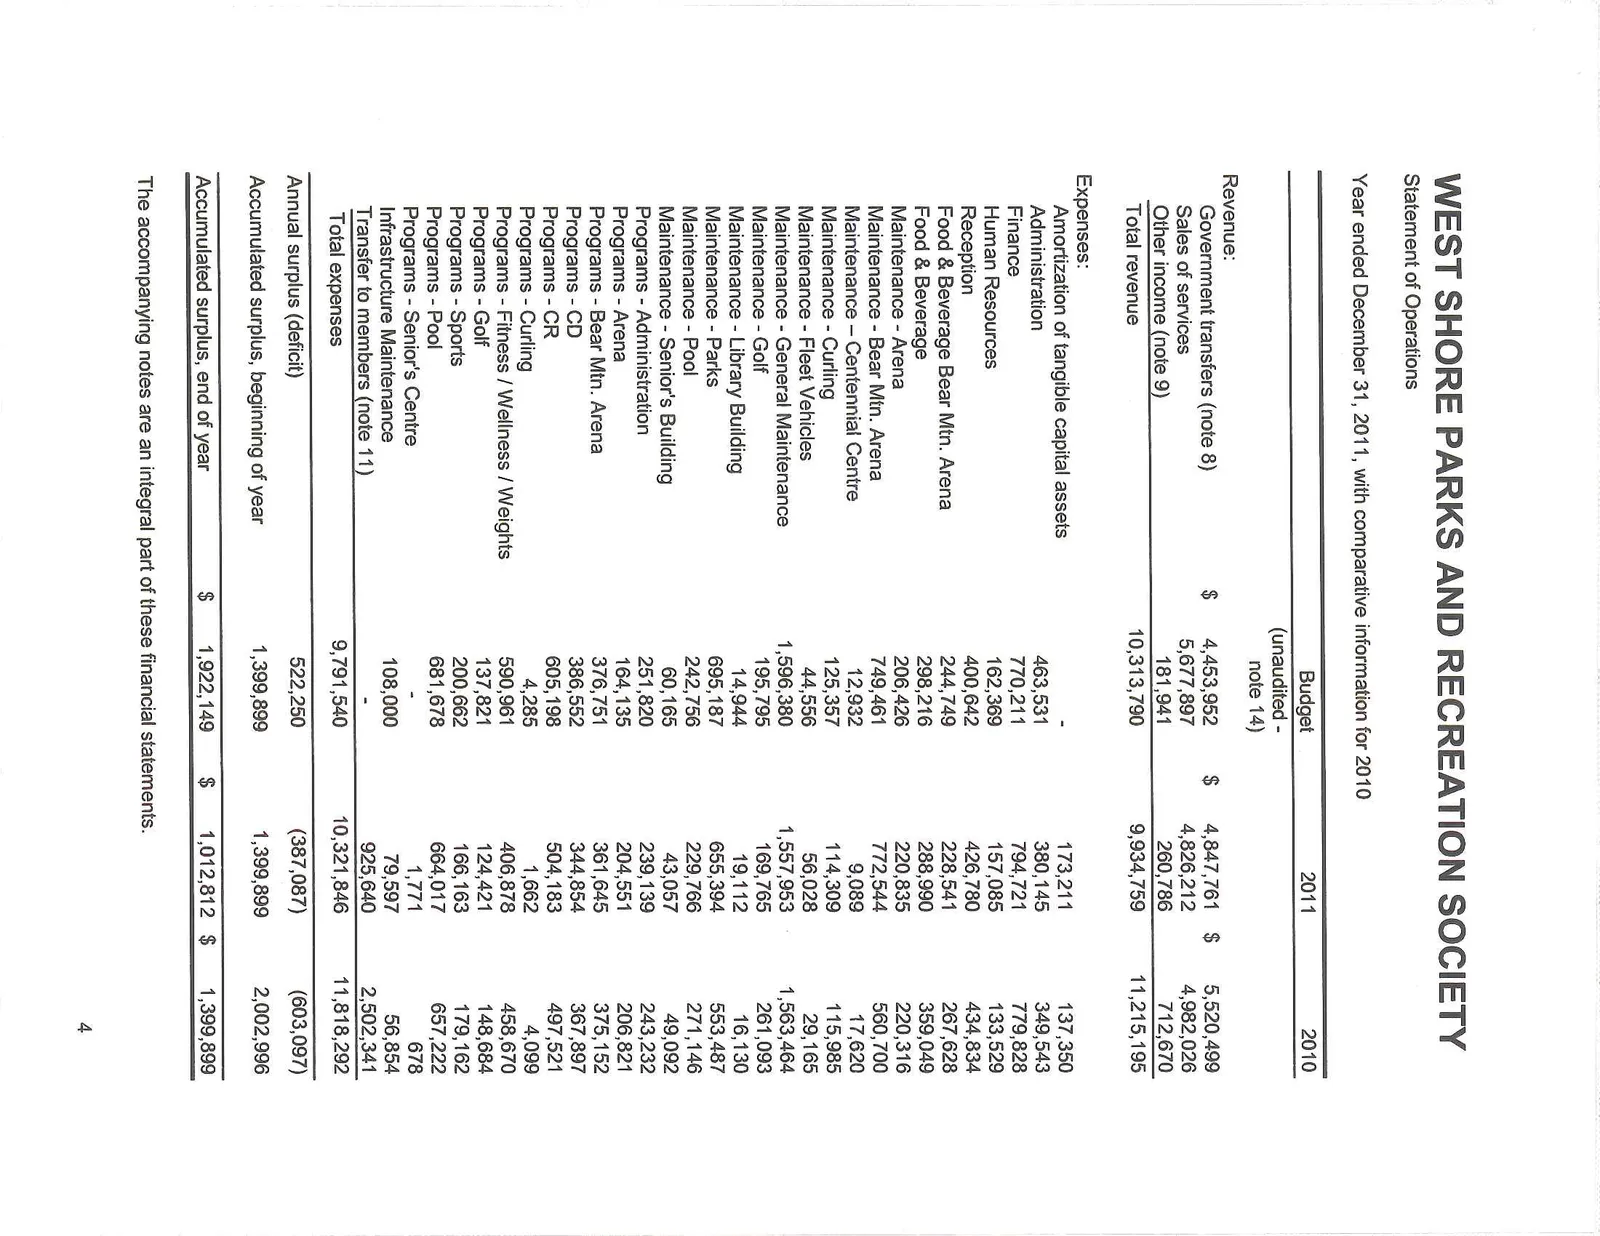
WEST SHORE PARKS AND RECREATION SOCIETY
Statement of Operations
Year ended December 31, 2011, with comparative information for 2010
| Budget (unaudited - note 14) | 2011 | 2010 | |
|---|---|---|---|
| Revenue: | |||
| Government transfers (note 8) | $ 4,453,952 | $ 4,847,761 | $ 5,520,499 |
| Sales of services | 5,677,897 | 4,826,212 | 4,982,026 |
| Other income (note 9) | 181,941 | 260,786 | 712,670 |
| Total revenue | 10,313,790 | 9,934,759 | 11,215,195 |
| Expenses: | |||
| Amortization of tangible capital assets | - | 173,211 | 137,350 |
| Administration | 463,531 | 380,145 | 349,543 |
| Finance | 770,211 | 794,721 | 779,828 |
| Human Resources | 162,369 | 157,085 | 133,529 |
| Reception | 400,642 | 426,780 | 434,834 |
| Food & Beverage Bear Mtn. Arena | 244,749 | 228,541 | 267,628 |
| Food & Beverage | 298,216 | 288,990 | 359,049 |
| Maintenance - Arena | 206,426 | 220,835 | 220,316 |
| Maintenance - Bear Mtn. Arena | 749,461 | 772,544 | 560,700 |
| Maintenance - Centennial Centre | 12,932 | 9,089 | 17,620 |
| Maintenance - Curling | 125,357 | 114,309 | 115,985 |
| Maintenance - Fleet Vehicles | 44,556 | 56,028 | 29,165 |
| Maintenance - General Maintenance | 1,596,380 | 1,557,953 | 1,563,464 |
| Maintenance - Golf | 195,795 | 169,765 | 261,093 |
| Maintenance - Library Building | 14,944 | 19,112 | 16,130 |
| Maintenance - Parks | 695,187 | 655,394 | 553,487 |
| Maintenance - Pool | 242,756 | 229,766 | 271,146 |
| Maintenance - Senior's Building | 60,165 | 43,057 | 49,092 |
| Programs - Administration | 251,820 | 239,139 | 243,232 |
| Programs - Arena | 164,135 | 204,551 | 206,821 |
| Programs - Bear Mtn. Arena | 376,751 | 361,645 | 375,152 |
| Programs - CD | 386,552 | 344,854 | 367,897 |
| Programs - CR | 605,198 | 504,183 | 497,521 |
| Programs - Curling | 4,285 | 1,662 | 4,099 |
| Programs - Fitness / Wellness / Weights | 590,961 | 406,878 | 458,670 |
| Programs - Golf | 137,821 | 124,421 | 148,684 |
| Programs - Sports | 200,662 | 166,163 | 179,162 |
| Programs - Pool | 681,678 | 664,017 | 657,222 |
| Programs - Senior's Centre | - | 1,771 | 678 |
| Infrastructure Maintenance | 108,000 | 79,597 | 56,854 |
| Transfer to members (note 11) | - | 925,640 | 2,502,341 |
| Total expenses | 9,791,540 | 10,321,846 | 11,818,292 |
| Annual surplus (deficit) | 522,250 | (387,087) | (603,097) |
| Accumulated surplus, beginning of year | 1,399,899 | 1,399,899 | 2,002,996 |
| Accumulated surplus, end of year | $ 1,922,149 | $ 1,012,812 | $ 1,399,899 |
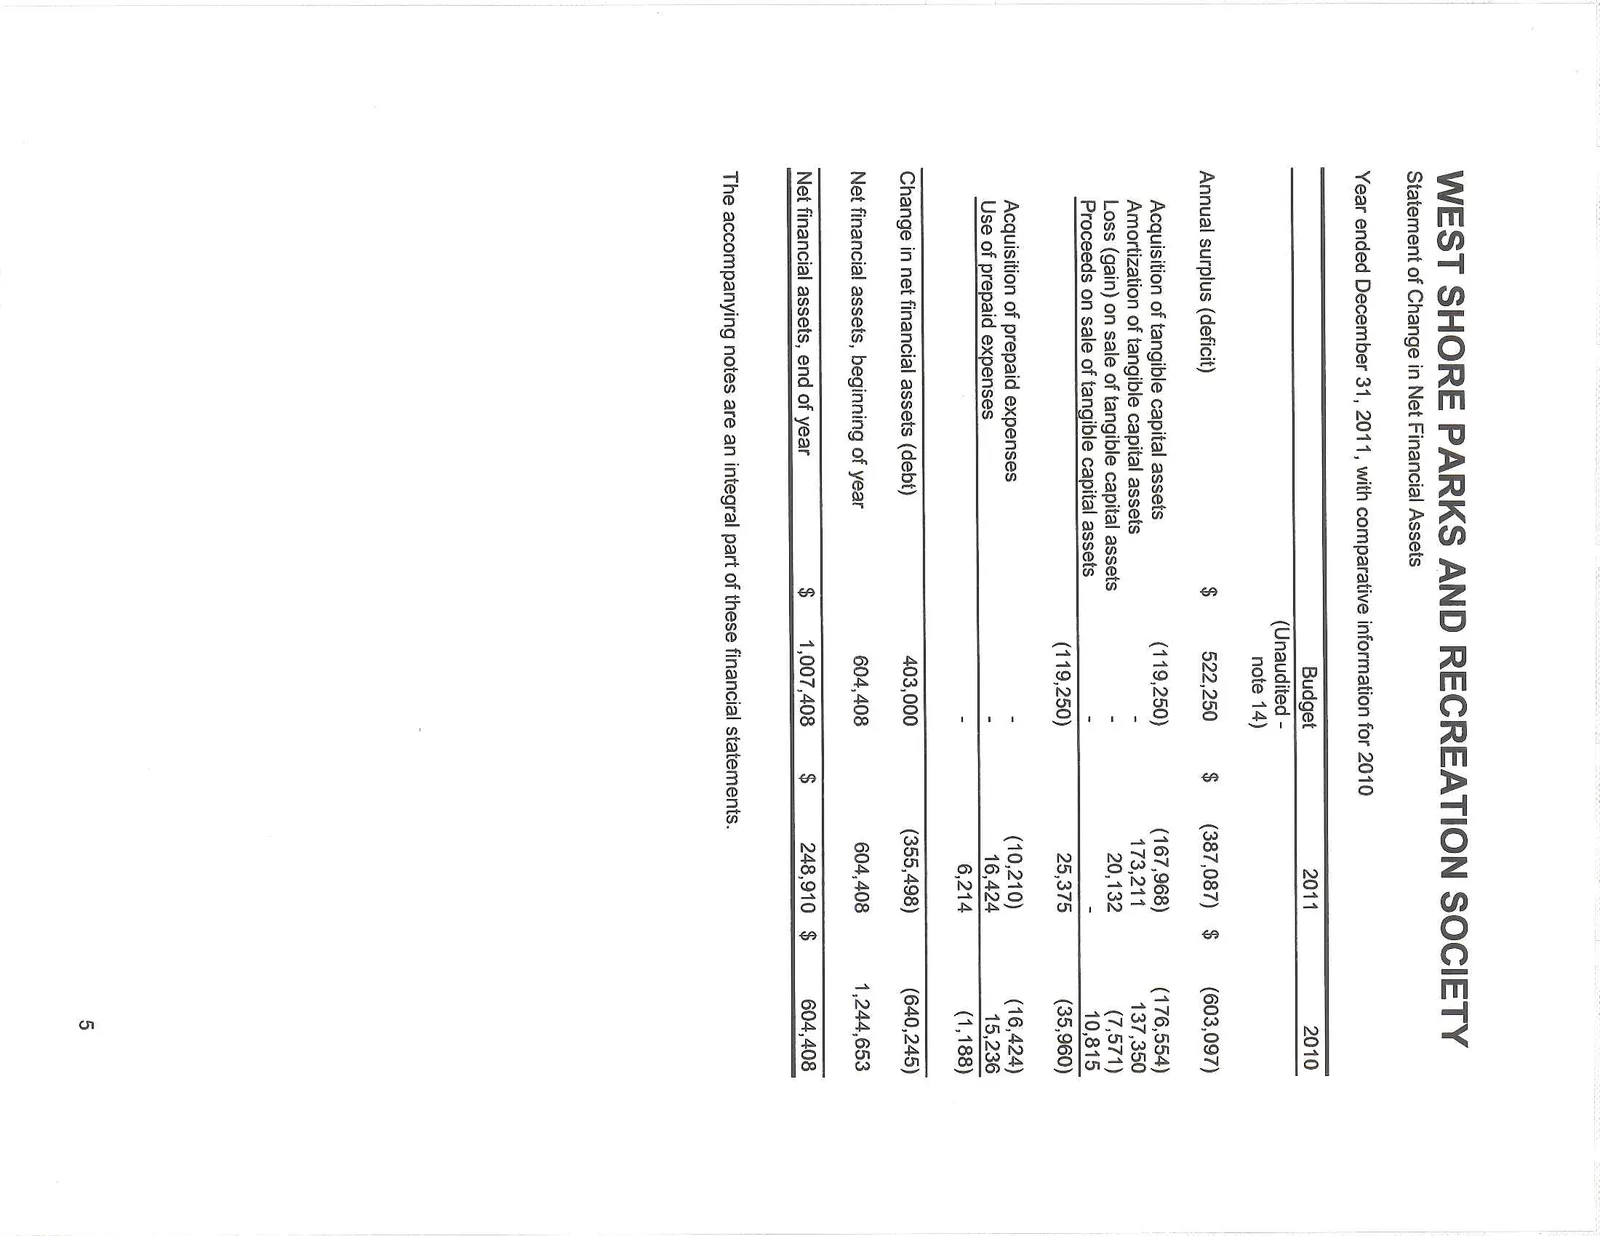
WEST SHORE PARKS AND RECREATION SOCIETY
Statement of Change in Net Financial Assets
Year ended December 31, 2011, with comparative information for 2010
| Budget (unaudited - note 14) | 2011 | 2010 | |
|---|---|---|---|
| Annual surplus (deficit) | $ 522,250 | $ (387,087) | $ (603,097) |
| Acquisition of tangible capital assets | (119,250) | (167,968) | (176,554) |
| Amortization of tangible capital assets | - | 173,211 | 137,350 |
| Loss (gain) on sale of tangible capital assets | - | 20,132 | (7,571) |
| Proceeds on sale of tangible capital assets | - | - | 10,815 |
| (119,250) | 25,375 | (35,960) | |
| Acquisition of prepaid expenses | - | (10,210) | (16,424) |
| Use of prepaid expenses | - | 16,424 | 15,236 |
| - | 6,214 | (1,188) | |
| Change in net financial assets (debt) | 403,000 | (355,498) | (640,245) |
| Net financial assets, beginning of year | 604,408 | 604,408 | 1,244,653 |
| Net financial assets, end of year | $ 1,007,408 | $ 248,910 | $ 604,408 |
WEST SHORE PARKS AND RECREATION SOCIETY
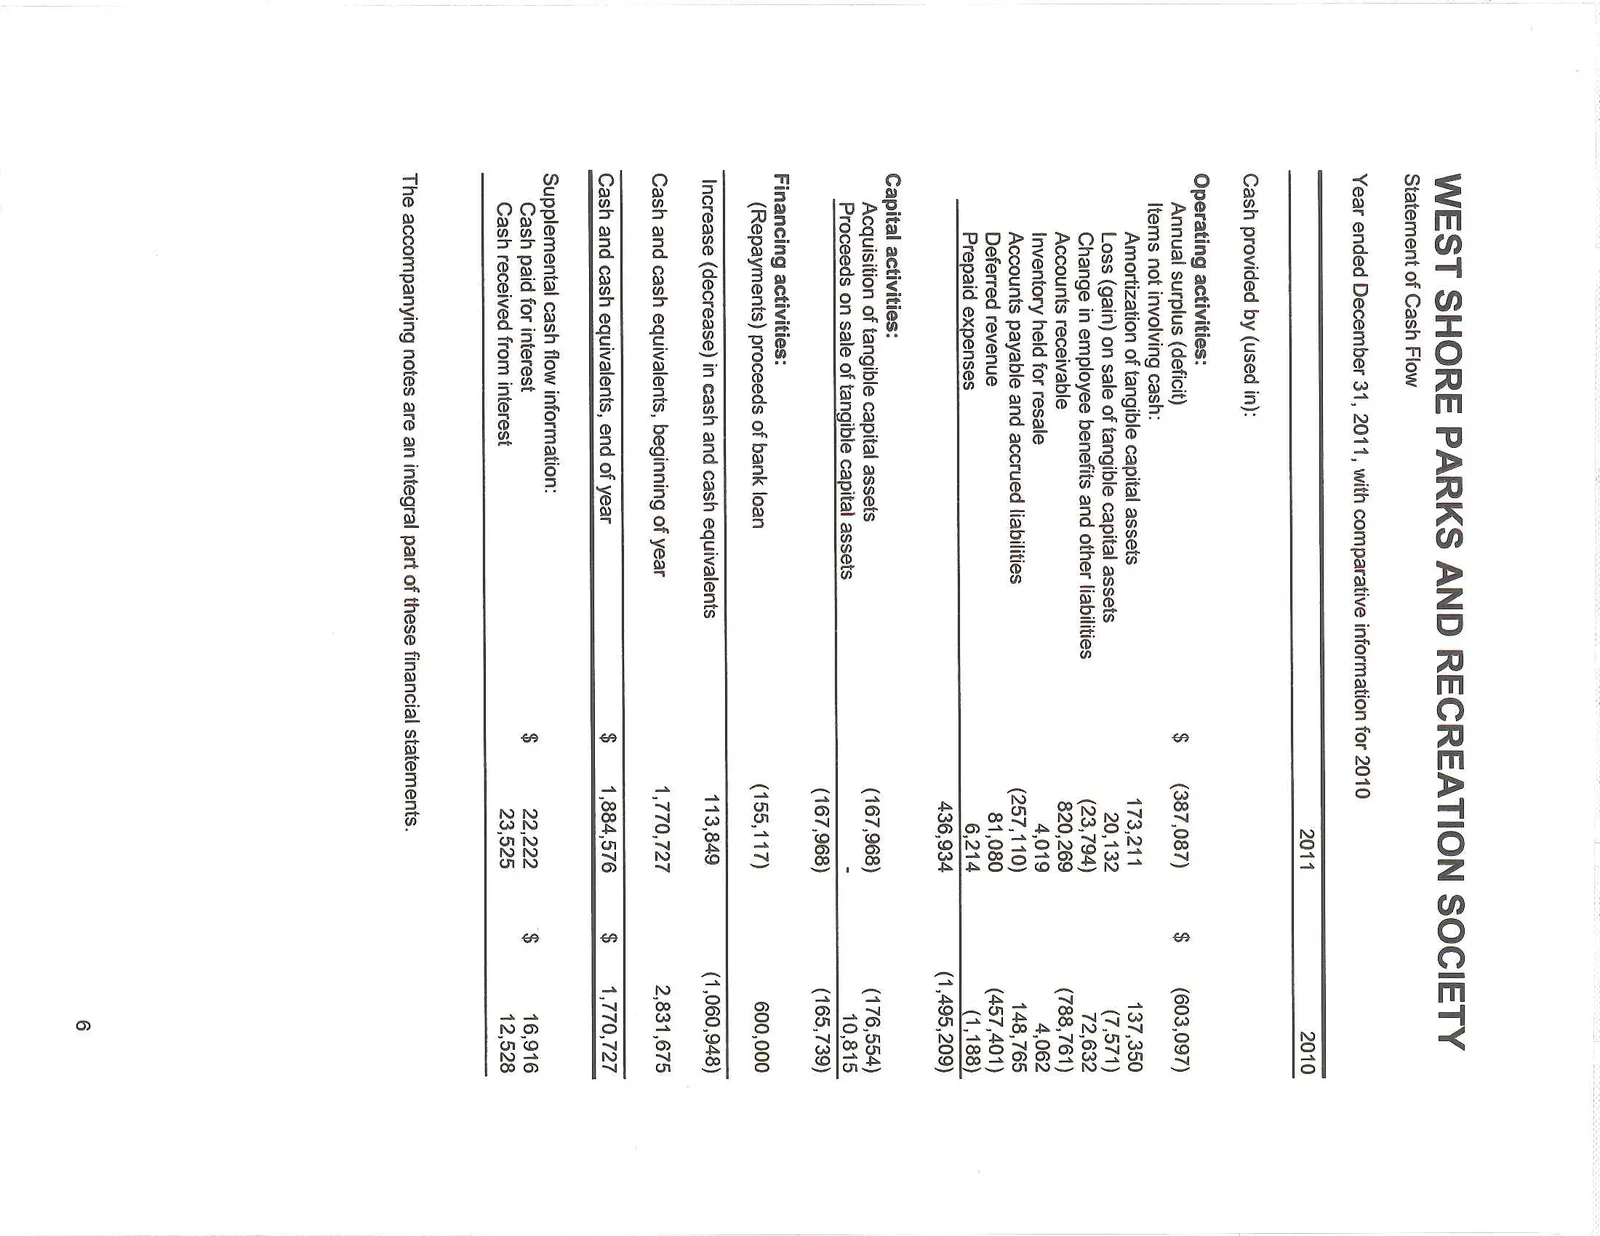
Statement of Cash Flow
Year ended December 31, 2011, with comparative information for 2010
| 2011 | 2010 | |
|---|---|---|
| Cash provided by (used in): | ||
| Operating activities: | ||
| Annual surplus (deficit) | $ (387,087) | $ (603,097) |
| Items not involving cash: | ||
| Amortization of tangible capital assets | 173,211 | 137,350 |
| Loss (gain) on sale of tangible capital assets | 20,132 | (7,571) |
| Change in employee benefits and other liabilities | (23,794) | 72,632 |
| Accounts receivable | 820,269 | (788,761) |
| Inventory held for resale | 4,019 | 4,062 |
| Accounts payable and accrued liabilities | (257,110) | 148,765 |
| Deferred revenue | 81,080 | (457,401) |
| Prepaid expenses | 6,214 | (1,188) |
| 436,934 | (1,495,209) | |
| Capital activities: | ||
| Acquisition of tangible capital assets | (167,968) | (176,554) |
| Proceeds on sale of tangible capital assets | - | 10,815 |
| (167,968) | (165,739) | |
| Financing activities: | ||
| (Repayments) proceeds of bank loan | (155,117) | 600,000 |
| Increase (decrease) in cash and cash equivalents | 113,849 | (1,060,948) |
| Cash and cash equivalents, beginning of year | 1,770,727 | 2,831,675 |
| Cash and cash equivalents, end of year | $ 1,884,576 | $ 1,770,727 |
| Supplemental cash flow information: | ||
| Cash paid for interest | $ 22,222 | $ 16,916 |
| Cash received from interest | 23,525 | 12,528 |
WEST SHORE PARKS AND RECREATION SOCIETY
Notes to Financial Statements
Year ended December 31, 2011
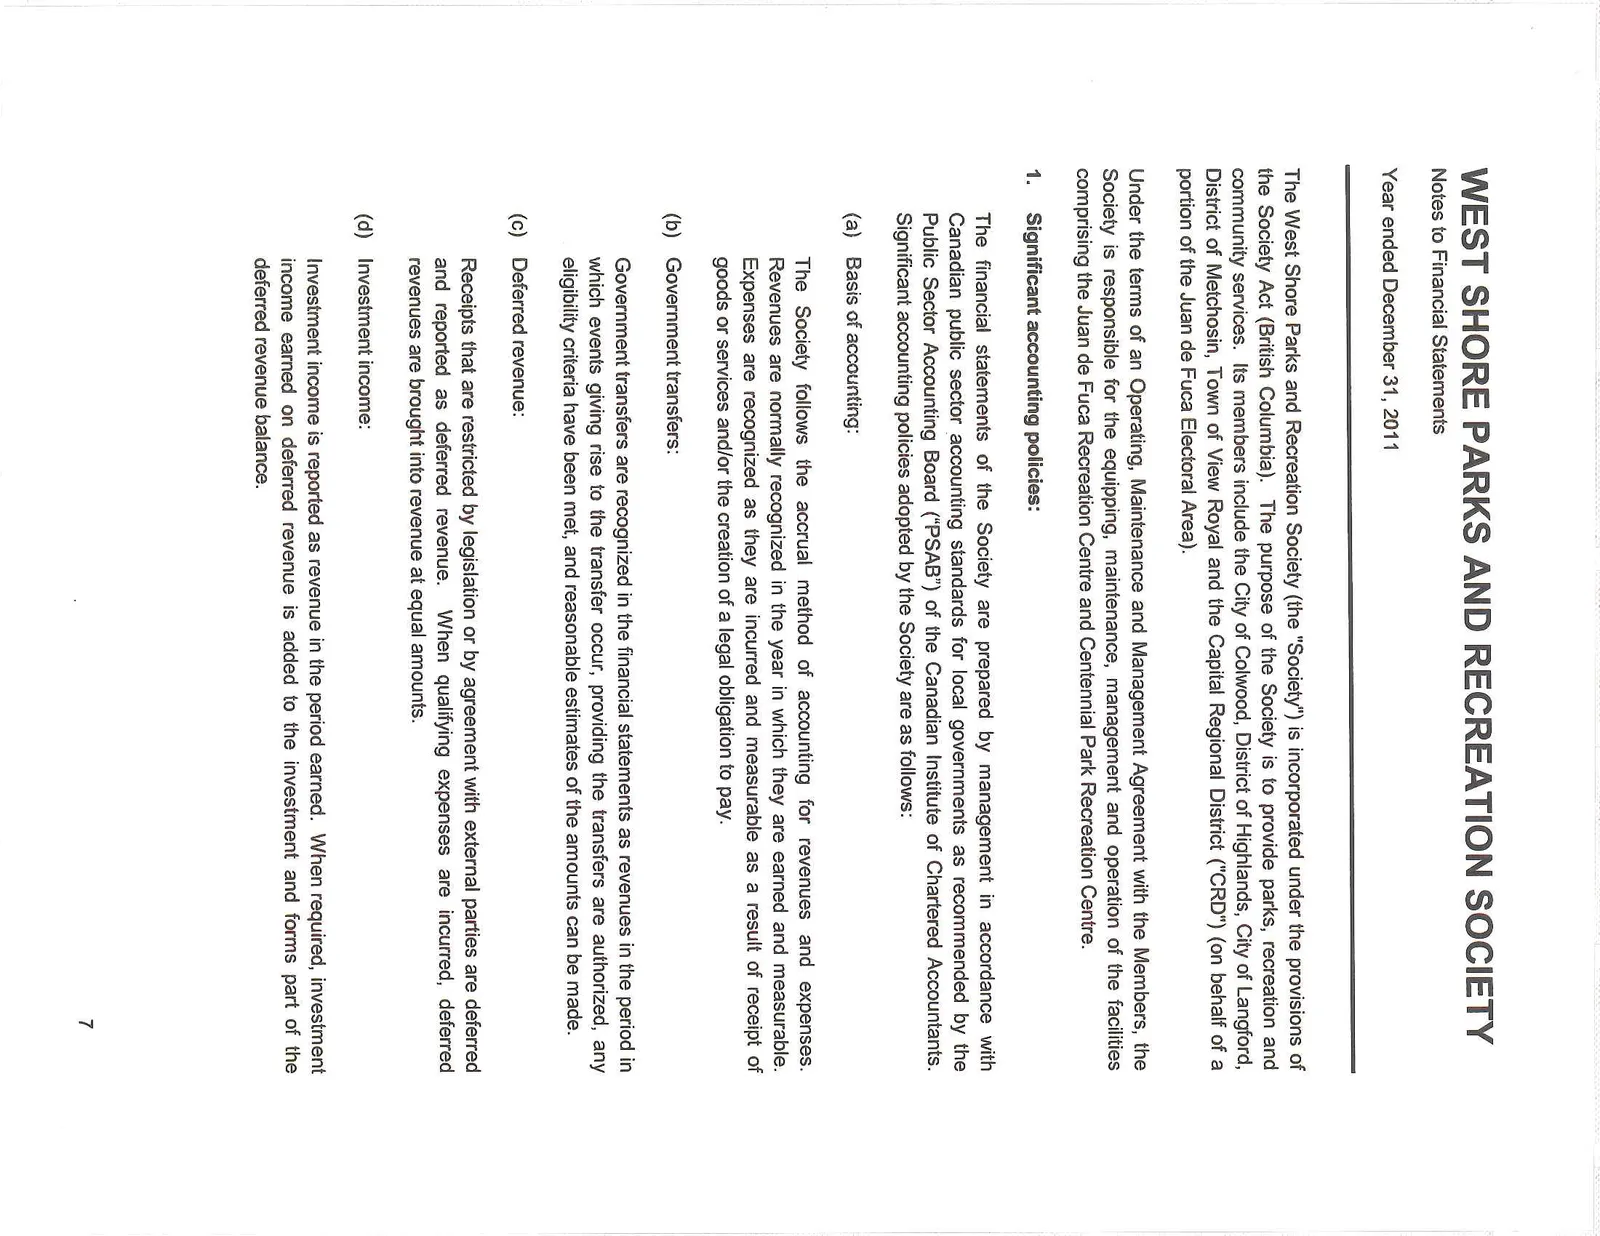
The West Shore Parks and Recreation Society (the "Society") is incorporated under the provisions of the Society Act (British Columbia). The purpose of the Society is to provide parks, recreation and community services. Its members include the City of Colwood, District of Highlands, City of Langford, District of Metchosin, Town of View Royal and the Capital Regional District ("CRD") (on behalf of a portion of the Juan de Fuca Electoral Area).
Under the terms of an Operating, Maintenance and Management Agreement with the Members, the Society is responsible for the equipping, maintenance, management and operation of the facilities comprising the Juan de Fuca Recreation Centre and Centennial Park Recreation Centre.
1. Significant accounting policies:
The financial statements of the Society are prepared by management in accordance with Canadian public sector accounting standards for local governments as recommended by the Public Sector Accounting Board ("PSAB") of the Canadian Institute of Chartered Accountants. Significant accounting policies adopted by the Society are as follows:
(a) Basis of accounting: The Society follows the accrual method of accounting for revenues and expenses. Revenues are normally recognized in the year in which they are earned and measurable. Expenses are recognized as they are incurred and measurable as a result of receipt of goods or services and/or the creation of a legal obligation to pay.
(b) Government transfers: Government transfers are recognized in the financial statements as revenues in the period in which events giving rise to the transfer occur, providing the transfers are authorized, any eligibility criteria have been met, and reasonable estimates of the amounts can be made.
(c) Deferred revenue: Receipts that are restricted by legislation or by agreement with external parties are deferred and reported as deferred revenue. When qualifying expenses are incurred, deferred revenues are brought into revenue at equal amounts.
(d) Investment income: Investment income is reported as revenue in the period earned. When required, investment income earned on deferred revenue is added to the investment and forms part of the deferred revenue balance.
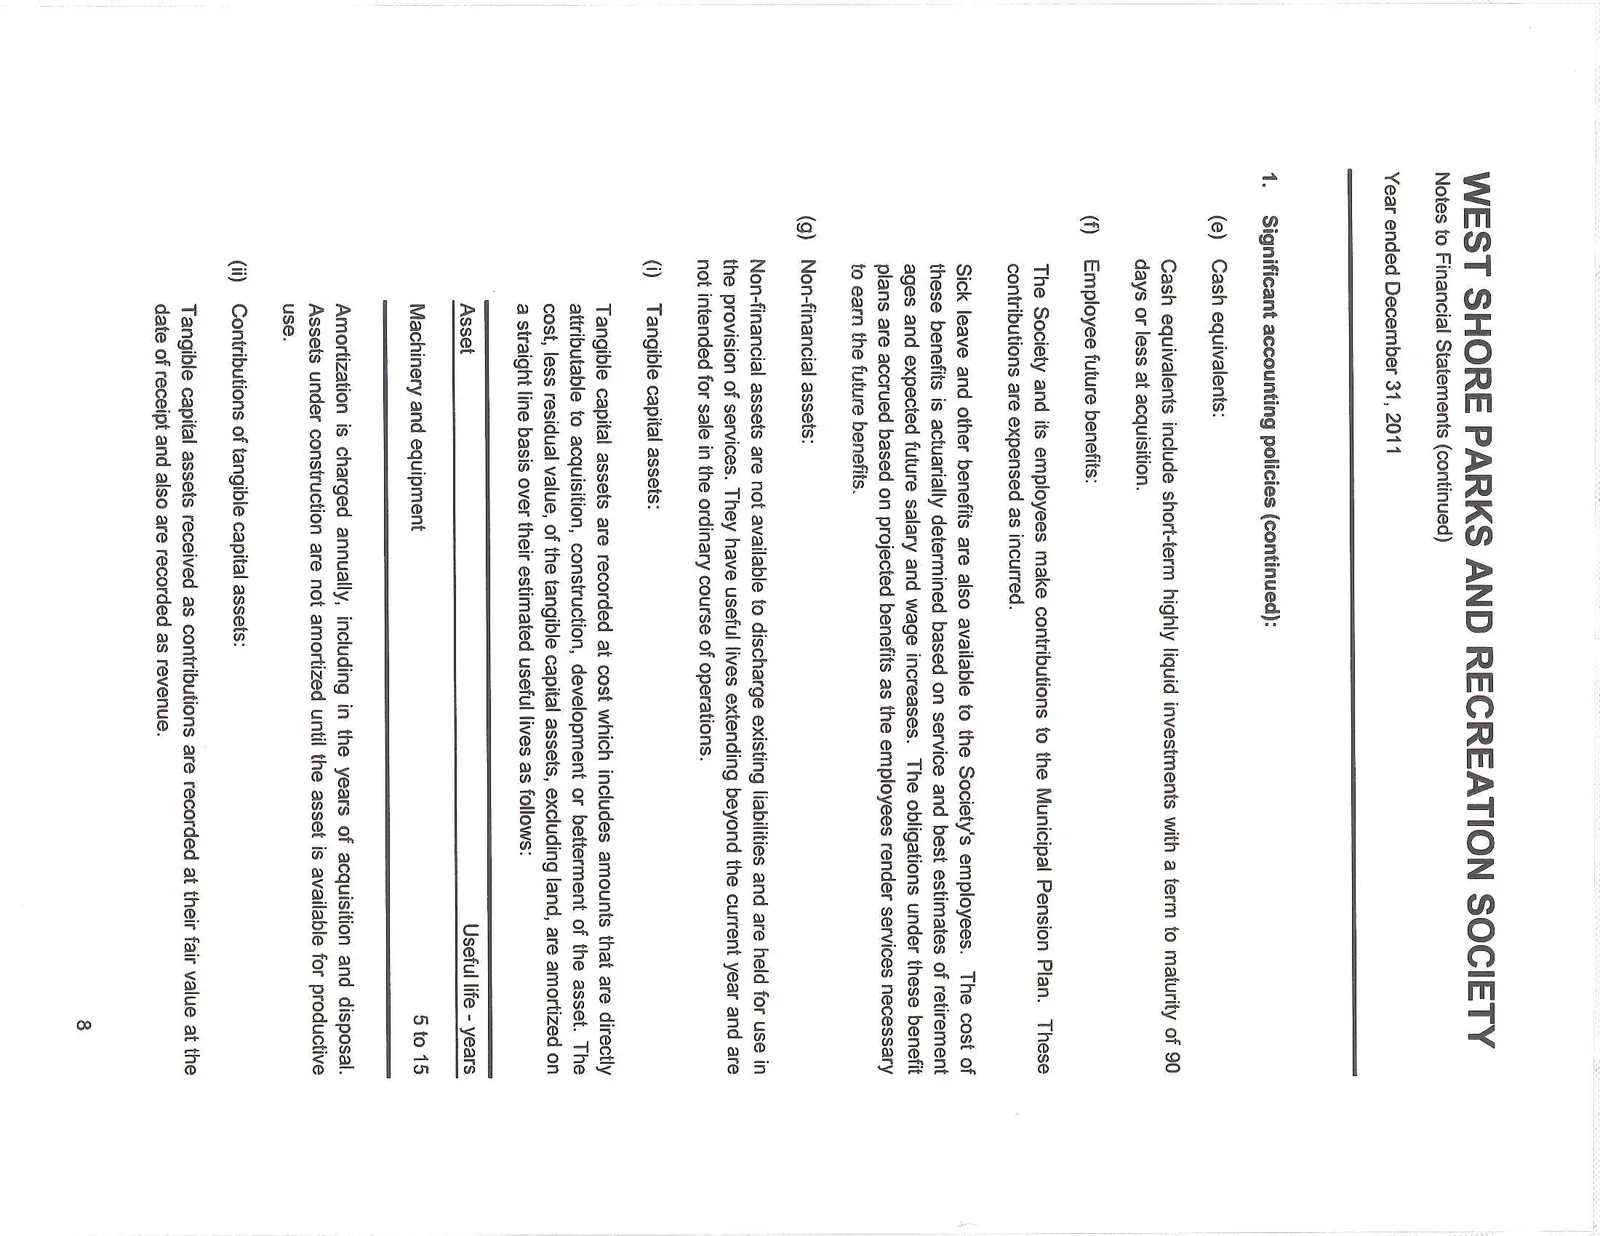
(e) Cash equivalents: Cash equivalents include short-term highly liquid investments with a term to maturity of 90 days or less at acquisition.
(f) Employee future benefits: The Society and its employees make contributions to the Municipal Pension Plan. These contributions are expensed as incurred.
Sick leave and other benefits are also available to the Society's employees. The cost of these benefits is actuarially determined based on service and best estimates of retirement ages and expected future salary and wage increases. The obligations under these benefit plans are accrued based on projected benefits as the employees render services necessary to earn the future benefits.
(g) Non-financial assets: Non-financial assets are not available to discharge existing liabilities and are held for use in the provision of services. They have useful lives extending beyond the current year and are not intended for sale in the ordinary course of operations.
(i) Tangible capital assets: Tangible capital assets are recorded at cost which includes amounts that are directly attributable to acquisition, construction, development or betterment of the asset. The cost, less residual value, of the tangible capital assets, excluding land, are amortized on a straight line basis over their estimated useful lives as follows:
| Asset | Useful life - years |
|---|---|
| Machinery and equipment | 5 to 15 |
Amortization is charged annually, including in the years of acquisition and disposal. Assets under construction are not amortized until the asset is available for productive use.
(ii) Contributions of tangible capital assets: Tangible capital assets received as contributions are recorded at their fair value at the date of receipt and also are recorded as revenue.
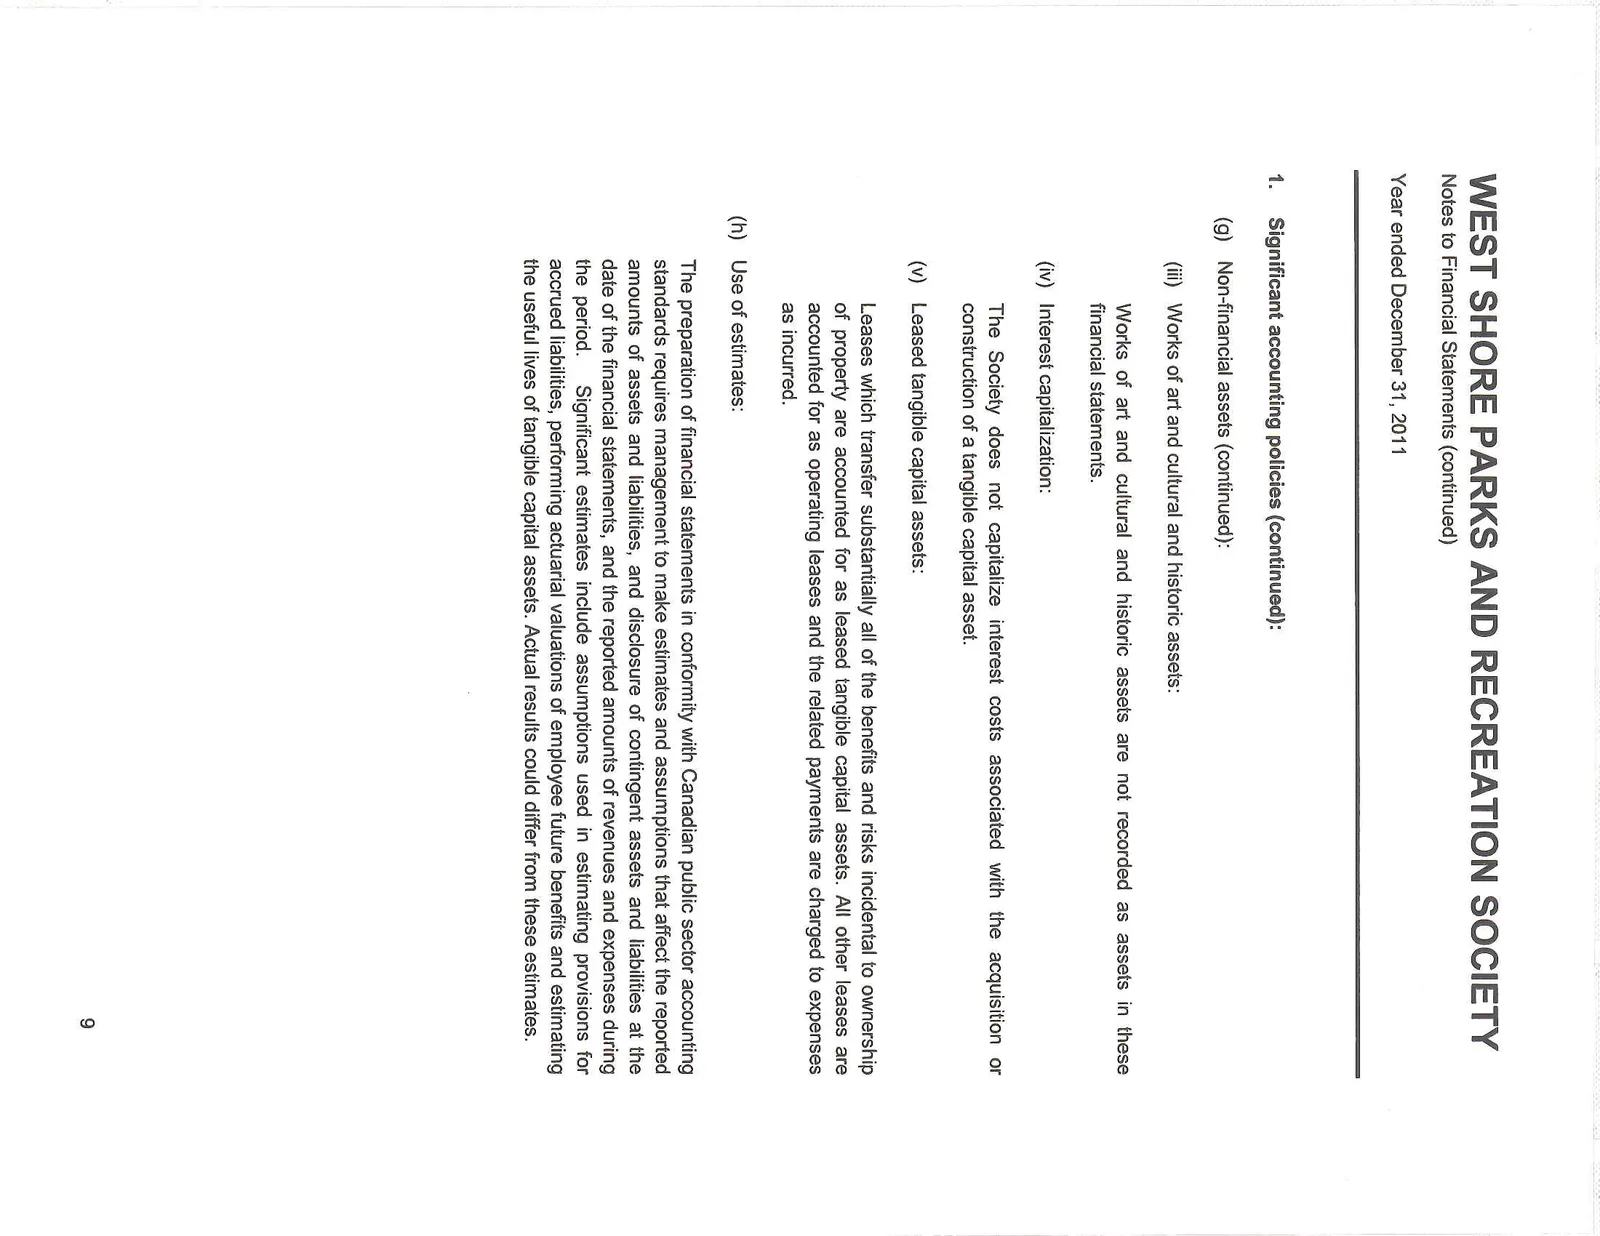
(iii) Works of art and cultural and historic assets: Works of art and cultural and historic assets are not recorded as assets in these financial statements.
(iv) Interest capitalization: The Society does not capitalize interest costs associated with the acquisition or construction of a tangible capital asset.
(v) Leased tangible capital assets: Leases which transfer substantially all of the benefits and risks incidental to ownership of property are accounted for as leased tangible capital assets. All other leases are accounted for as operating leases and the related payments are charged to expenses as incurred.
(h) Use of estimates: The preparation of financial statements in conformity with Canadian public sector accounting standards requires management to make estimates and assumptions that affect the reported amounts of assets and liabilities, and disclosure of contingent assets and liabilities at the date of the financial statements, and the reported amounts of revenues and expenses during the period. Significant estimates include assumptions used in estimating provisions for accrued liabilities, performing actuarial valuations of employee future benefits and estimating the useful lives of tangible capital assets. Actual results could differ from these estimates.
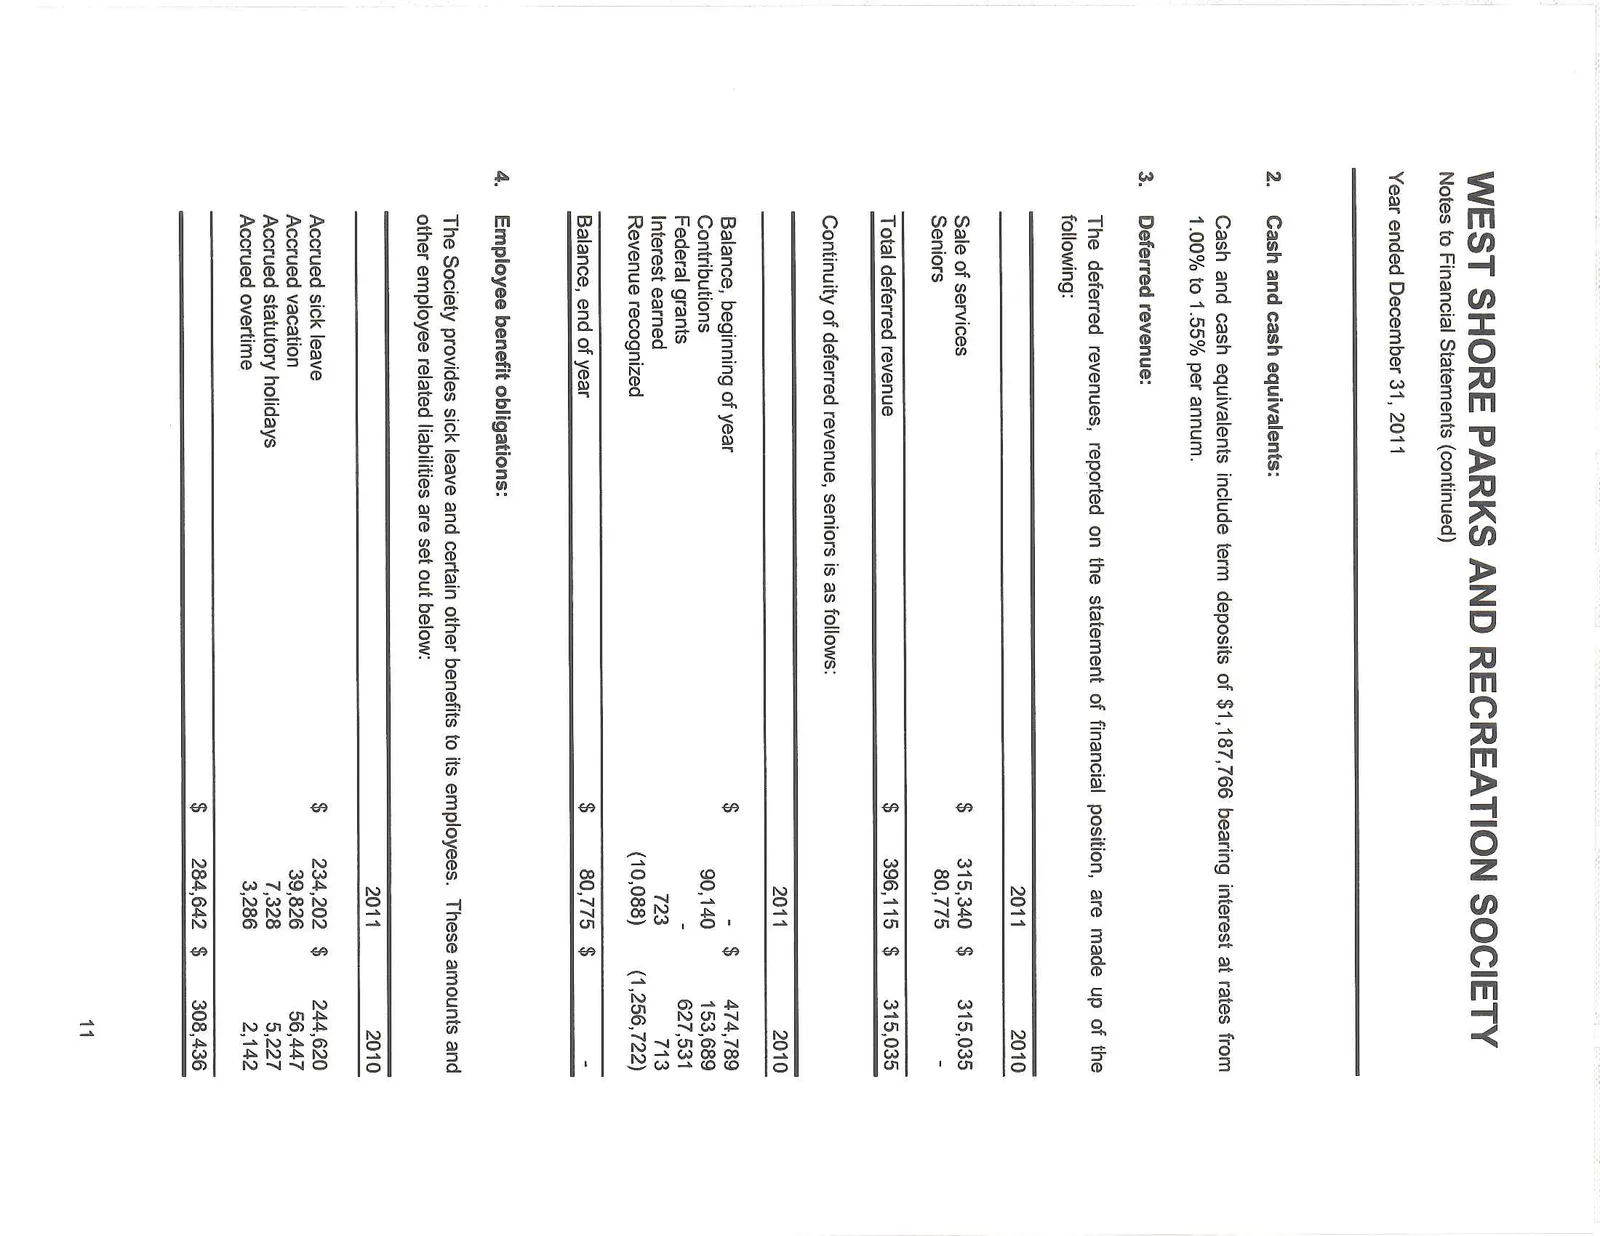
2. Cash and cash equivalents:
Cash and cash equivalents include term deposits of $1,187,766 bearing interest at rates from 1.00% to 1.55% per annum.
3. Deferred revenue:
The deferred revenues, reported on the statement of financial position, are made up of the following:
| 2011 | 2010 | |
|---|---|---|
| Sale of services | $ 315,340 | $ 315,035 |
| Seniors | 80,775 | - |
| Total deferred revenue | $ 396,115 | $ 315,035 |
Continuity of deferred revenue, seniors is as follows:
| 2011 | 2010 | |
|---|---|---|
| Balance, beginning of year | $ - | $ 474,789 |
| Contributions | 90,140 | 153,689 |
| Federal grants | - | 627,531 |
| Interest earned | 723 | 713 |
| Revenue recognized | (10,088) | (1,256,722) |
| Balance, end of year | $ 80,775 | $ - |
4. Employee benefit obligations:
The Society provides sick leave and certain other benefits to its employees. These amounts and other employee related liabilities are set out below:
| 2011 | 2010 | |
|---|---|---|
| Accrued sick leave | $ 234,202 | $ 244,620 |
| Accrued vacation | 39,826 | 56,447 |
| Accrued statutory holidays | 7,328 | 5,227 |
| Accrued overtime | 3,286 | 2,142 |
| $ 284,642 | $ 308,436 |
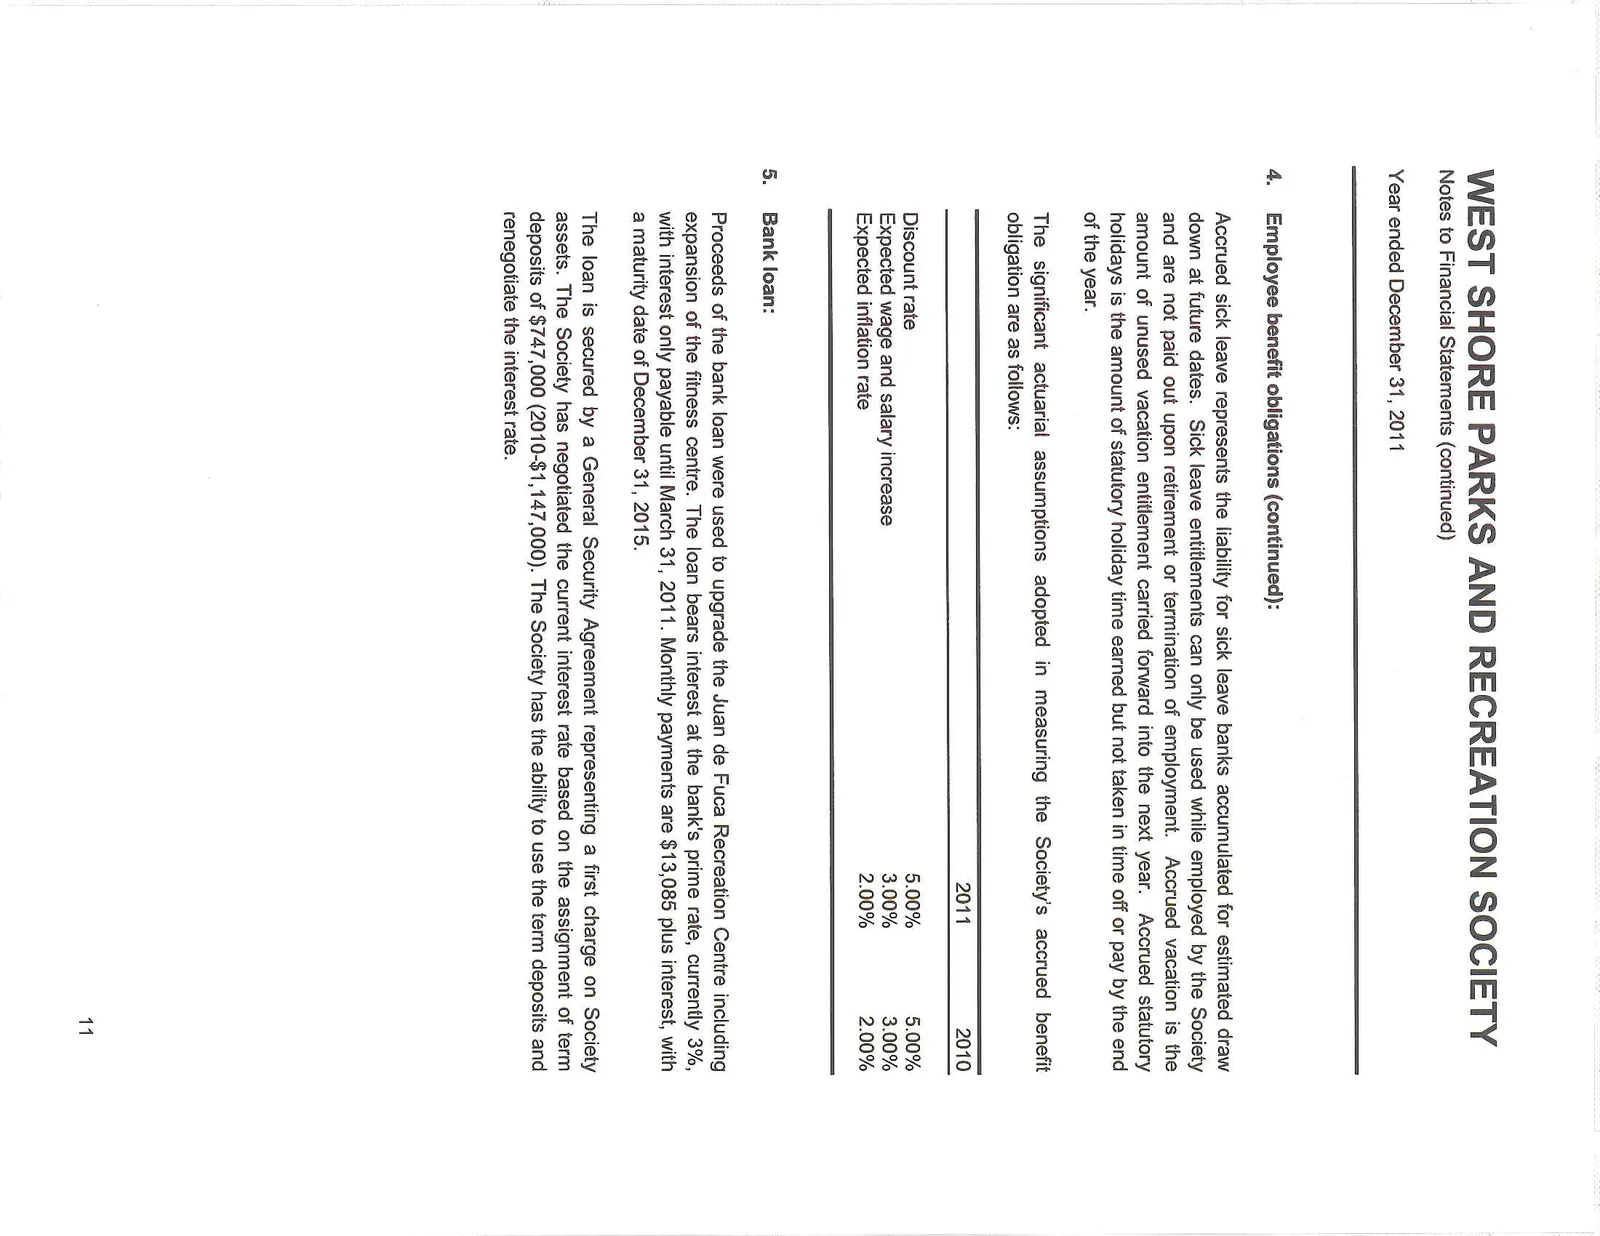
Accrued sick leave represents the liability for sick leave banks accumulated for estimated draw down at future dates. Sick leave entitlements can only be used while employed by the Society and are not paid out upon retirement or termination of employment. Accrued vacation is the amount of unused vacation entitlement carried forward into the next year. Accrued statutory holidays is the amount of statutory holiday time earned but not taken in time off or pay by the end of the year.
The significant actuarial assumptions adopted in measuring the Society's accrued benefit obligation are as follows:
| 2011 | 2010 | |
|---|---|---|
| Discount rate | 5.00% | 5.00% |
| Expected wage and salary increase | 3.00% | 3.00% |
| Expected inflation rate | 2.00% | 2.00% |
5. Bank loan:
Proceeds of the bank loan were used to upgrade the Juan de Fuca Recreation Centre including expansion of the fitness centre. The loan bears interest at the bank's prime rate, currently 3%, with interest only payable until March 31, 2011. Monthly payments are $13,085 plus interest, with a maturity date of December 31, 2015.
The loan is secured by a General Security Agreement representing a first charge on Society assets. The Society has negotiated the current interest rate based on the assignment of term deposits of $747,000 (2010-$1,147,000). The Society has the ability to use the term deposits and renegotiate the interest rate.
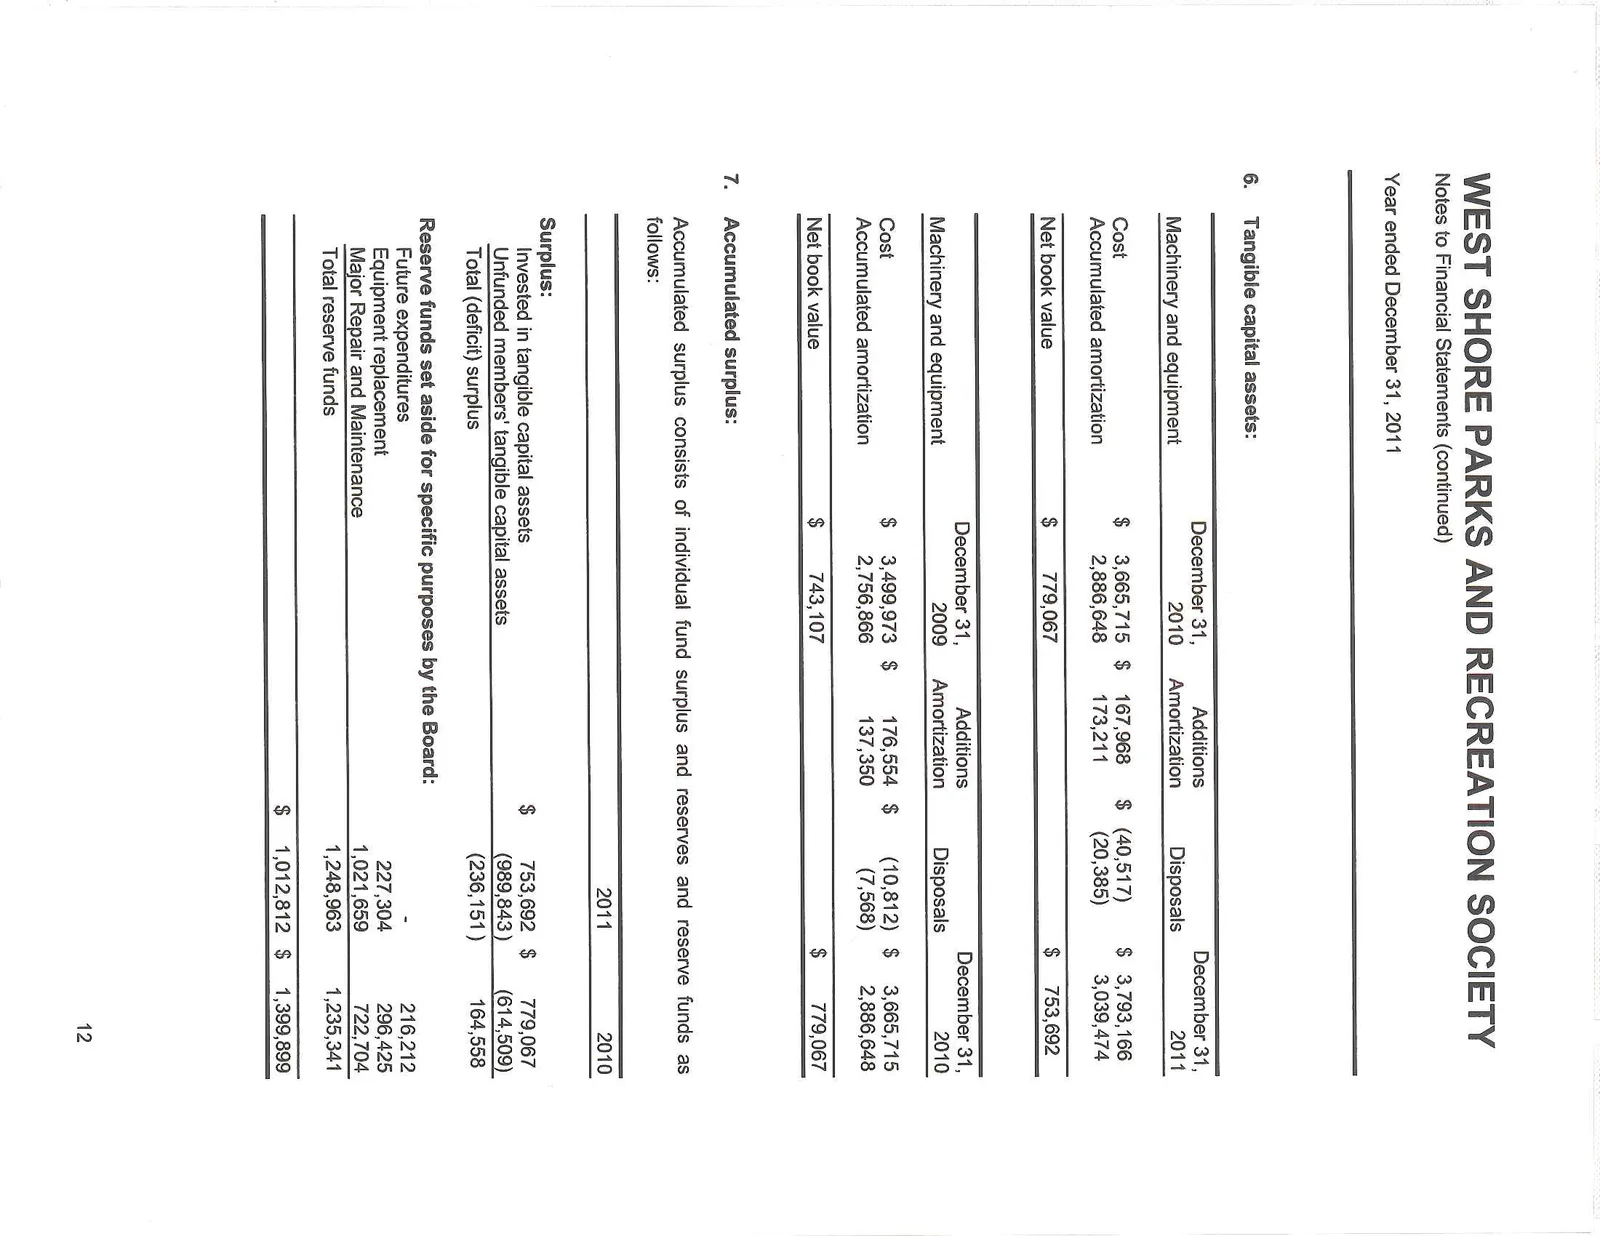
6. Tangible capital assets:
| Machinery and equipment | December 31, 2010 | Additions Amortization | Disposals | December 31, 2011 |
|---|---|---|---|---|
| Cost | $ 3,665,715 | $ 167,968 | $ (40,517) | $ 3,793,166 |
| Accumulated amortization | 2,886,648 | 173,211 | (20,385) | 3,039,474 |
| Net book value | $ 779,067 | $ 753,692 |
| Machinery and equipment | December 31, 2009 | Additions Amortization | Disposals | December 31, 2010 |
|---|---|---|---|---|
| Cost | $ 3,499,973 | $ 176,554 | $ (10,812) | $ 3,665,715 |
| Accumulated amortization | 2,756,866 | 137,350 | (7,568) | 2,886,648 |
| Net book value | $ 743,107 | $ 779,067 |
7. Accumulated surplus:
Accumulated surplus consists of individual fund surplus and reserves and reserve funds as follows:
| 2011 | 2010 | |
|---|---|---|
| Surplus: | ||
| Invested in tangible capital assets | $ 753,692 | $ 779,067 |
| Unfunded members' tangible capital assets | (989,843) | (614,509) |
| Total (deficit) surplus | (236,151) | 164,558 |
| Reserve funds set aside for specific purposes by the Board: | ||
| Future expenditures | - | 216,212 |
| Equipment replacement | 227,304 | 296,425 |
| Major Repair and Maintenance | 1,021,659 | 722,704 |
| Total reserve funds | 1,248,963 | 1,235,341 |
| $ 1,012,812 | $ 1,399,899 |
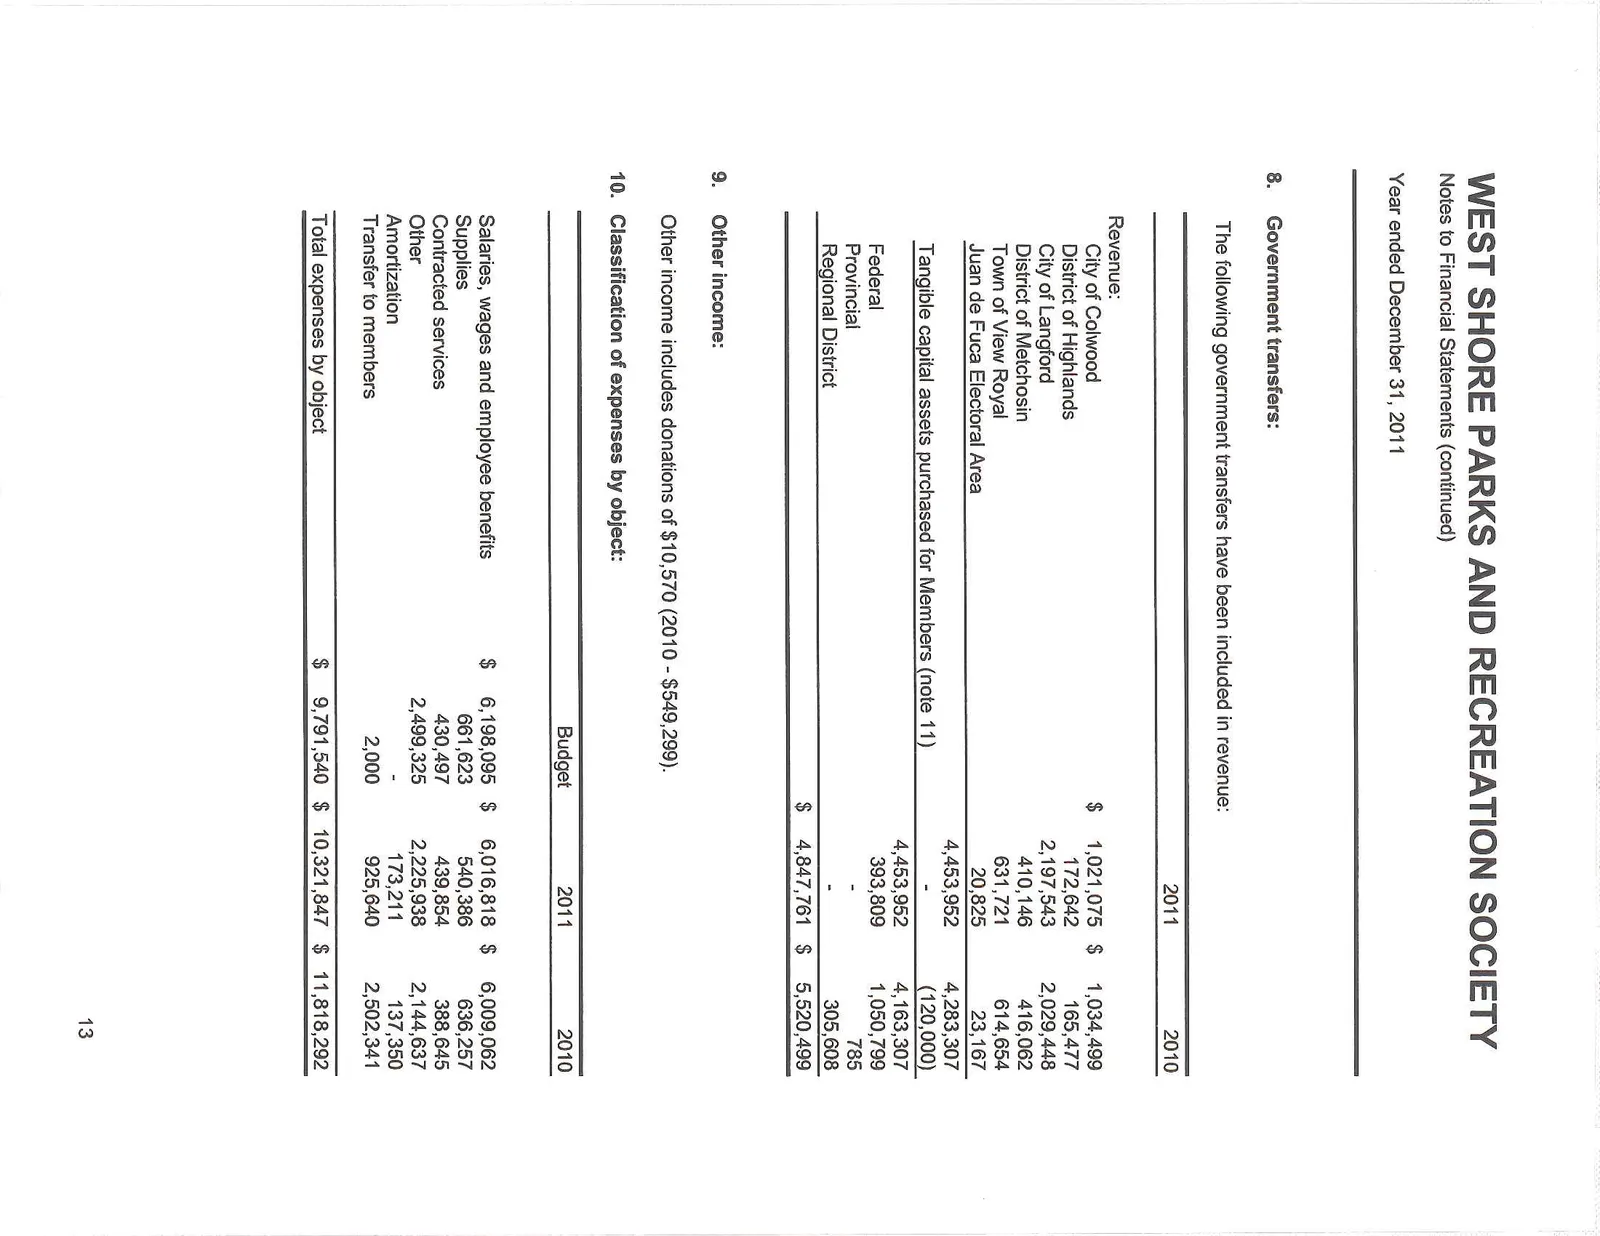
8. Government transfers:
The following government transfers have been included in revenue:
| 2011 | 2010 | |
|---|---|---|
| Revenue: | ||
| City of Colwood | $ 1,021,075 | $ 1,034,499 |
| District of Highlands | 172,642 | 165,477 |
| City of Langford | 2,197,543 | 2,029,448 |
| District of Metchosin | 410,146 | 416,062 |
| Town of View Royal | 631,721 | 614,654 |
| Juan de Fuca Electoral Area | 20,825 | 23,167 |
| 4,453,952 | 4,283,307 | |
| Tangible capital assets purchased for Members (note 11) | - | (120,000) |
| 4,453,952 | 4,163,307 | |
| Federal | 393,809 | 1,050,799 |
| Provincial | - | 785 |
| Regional District | - | 305,608 |
| $ 4,847,761 | $ 5,520,499 |
9. Other income:
Other income includes donations of $10,570 (2010 - $549,299).
10. Classification of expenses by object:
| Budget | 2011 | 2010 | |
|---|---|---|---|
| Salaries, wages and employee benefits | $ 6,198,095 | $ 6,016,818 | $ 6,009,062 |
| Supplies | 661,623 | 540,386 | 636,257 |
| Contracted services | 430,497 | 439,854 | 388,645 |
| Other | 2,499,325 | 2,225,938 | 2,144,637 |
| Amortization | - | 173,211 | 137,350 |
| Transfer to members | 2,000 | 925,640 | 2,502,341 |
| Total expenses by object | $ 9,791,540 | $ 10,321,847 | $ 11,818,292 |
11. Transfer to members:
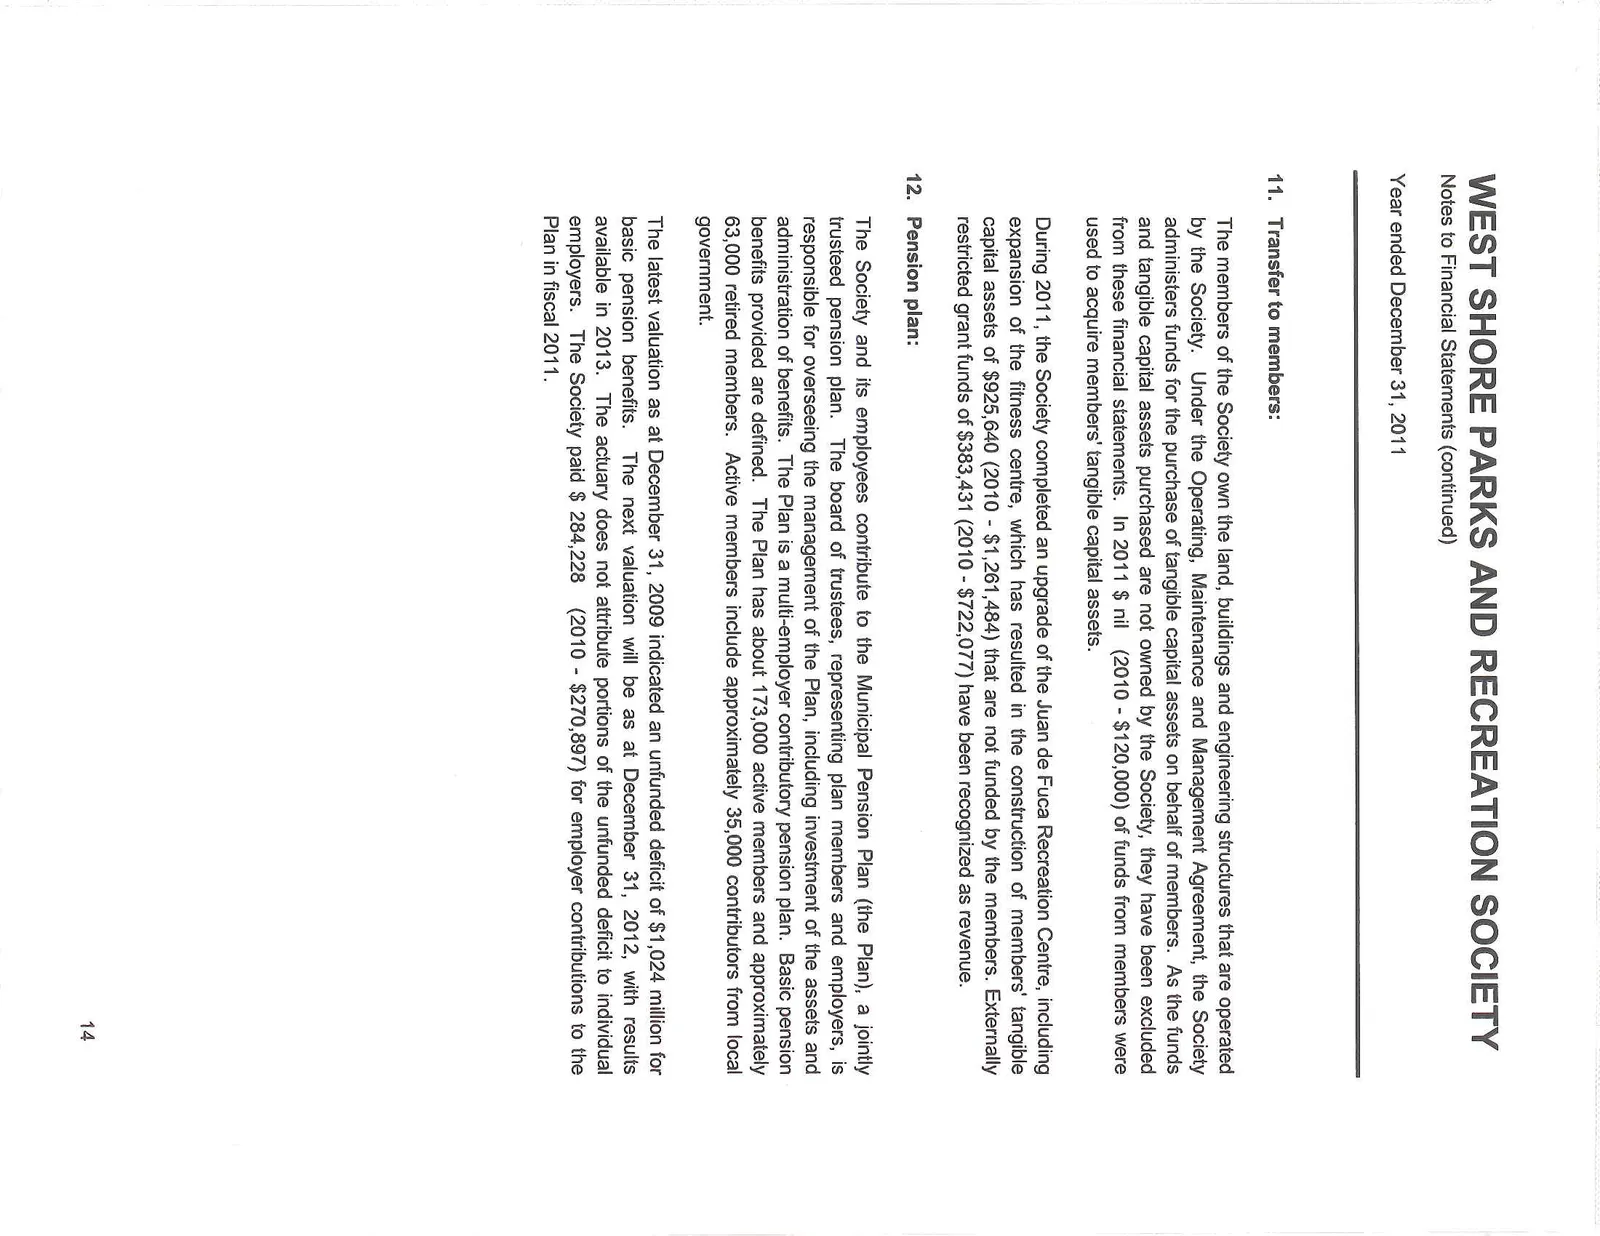
The members of the Society own the land, buildings and engineering structures that are operated by the Society. Under the Operating, Maintenance and Management Agreement, the Society administers funds for the purchase of tangible capital assets on behalf of members. As the funds and tangible capital assets purchased are not owned by the Society, they have been excluded from these financial statements. In 2011 $ nil (2010 - $120,000) of funds from members were used to acquire members' tangible capital assets.
During 2011, the Society completed an upgrade of the Juan de Fuca Recreation Centre, including expansion of the fitness centre, which has resulted in the construction of members' tangible capital assets of $925,640 (2010 - $1,261,484) that are not funded by the members. Externally restricted grant funds of $383,431 (2010 - $722,077) have been recognized as revenue.
12. Pension plan:
The Society and its employees contribute to the Municipal Pension Plan (the Plan), a jointly trusteed pension plan. The board of trustees, representing plan members and employers, is responsible for overseeing the management of the Plan, including investment of the assets and administration of benefits. The Plan is a multi-employer contributory pension plan. Basic pension benefits provided are defined. The Plan has about 173,000 active members and approximately 63,000 retired members. Active members include approximately 35,000 contributors from local government.
The latest valuation as at December 31, 2009 indicated an unfunded deficit of $1,024 million for basic pension benefits. The next valuation will be as at December 31, 2012, with results available in 2013. The actuary does not attribute portions of the unfunded deficit to individual employers. The Society paid $ 284,228 (2010 - $270,897) for employer contributions to the Plan in fiscal 2011.
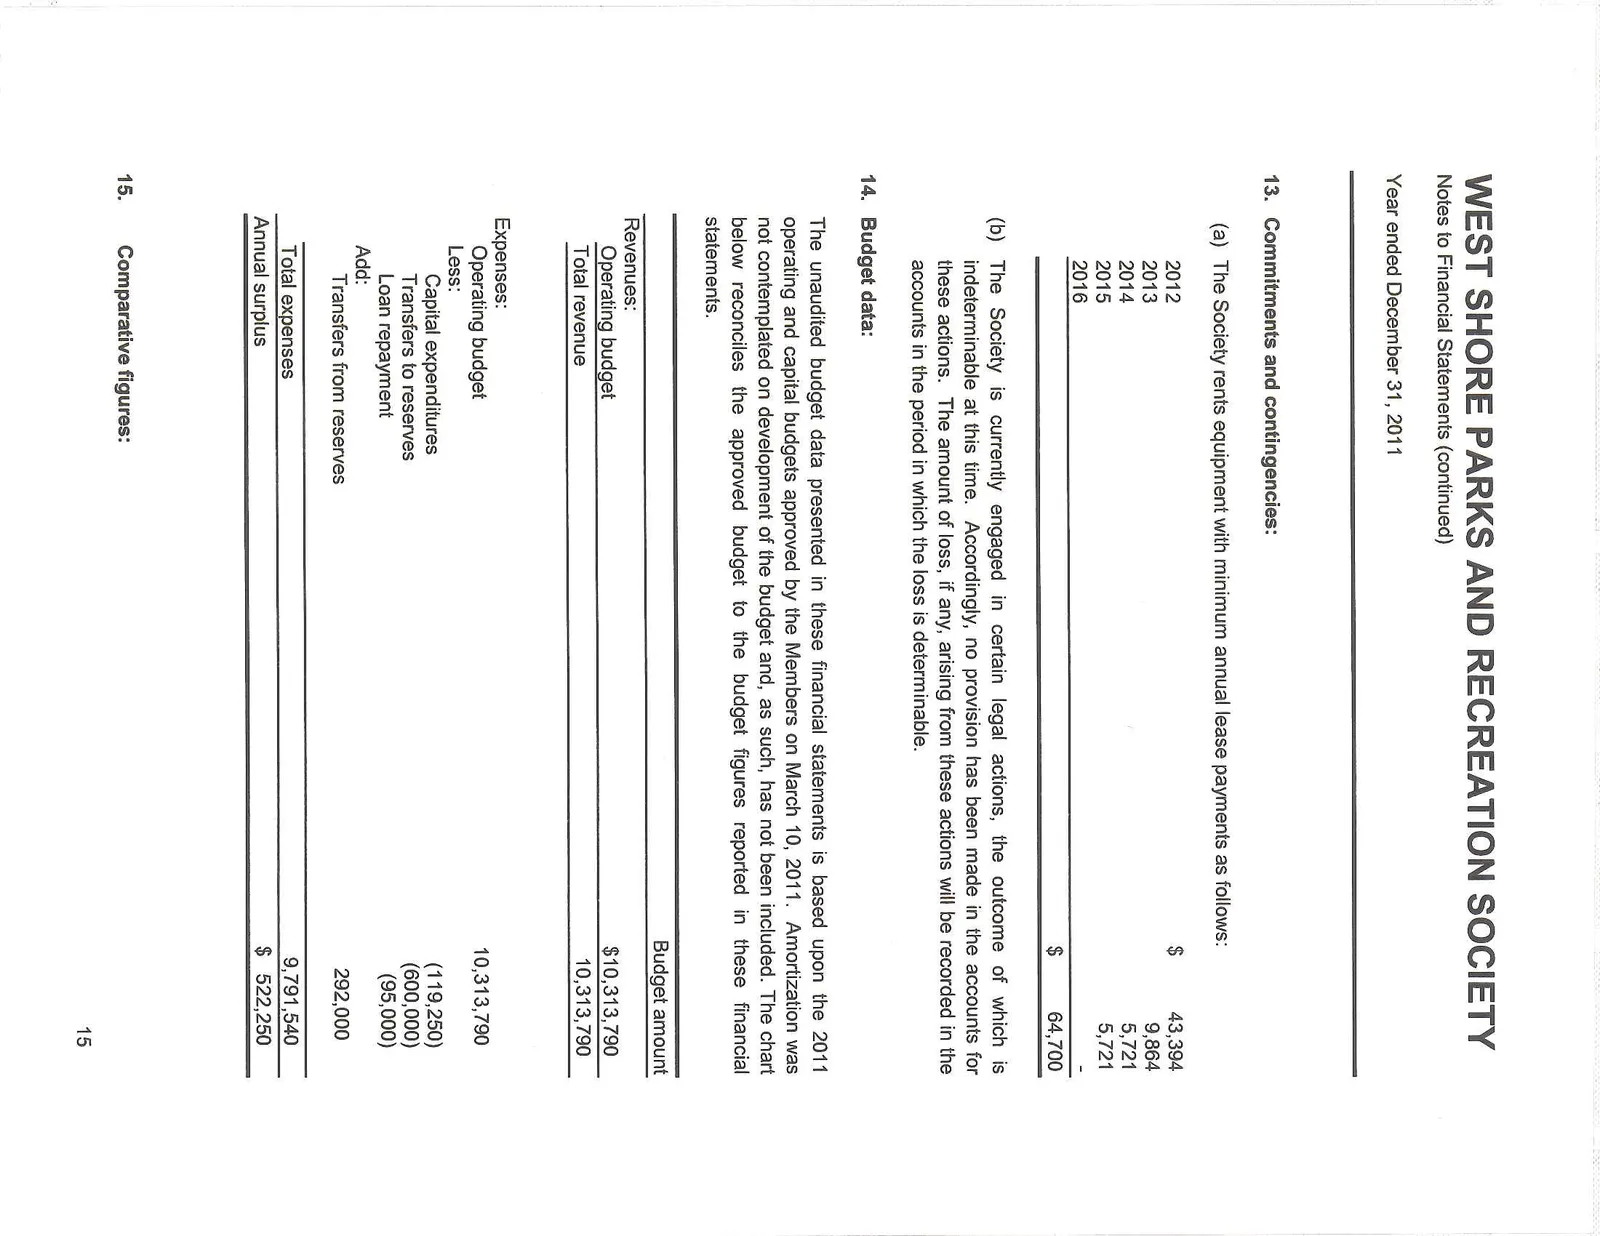
13. Commitments and contingencies:
(a) The Society rents equipment with minimum annual lease payments as follows:
| Year | Amount |
|---|---|
| 2012 | $ 43,394 |
| 2013 | 9,864 |
| 2014 | 5,721 |
| 2015 | 5,721 |
| 2016 | - |
| Total | $ 64,700 |
(b) The Society is currently engaged in certain legal actions, the outcome of which is indeterminable at this time. Accordingly, no provision has been made in the accounts for these actions. The amount of loss, if any, arising from these actions will be recorded in the accounts in the period in which the loss is determinable.
14. Budget data:
The unaudited budget data presented in these financial statements is based upon the 2011 operating and capital budgets approved by the Members on March 10, 2011. Amortization was not contemplated on development of the budget and, as such, has not been included. The chart below reconciles the approved budget to the budget figures reported in these financial statements.
| Budget amount | |
|---|---|
| Revenues: | |
| Operating budget | $ 10,313,790 |
| Total revenue | 10,313,790 |
| Expenses: | |
| Operating budget | 10,313,790 |
| Less: | |
| Capital expenditures | (119,250) |
| Transfers to reserves | (600,000) |
| Loan repayment | (95,000) |
| Add: | |
| Transfers from reserves | 292,000 |
| Total expenses | 9,791,540 |
| Annual surplus | $ 522,250 |
15. Comparative figures:
Certain comparative figures have been reclassified to conform with the financial statement presentation adopted for the current year.
Document Images
(19)