Town of View Royal ANNUAL REPORT Year Ended December 31, 2011
The Town's official annual report for 2011, detailing strategic achievements, community statistics, and audited financial statements.
Town of View Royal Annual Report
Year Ended December 31, 2011


Table of Contents
- COMMUNITY PROFILE ..................................................................................................... 3
- MESSAGE FROM THE MAYOR .......................................................................................... 5
- MAYOR & COUNCIL........................................................................................................ 6
- ORGANIZATIONAL CHART ............................................................................................ 8
- VISION, MISSION, VALUES ................................................................................................ 9
- SUMMARY OF SERVICES & OPERATIONS ...................................................................... 11
- MUNICIPAL HIGHLIGHTS............................................................................................... 12
- 2011 MUNICIPAL GOALS & OBJECTIVES .................................................................... 14
- SUSTAINABLE VIEW ROYAL ........................................................................................... 15
- WELL PLANNED, LIVABLE COMMUNITY...................................................................... 17
- TRANSPORTATION ......................................................................................................... 19
- SAFE & PROTECTED COMMUNITY ............................................................................... 21
- ORGANIZATIONAL EXCELLENCE ................................................................................. 23
- LOOKING AHEAD .......................................................................................................... 24
- FINANCIAL INFORMATION ............................................................................................ 27
Community Profile
View Royal is divided into eight distinct precincts based on such factors as topography, major transportation corridors, natural environment and the age of housing stock. These precincts are:
- Craigflower
- Harbour
- Helmcken
- Hospital
- Thetis
- Burnside
- Atkins
- Wilfert
The municipality encompasses McKenzie Pike, Prior and Thetis Lakes and portions of Esquimalt Harbour and Portage Inlet and is situated adjacent to the established jurisdictions of the Township of Esquimalt, the District of Saanich, and the City of Colwood.

A gateway between Victoria's urban core and the growing West Shore municipalities, View Royal is a vibrant community. Residents and visitors enjoy View Royal’s beautiful parks and trails, colourful gardens, historic buildings, inspiring public art and unique shops and dining. With over 9,300 residents, View Royal is one of the best places to call home.
This year’s Annual Report outlines the Town of View Royal’s achievements and major projects for 2011. It shows the progress on our 2011 municipal goals and objectives, highlights financial reporting, and gives insight into plans for 2012-2014.
View Royal Fast Facts:
- INCORPORATION: DECEMBER 5, 1988
- POPULATION: 9,380*
- LAND AREA: 2,499 HECTARES
- PARKLAND: 732 HECTARES
*as certified by Statistics Canada, Census, 2011

Message from the Mayor
VIEW ROYAL: ONE OF THE BEST PLACES TO CALL HOME
On behalf of View Royal Council, I am pleased to share this year’s Annual Report, which outlines our key objectives and accomplishments for the year of 2011.
Residents can be proud that View Royal is a town of vision and values; one that continues to become a more respected member of the greater community. Goals have been reached and much has been accomplished in 2011 for View Royal. Projects developed to encourage a thriving, safe community that respects and sustains your investment and home in View Royal were made possible by the combined efforts of Council and staff, volunteers, neighbours, institutions and the Region.
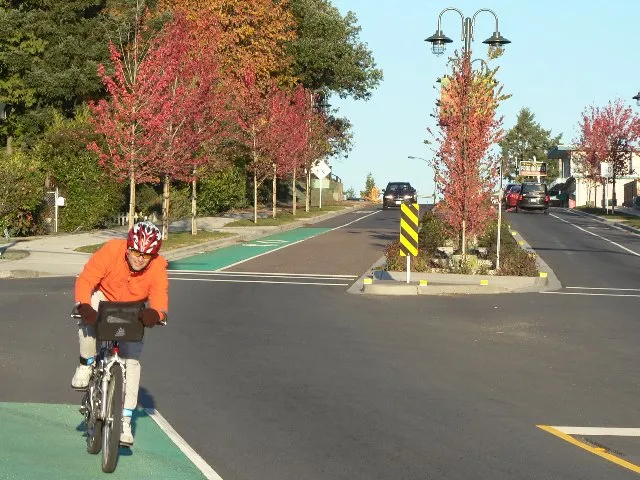
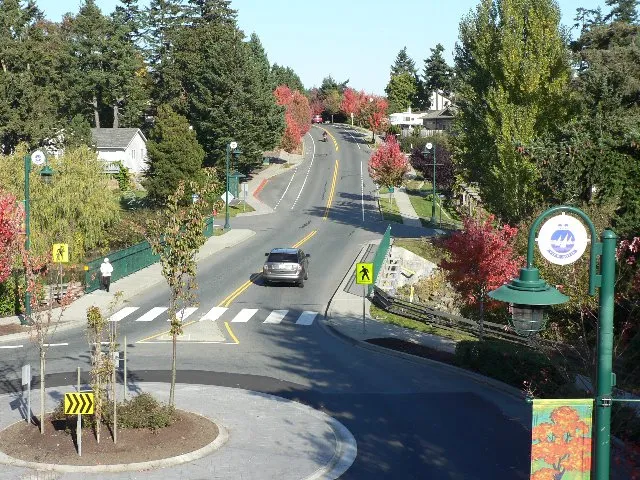
A great accomplishment in 2011 for View Royal is the completion of the Island Highway improvement project. We can confidently say that we have achieved our goals of improving road safety, cleaning up our environment, and making traffic flow more smoothly. Residents enjoy new cycle lanes, sidewalks, turning lanes, and planted medians, all enhanced by what has been called the most striking work of public art in South Vancouver Island, the dramatic stone mural wall.
This project is just one example of the many accomplishments of the Town of View Royal that are outlined in this Annual Report. I hope you will take a moment to review our achievements for 2011, and learn more about our efforts towards achieving a community that is livable, green, and sustainable.
View Royal is committed to stay faithful to our values, to set innovative standards and continue to build and sustain View Royal as one of the best places to live. One of the best places to call home.
Graham Hill
Mayor & Council
The Mayor and Council of the Town of View Royal were elected for a three-year term in the municipal election held in November 2008.
Each member is appointed to Town and regional committees.


Mayor Graham Hill (December 2, 2002 - present)
- Finance & Administration - Chair
- CRD Board/Committee of the Whole
- CRD Hospital Board
- CRD Core Area Liquid Waste Management
- CRD Finance & Corporate Services
- CRD Planning, Transportation & Protective Services
- Island Corridor Foundation
- Tourism Victoria
- Municipal Insurance Association
- Victoria Chamber of Commerce

Councillor Andrew Britton (December 6, 2005 - December 5, 2011)
- Public Works & Transportation - Chair
- Joint School District/Municipal Committee
- Parents Advisory Committee
- Victoria Family Court & Youth Justice Committee

Councillor Ron Mattson (December 6, 2011 - present)
- Public Works & Transportation - Chair
- Parents Advisory Committee
- Victoria Family Court & Youth Justice Committee

Councillor Heidi Rast (December 2, 2008 - present)
- Protective Services & Community Services - Chair
- Capital Region Emergency Service Telecommunications (CREST)
- Community Policing
- Joint School District/Municipal Committee
- Official Community Plan Committee
- Police Building Liaison Committee
- Westshore Parks & Recreation Society
Councillor John Rogers (December 2, 1996 - present)
- Planning & Development - Chair
- CRD Climate Action Steering Committee
- CRD Housing Trust Fund Commission
- CRD Water Supply Commission
- Esquimalt Harbour Advisory Committee
- Friends of Cole Island
- Island Corridor Foundation
- Juan de Fuca Water Distribution Commission
- View Royal Archives
- CRD Harbours Environmental Action Program Cost-Sharing Sub-Committee
Councillor David Screech (December 2, 2002 - present)
- Parks, Recreation & Environment - Chair
- CRD Arts Committee
- Greater Victoria Public Library
- Island Highway Improvement Project
- Millstream Site Remediation
- View Royal Reading Centre
- View Royal Park Plan Project
- Westshore Chamber of Commerce
- Westshore Parks & Recreation Society
2011 Town of View Royal Organizational Chart
Vision, Mission, Values
Town of View Royal is determined to be one of the best places to call home: livable, green and sustainable.
Mission
The Town of View Royal fosters the social, environmental and economic well-being of the community, providing for:
- good government,
- services, laws and other matters for community benefit, and
- effective stewardship of public assets.
Values & Operating Philosophy
Town of View Royal Council members, staff and committees will be:
- Vision driven: our primary responsibility is to make community ambition become reality
- Committed to the common good: attuned to overall community need and regulatory requirements
- Proactive, progressive and innovative: open to opportunity and better ways of doing business
- Ethical, fair and honest
- Citizen driven: friendly, responsive and respectful of diverse views
- Excellent communicators: consultative, transparent, open and accessible
- Collaborative and cooperative: building alliances with community organizations and regional partners towards shared outcomes
- Informed and evidence driven: balancing opinion with fact and intelligence
- Accountable and fiscally responsible: making best and most efficient use of all resources entrusted to us
- Professional: committed to consistent application of policy and best practices, to due diligence and to the orderly conduct of municipal business.


Summary of Services & Operations
The TOWN OF VIEW ROYAL is responsible for the provision of a wide variety of local services and programs. These include:
- Transportation network (e.g. roads, bridges, street cleaning, sidewalks)*
- Stormwater management
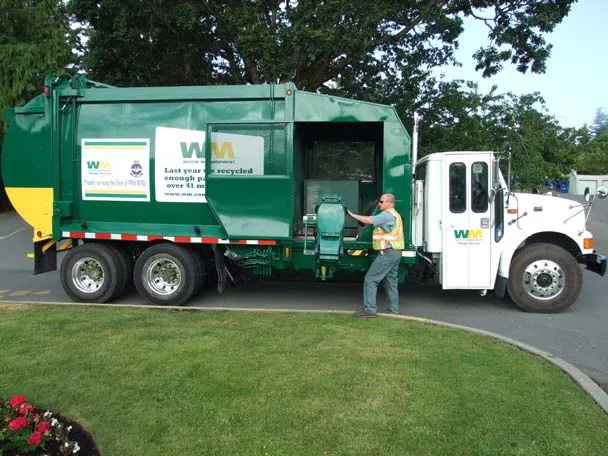
- Garbage/household food waste collection
- Sanitary sewer collection system
- Parks, recreation and cultural facilities
- West Shore Royal Canadian Mounted Police (RCMP)
- Fire protection and inspection
- Emergency preparedness planning
- Land use planning
- Building permits
- Business licensing
- Bylaw establishment and enforcement
- Economic development
- Heritage and revitalization
*excludes Admirals Road, Six Mile Road and the Trans Canada Highway (Highway 1) which are controlled by the Ministry of Transportation & Infrastructure.
Town Services provided by OTHER organizations include:
- School system (Provincial Government and Local School Boards)
- Social and health programs (Provincial Government)
- Hospital care system (Provincial Government)
- Real property assessments (B.C. Assessment)
- Library collection and distribution system (Greater Victoria Public Library; Town is a part owner of the Downtown Branch)
- View Royal Reading Centre (Town provides partial support through a grant-in-aid)
- Planning and the management of public transit (Victoria Regional Transit System)
Town Services provided by the CAPITAL REGIONAL DISTRICT:
- Animal control
- Sewer system management
- Water management
- Recycling
The Town is represented on the following BOARDS AND COMMITTEES, which provide a variety of services to the residents of View Royal:
- Capital Regional District
- Capital Regional District Hospital
- Capital Regional District Housing Trust Fund Commission
- West Shore Parks & Recreation Society
- Greater Victoria Public Library
- Community Policing
2011 Municipal Highlights
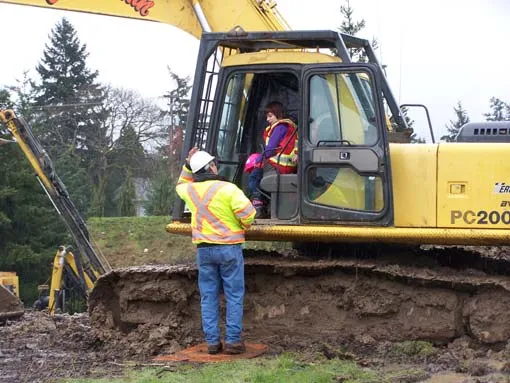
JENEECE PLACE BREAKS GROUND
Ground was broken on April 5, 2011 to begin building a home away from home for children and their families who have to travel to Victoria for medical care. Located in View Royal at the Victoria General Hospital, Jeneece Place was the dream of Jeneece Edroff, who spent much of her life traveling to Vancouver for treatment for neurofibromatosis. At age seven she began her famous penny drive to help kids and has since raised over $1 million.
ISLAND HIGHWAY IMPROVEMENT PROJECT COMPLETED
Celebrations took place on October 5, 2011 for the Grand Opening of the Island Highway. The goals of the Island Highway Improvement Project were focused on cleaning up the environment, improving road safety and making traffic flow more smoothly. Upgrades provide enhanced safety for all modes of transportation with new sidewalks, street lighting and road surface improvements. Landscaped and treed boulevards provide buffers between pedestrians and traffic on this busy roadway. Our environment benefits from new rain gardens, bioretention devices and bioswales in the boulevards that provide treatment of stormwater road run-off. Bike lanes connected to existing regional networks and new bus shelters allow for a viable alternative for commuters, and carbon emissions are reduced as traffic flow is improved from new left-turn lanes, bus pull-outs, and traffic lights. The Island Highway also showcases a stone mural wall by Vancouver Island’s own Andreas Kunert; an outstanding example of artisanship prominently displayed in View Royal for all to enjoy.
CRAIGFLOWER BRIDGE REPLACEMENT PROJECT
A $10 million dollar grant from the Federal Government will help fund the replacement of the Craigflower Bridge. Jointly owned by the Town of View Royal and District of Saanich, the two-lane timber trestle bridge along Craigflower Road was constructed in 1933 and remains substantially unchanged from that date. The bridge deck currently has very narrow sidewalks, thin and deteriorating asphalt overlays and no provision for bicycles. In addition to improved safety, a primary benefit of this project will be an increase in cycling and walking with the resultant improvement in health and reduction in auto-related pollution.

HIGHLIGHTS AT A GLANCE
- 262 business licenses issued in 2011 (99 commercial, 163 home-based businesses).
- Construction value of building permits issued in 2011 totaled $22,547,449.00.
- Hiring of a Planning Technician, Executive Assistant, Senior Planner, Engineering Clerk/GIS Assistant, Corporate Services Clerk/Receptionist, and Accounting Clerk 2 to replace vacancies.
- Online and telephone banking provided as a method of payment for property taxes.
- Rainfall on over 12,000m² of roadway now naturally treated by rain gardens prior to discharge into the environment.
- 2,600m of new sidewalks and 2,900m of new bike lanes added.
- Island Highway improvement project completed.
- Responded to 28 Freedom of Information requests.
- Home Owner Grant applications made available online.
- Land purchased for future Public Safety Building.
- Sewer user fees implemented.
- New Tree Protection Bylaw adopted.
- 49,250m² of new parkland added.
- Official Community Plan review completed.
2011 Municipal Goals & Objectives
The municipal goals and objectives set for 2009, 2010 and 2011 are identified in the Town of View Royal’s Strategic Plan that was adopted by Council in 2009. The Strategic Plan outlines five key strategic priorities for the Town:
- Sustainable View Royal,
- Well Planned, Livable Community,
- Transportation,
- Safe and Protected Community, and
- Organizational Excellence.

Strategic Priority: Sustainable View Royal
We manage View Royal in challenging times and continue to be progressive about our economic, social and environmental sustainability. Together we will build a strong community identity; take steps to ensure economic and fiscal health into the future; continue our commitment to environmental stewardship; and responsibly maintain our existing infrastructure.
Desired Outcomes:
- A strong identity – a unique town with its own attitude, character and common purpose;
- Economic and fiscal health – the sustainability foundation;
- Environmental stewardship – green lifestyles and operations, ecological protection;
- Social diversity – a welcoming an accessible town;
- Well maintained infrastructure.
2011 Initiatives: Sustainable View Royal
| Initiative | Outcome |
|---|---|
| Complete a Community Energy & Green House Gas Emissions Plan. | The project included a community survey, multiple open houses and detailed assessment of data about energy use in View Royal. A Community Climate Action Plan was adopted on June 5, 2012. |
| Adopt Stormwater Bylaws | 2012 Budget. |
| Complete a review of Subdivision Servicing Standards. | Currently developing the RFP; to be awarded at the July 2012 Committee of the Whole Meeting. |
Strategic Priority: Well Planned, Livable Community
View Royal must take advantage of every opportunity in the next three years to ensure a healthy, livable and balanced town that supports the lifestyles and provides the services that our residents require.
Desired Outcomes:
- A complete and balanced community;
- Well serviced neighbourhoods;
- Active, healthy lifestyles;
- Increased housing options to support social diversity;
- Linked and integrated plans – RGS, Strategic Plan, OCP, Parks Plan, Transportation Plan, Trails Plan, Sidewalk Plan etc.
2011 Initiatives: Well Planned, Livable Community
| Initiative | Outcome |
|---|---|
| Adopt Official Community Plan update. | After two years of community consultation and background research, a new Official Community Plan was adopted in October 2011. |
| Revise Transportation Plan and Sidewalks/Trails Plan based on approved Official Community Plan (including implementation plan based on priorities). | Currently developing the RFP; to be awarded at the July 2012 Committee of the Whole Meeting. |
| Develop a land acquisition and disposition policy. | In the process of compiling examples from other local governments from which to formulate a policy for View Royal. |
| Implement the View Royal Park Plan. | Developing an Implementation Plan to be presented at July 2012 Committee of the Whole. |
| Complete the Official Community Plan- related to Land Use Bylaw Update, budget contingent. | Deferred to 2012. |
Strategic Priority: Transportation
View Royal is a regional transportation and utilities hub. We will have many opportunities to systematically solve persistent traffic problems, embrace active and green transportation alternatives, and influence regional transportation policy for the benefit of our residents and businesses.
Desired Outcomes:
- Commitment to active and green transportation;
- Efficient regional hub (TCH, Island Highway, E&N Rail);
- Safe, calm and efficient movement of commuter traffic;
- Viable alternatives for commuters currently using Island Highway;
- A walkable town.
2011 Initiatives: Transportation
| Initiative | Outcome |
|---|---|
| Update parking standards and bike facility requirements in the Land Use Bylaw. | This project has been deferred pending a review of the Land Use Bylaw, currently scheduled for 2012/13. |
| Complete sidewalk and cycling lane projects (Colwood border to Parson’s Bridge). | Sidewalk and cycling lane projects are complete. |
| Complete the Island Highway Improvement Project. | Project work is complete and is now in the warranty period. |
| Develop E&N Rail Trail Connectors (to View Royal Park). | Completed. More in future year budgets. |
Strategic Priority: Safe & Protected Community
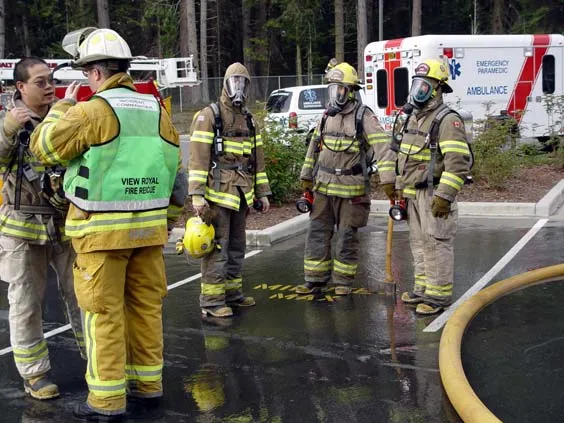
Safety and security of our residents and property is always of paramount importance. Given the potential risks that face the community, optimal police, fire and ambulance service is a desired outcome.
Desired Outcomes:
- Effective, rationalized and coordinated emergency and disaster response;
- Improved sense of safety and security;
- A community committed to crime prevention and emergency preparedness.
2011 Initiatives: Safe & Protected Community
| Initiative | Outcome |
|---|---|
| Complete the Business Continuity Plan. | A draft version of the Business Continuity Plan is complete and the final review is underway. |
| Complete the Public Safety Building Design. | Phase 1 of the Design Process is complete. A Schematic Design has been prepared by Hughes Condon Marler Architects through a series of public engagement meetings. |
Strategic Priority: Organizational Excellence
We must constantly strive to provide optimal governance, administrative and operational services. Our priority will be on improving communications, financial stewardship, and upgrading business systems.
Desired Outcomes:
- Effective and strategic allocation of financial and human resources;
- Financial sustainability and stewardship of municipal assets;
- Effective internal and external communications;
- Municipal facilities and business systems that support outstanding service and high productivity.
2011 Initiatives: Organizational Excellence
| Initiative | Outcome |
|---|---|
| Implement a Geographical Information System (GIS). | Implementation is ongoing. New maps have been created. |
| Complete an upgrade of the Records Management System | Work is on-going with the Development Services and Engineering Departments inputting their files into the system. A Records Disposition Policy has been drafted. The purchase of new Records Management Software is anticipated in 2012. |
Looking Ahead 2012 - 2014
Three Strategic Priorities have been identified for 2012 to 2014. The foundation bar at the bottom recognizes the reality and importance of ongoing work related to the core and fiduciary responsibilities of the Town; work that requires significant investment of time and dollars over and above the flow of regular duties.
ENSURING FINANCIAL SUSTAINABILITY: the next years will require strategic focus on financial sustainability.
| Project/Initiative | Timing |
|---|---|
| Develop an evidence based Cost Projections related to Master Plans and Asset Management, and a Long Term Financial Plan | 2012/13 |
| Develop an Economic Development Strategy | Initial work: 2012, Follow-up studies: 2013/14 |
| Implement a Tangible Asset Management System | On going |
| Create a Reserve Review and Policy | 2012 |
RESPONDING TO INCREASING EXPECTATIONS: the Town will be challenged to respond to and manage these increasing expectations and financial sustainability simultaneously.
| Project/Initiative | Timing |
|---|---|
| Complete a Service Review: define service level expectations and standards, align resources, compare baselines/practices with other municipalities, explore creative options for service effectiveness | 2012 |
| Develop a Performance Management System | On going; major review 2013/14 |
BUILDING COMMUNITY IDENTITY: we have made a great deal of progress on the physical, urban landscape front; the next three years provides an opportunity to strengthen our social sense of what it means to live in View Royal.
| Project/Initiative | Timing |
|---|---|
| Formalize/Finalize Town of View Royal Branding | 2012 |
| Prepare 25th Birthday Celebrations | 2013 |
| Identify and Protect Heritage Assets | On going |
| Develop a Volunteer Support Program | On going |
| Create a Town Profile | 2012 |
CRITICAL PROJECTS AND INITIATIVES: the Town must deliver on initiatives designed to meet legislated or regulatory requirements, projects already underway, and commitments made to the community in approved plans and reports.
| Project/Initiative | Timing |
|---|---|
| Fire Hall Replacement | 2012/13 |
| Craigflower Bridge Replacement | 2012 |
| Land Use Bylaw Update | 2012/13 |
| Servicing Standards and Subdivision Bylaws | 2012/13 |
| Implement Records Management System | 2012 |
| Implement View Royal Park Master Plan | Ongoing |
Financial Information
Fiscal year ended December 31, 2011
Financial Information Table of Contents
- Statement of Financial Information Approval ................................................................ 29
- Consolidated Financial Statements ................................................................................ 30
- Managements Responsibility for the Consolidated Financial Statements ............. 32
- Independent Auditors’ Report ................................................................................. 33
- Consolidated Statement of Financial Position .......................................................... 34
- Consolidated Statement of Operations ................................................................... 35
- Consolidated Statement of Change in Net Financial Assets ................................... 36
- Consolidated Statement of Cash Flows ................................................................... 37
- Notes to the Consolidated Financial Statements ..................................................... 38
- Schedule of Payments for Goods and Services .............................................................. 61
- Statement of Remuneration and Expenses ...................................................................... 63
- Statement of Gaurantee and Indemnity Agreements ...................................................... 64
- Statement of Severance Agreements ................................................................................ 65
- Statement of Permissive Tax Exemptions ........................................................................ 66
- Statement of Development Cost Charges ....................................................................... 67
- 5 Year Assessment and Property Tax Information .......................................................... 68
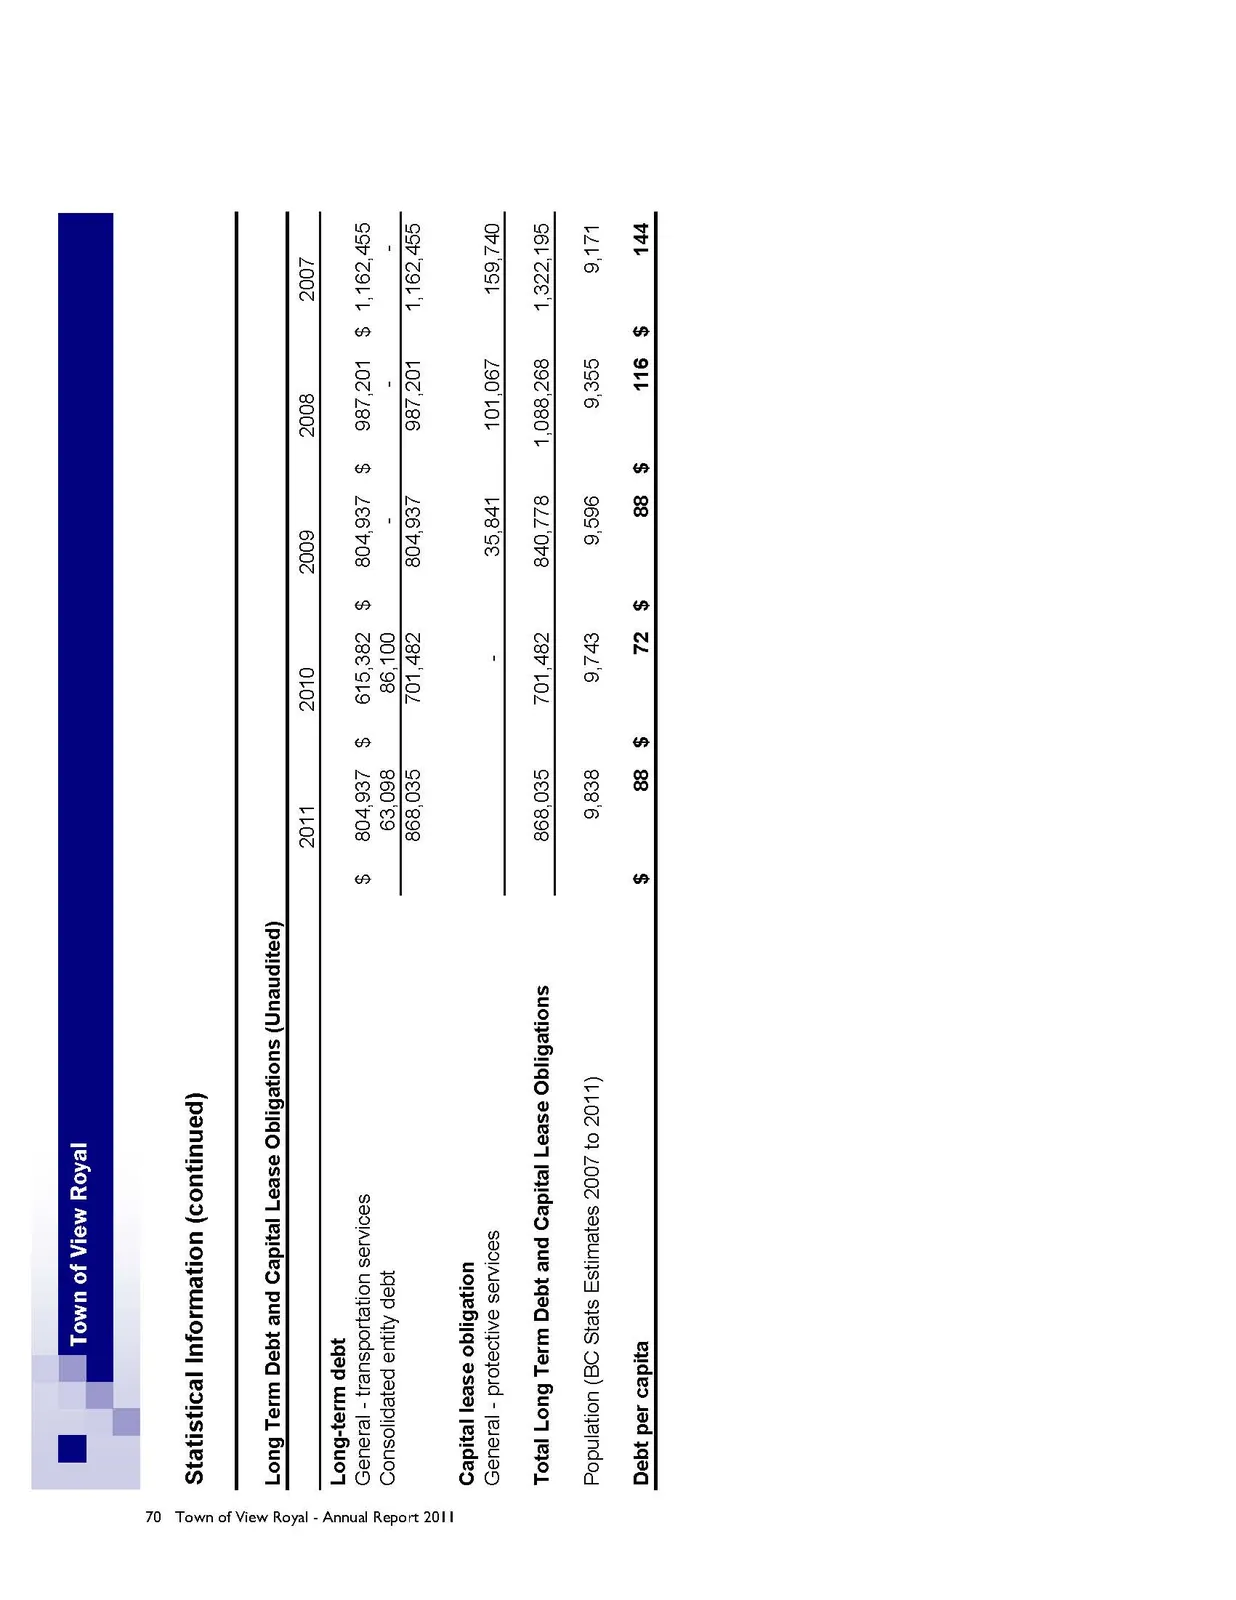
- Long Term Debt and Capital Lease Obligations ............................................................. 70
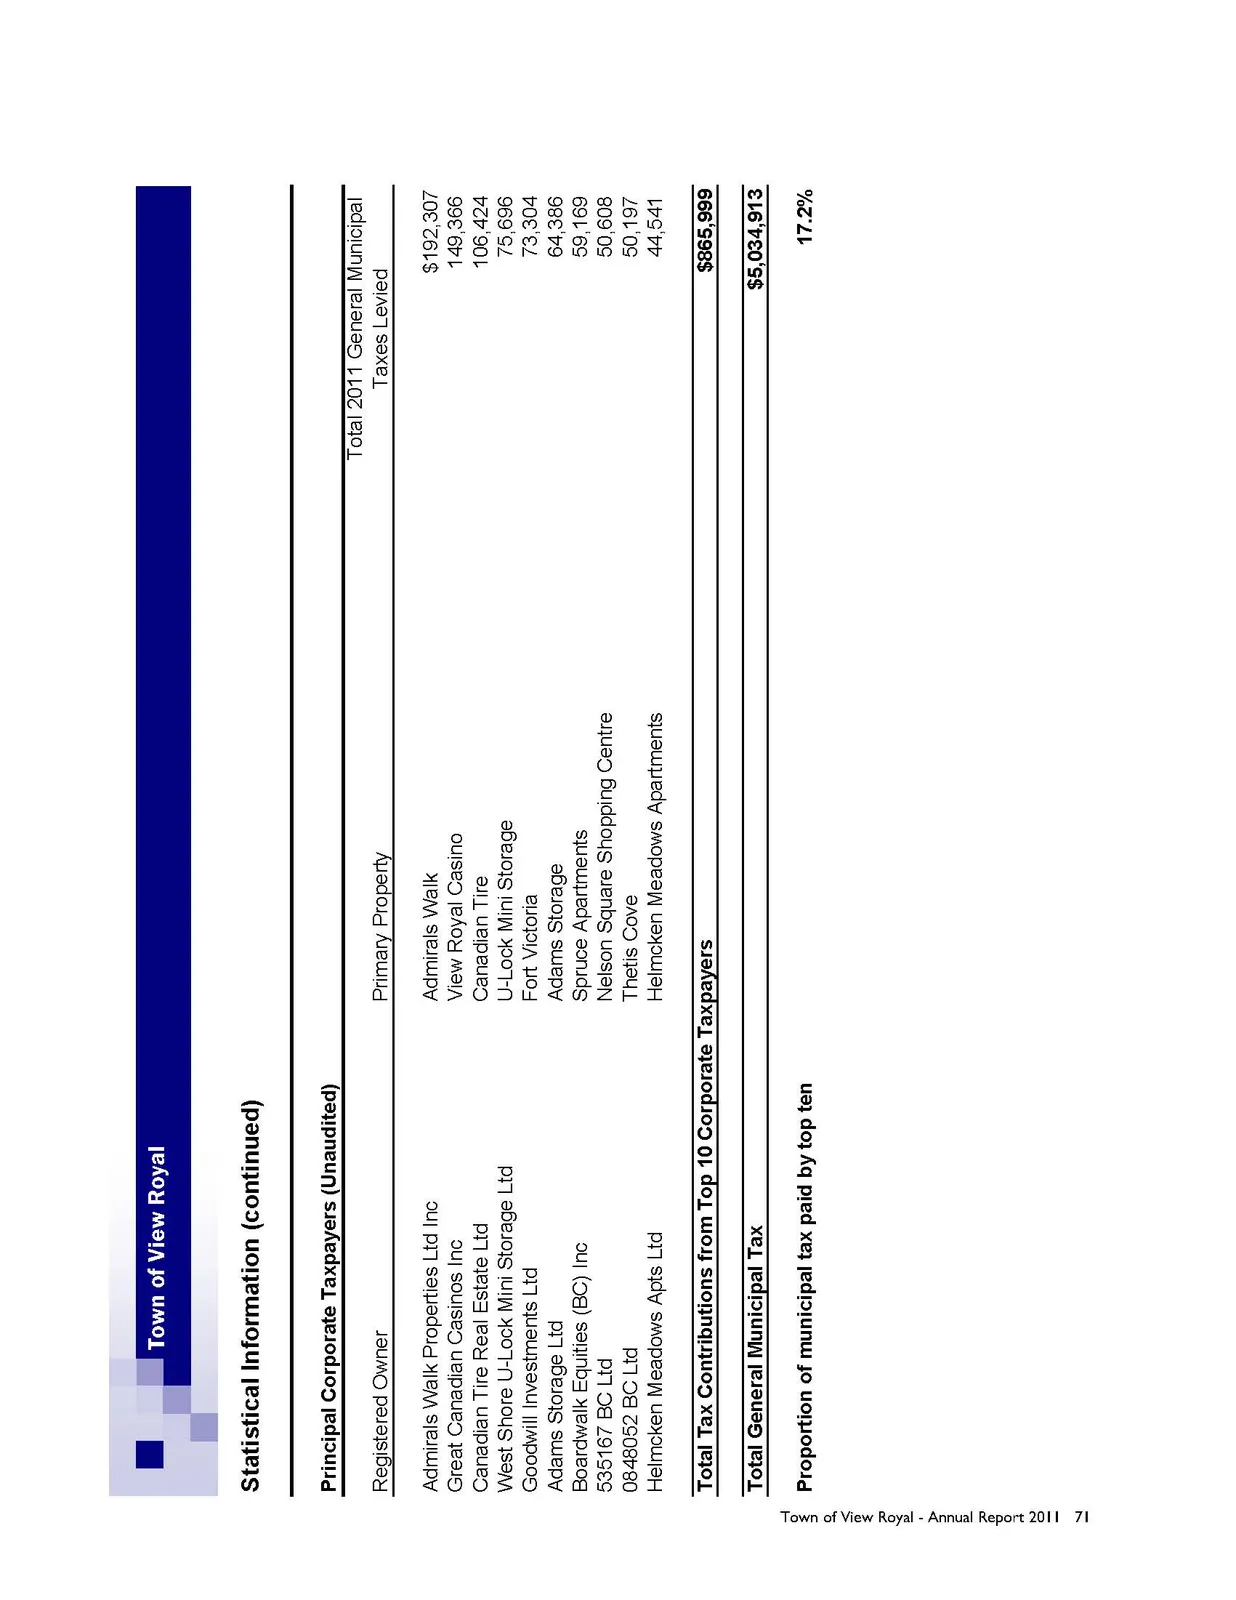
- Principal Taxpayers ............................................................................................................. 71
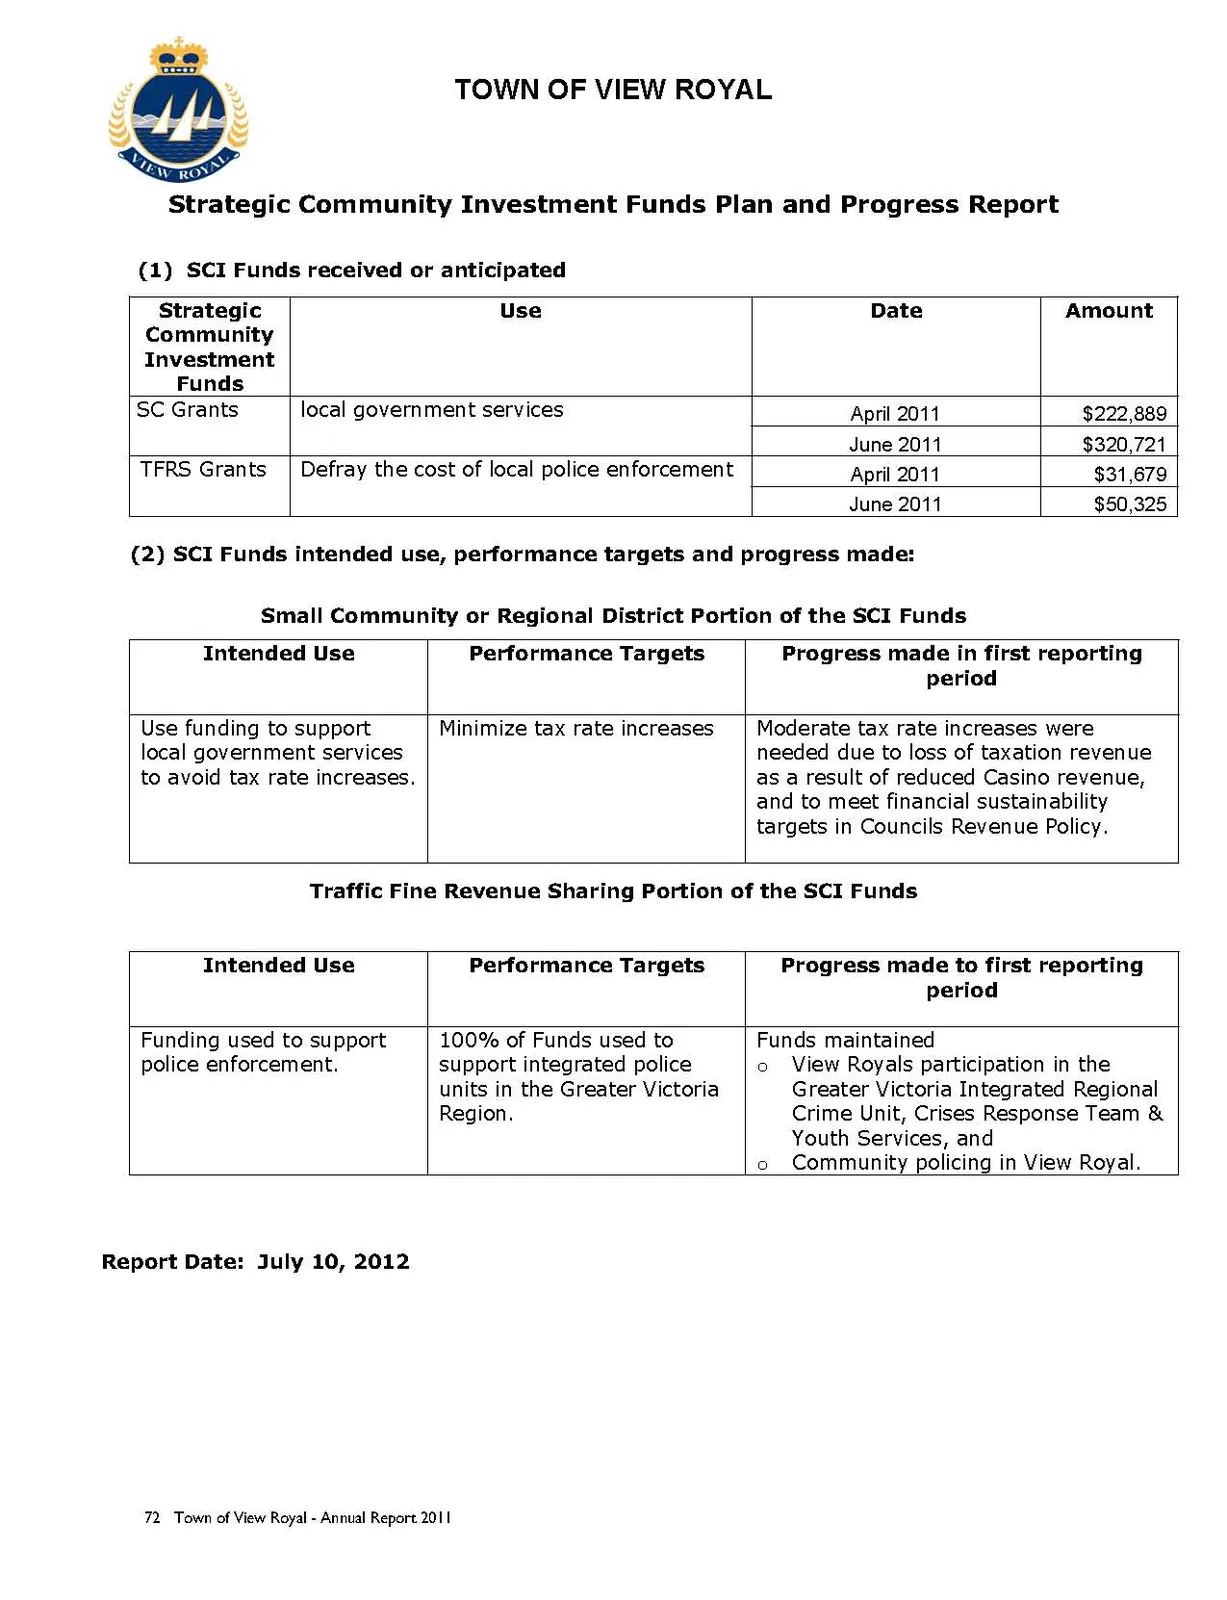
- Strategic Community Investment Funds Plan and Progress Report ............................ 72
Statement of Financial Information Approval
For the year ended December 31, 2011
The undersigned, as authorized by the Financial Information Regulation, Schedule I, subsection 9(2), approves all the statements and schedules included in this Statement of Financial Information, produced under the Financial Information Act.
Jeannie Beauchamp, CGA Director of Finance June 29, 2012
Graham Hill Mayor June 29, 2012
Prepared pursuant to the Financial Information Regulation, Schedule I, Section 9
MANAGEMENT'S RESPONSIBILITY FOR THE CONSOLIDATED FINANCIAL STATEMENTS
The accompanying consolidated financial statements of the Town of View Royal (the "Town") are the responsibility of Town's management and have been prepared in compliance with legislation, and in accordance with Canadian public sector accounting standards for local governments as recommended by the Public Sector Accounting Board of The Canadian Institute of Chartered Accountants. A summary of the significant accounting policies are described in the notes to the consolidated financial statements. The preparation of financial statements necessarily involves the use of estimates based on management's judgment, particularly when transactions affecting the current accounting period cannot be finalized with certainty until future periods.
The Town's management maintains a system of internal controls designed to provide reasonable assurance that assets are safeguarded, transactions are properly authorized and recorded in compliance with legislative and regulatory requirements, and reliable financial information is available on a timely basis for preparation of the consolidated financial statements. These systems are monitored and evaluated by management.
Mayor and Council meet with management and the external auditors to review the consolidated financial statements and discuss any significant financial reporting or internal control matters prior to their approval of the consolidated financial statements.
The consolidated financial statements have been audited by KPMG LLP, independent external auditors appointed by the Town. The accompanying Independent Auditors' Report outlines their responsibilities, the scope of their examination and their opinion on the Town's consolidated financial statements. Their opinion is based upon an examination conducted in accordance with Canadian generally accepted auditing standards, performing such test and other procedures as they consider necessary to obtain reasonable assurance that the consolidated financial statements are free of material misstatement and present fairly the financial position and results of the Town in accordance with Canadian public sector accounting standards.
Chief Administrative Officer Director of Finance
INDEPENDENT AUDITORS' REPORT
To the Mayor and Councillors of the Town of View Royal
We have audited the accompanying consolidated financial statements of the Town of View Royal which comprise the consolidated statement of financial position as at December 31, 2011, the consolidated statements of operations, change in net financial assets and cash flows for the year then ended, and notes, comprising a summary of significant accounting policies and other explanatory information.
Management's Responsibility for the Consolidated Financial Statements Management is responsible for the preparation and fair presentation of these consolidated financial statements in accordance with Canadian public sector accounting standards, and for such internal control as management determines is necessary to enable the preparation of consolidated financial statements that are free from material misstatement, whether due to fraud or error.
Auditors' Responsibility Our responsibility is to express an opinion on these consolidated financial statements based on our audit. We conducted our audit in accordance with Canadian generally accepted auditing standards. Those standards require that we comply with ethical requirements and plan and perform the audit to obtain reasonable assurance about whether the consolidated financial statements are free from material misstatement.
An audit involves performing procedures to obtain audit evidence about the amounts and disclosures in the consolidated financial statements. The procedures selected depend on our judgment, including the assessment of the risks of material misstatement of the consolidated financial statements, whether due to fraud or error. In making those risk assessments, we consider internal control relevant to the entity's preparation and fair presentation of the consolidated financial statements in order to design audit procedures that are appropriate in the circumstances, but not for the purpose of expressing an opinion on the effectiveness of the entity's internal control. An audit also includes evaluating the appropriateness of accounting policies used and the reasonableness of accounting estimates made by management, as well as evaluating the overall presentation of the consolidated financial statements.
We believe that the audit evidence we have obtained is sufficient and appropriate to provide a basis for our audit opinion.
Opinion In our opinion, the consolidated financial statements present fairly, in all material respects, the consolidated financial position of the Town of View Royal as at December 31, 2011, and its consolidated results of operations, its consolidated changes in net financial assets and its consolidated cash flows for the year then ended in accordance with Canadian public sector accounting standards.
KPMG LLP Chartered Accountants June 19, 2012 Victoria, Canada
TOWN OF VIEW ROYAL
Consolidated Statement of Financial Position December 31, 2011, with comparative information for 2010
| 2011 | 2010 | |
|---|---|---|
| Financial assets: | ||
| Cash and cash equivalents (note 2) | $ 13,399,976 | $ 7,177,574 |
| Taxes receivable | 212,682 | 276,409 |
| Accounts receivable | 1,596,979 | 2,116,246 |
| Government grant receivable (note 3) | 10,860 | 4,460,092 |
| 15,220,497 | 14,030,321 | |
| Financial liabilities: | ||
| Accounts payable and accrued liabilities | 2,440,504 | 2,860,906 |
| Deposits | 1,044,107 | 651,175 |
| Deferred revenue (note 4) | 5,719,145 | 5,336,743 |
| Prepaid property taxes | 229,079 | 173,532 |
| Long-term debt (note 5) | 2,926,343 | 701,482 |
| Employee future benefit obligations (note 6) | 121,656 | 131,200 |
| 12,480,834 | 9,855,038 | |
| Net financial assets | 2,739,663 | 4,175,283 |
| Non-financial assets: | ||
| Tangible capital assets (note 7) | 112,100,944 | 98,380,787 |
| Inventory of supplies | 6,152 | 9,295 |
| Prepaid expenses | 17,472 | 22,250 |
| 112,124,568 | 98,412,332 | |
| Commitments and contingencies (note 10) | ||
| Accumulated surplus (note 8) | $ 114,864,231 | $ 102,587,615 |
TOWN OF VIEW ROYAL
Consolidated Statement of Operations Year ended December 31, 2011, with comparative information for 2010
| Financial plan (unaudited - note 11) | 2011 | 2010 | |
|---|---|---|---|
| Revenue: | |||
| Taxation, net (note 9) | $ 5,320,205 | $ 5,343,432 | $ 5,213,558 |
| User charges | 1,605,958 | 1,626,100 | 1,760,451 |
| Government transfers: | |||
| Provincial | 3,399,269 | 2,897,765 | 2,441,218 |
| Federal | 3,650,560 | 3,686,304 | 4,169,446 |
| Municipal | 8,250 | 9,147 | - |
| Investment income | 85,000 | 157,924 | 152,405 |
| Interest on sinking fund assets | - | 44,384 | 27,523 |
| Penalties and fines | 60,000 | 62,660 | 57,457 |
| Development charges earned | 86,077 | 320,541 | 223,254 |
| Developer contributions | 360,000 | 7,763,280 | 2,100,204 |
| Contributions and donations | - | 596,000 | - |
| Other revenue from own sources | 887,301 | 1,002,965 | 874,643 |
| Total revenue | 15,462,620 | 23,510,502 | 17,020,159 |
| Expenses: | |||
| General government | 1,831,871 | 1,634,846 | 1,774,198 |
| Protective services | 2,769,537 | 2,601,943 | 2,679,337 |
| Transportation services | 2,997,904 | 2,923,362 | 2,643,494 |
| Environmental health services | 1,227,116 | 1,194,371 | 1,201,768 |
| Planning and development | 454,383 | 391,867 | 425,664 |
| Recreation and cultural | 2,383,077 | 2,487,497 | 2,210,096 |
| Total expenses | 11,663,888 | 11,233,886 | 10,934,557 |
| Annual surplus | 3,798,732 | 12,276,616 | 6,085,602 |
| Accumulated surplus, beginning of year | 102,587,615 | 102,587,615 | 96,502,013 |
| Accumulated surplus, end of year | $ 106,386,347 | $ 114,864,231 | $ 102,587,615 |
TOWN OF VIEW ROYAL
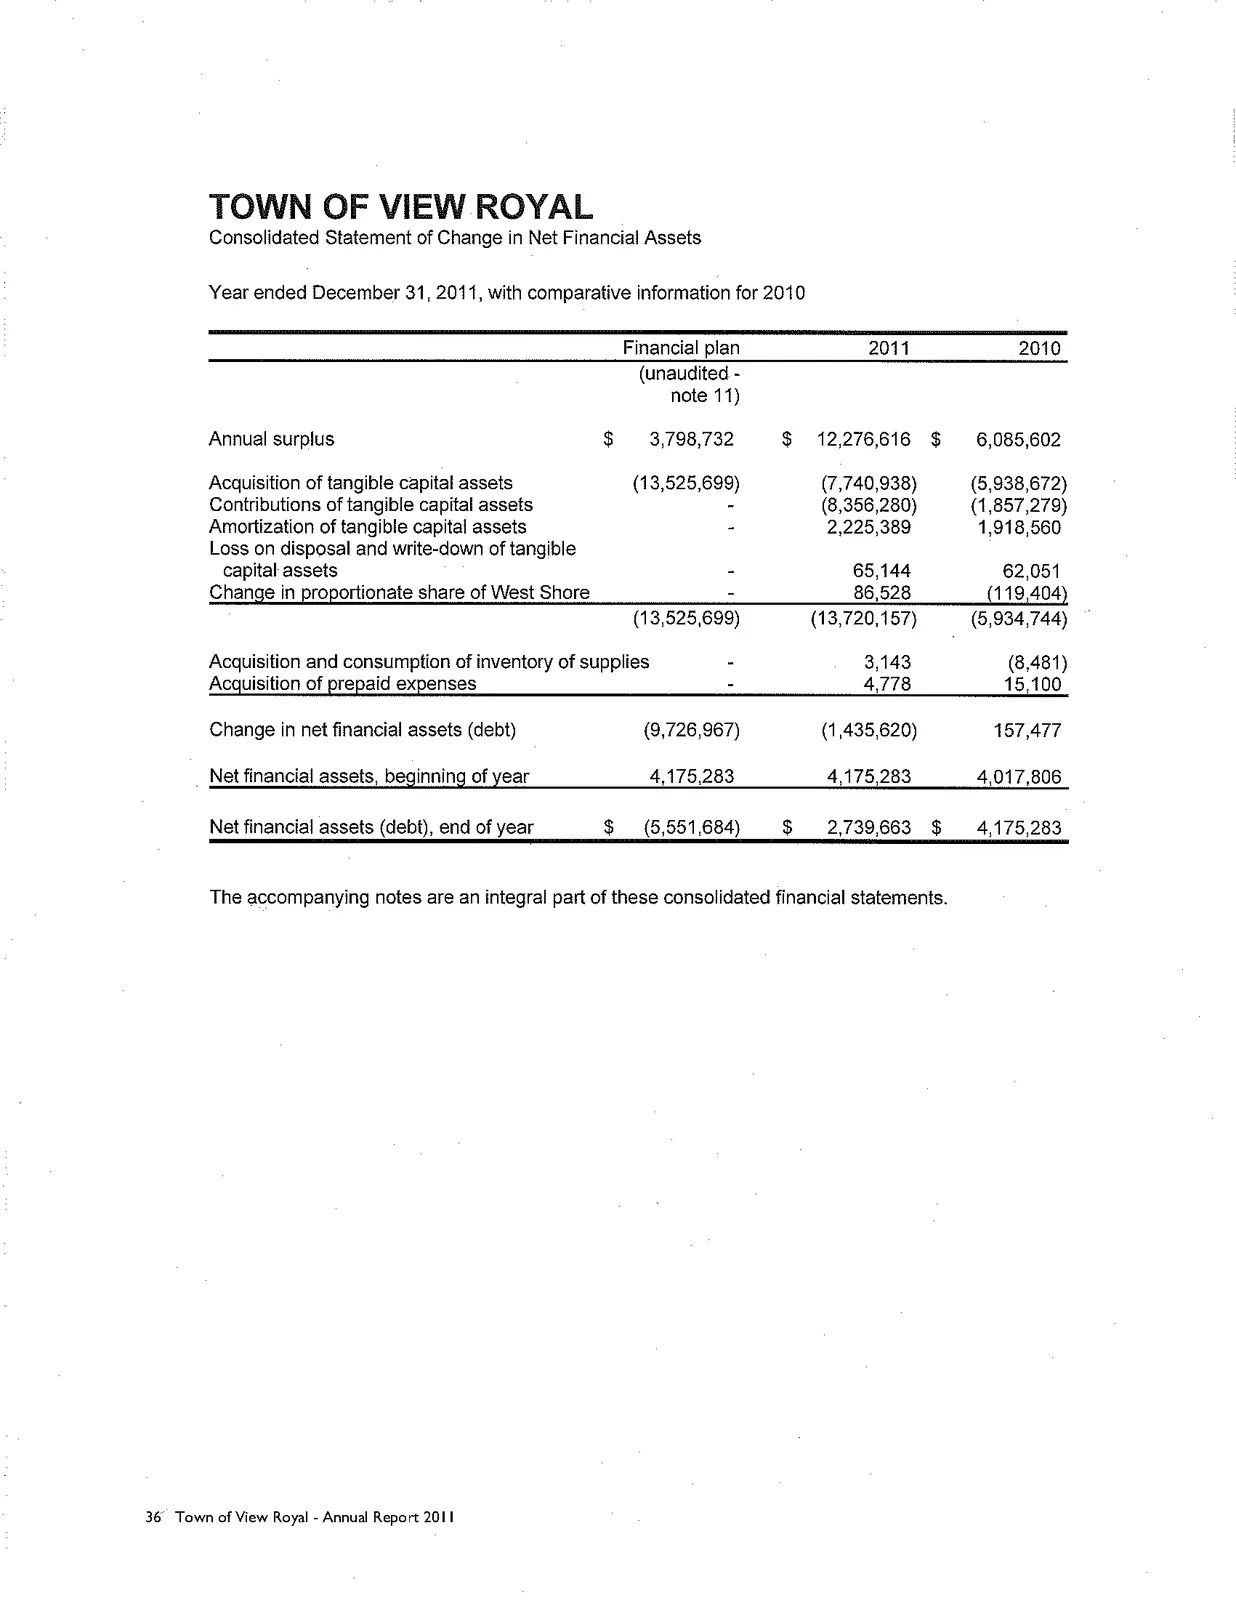
Consolidated Statement of Change in Net Financial Assets Year ended December 31, 2011, with comparative information for 2010
| Financial plan (unaudited - note 11) | 2011 | 2010 | |
|---|---|---|---|
| Annual surplus | $ 3,798,732 | $ 12,276,616 | $ 6,085,602 |
| Acquisition of tangible capital assets | (13,525,699) | (7,740,938) | (5,938,672) |
| Contributions of tangible capital assets | - | (8,356,280) | (1,857,279) |
| Amortization of tangible capital assets | - | 2,225,389 | 1,918,560 |
| Loss on disposal and write-down of tangible capital assets | - | 65,144 | 62,051 |
| Change in proportionate share of West Shore | - | 86,528 | (119,404) |
| (13,525,699) | (13,720,157) | (5,934,744) | |
| Acquisition and consumption of inventory of supplies | - | 3,143 | (8,481) |
| Acquisition of prepaid expenses | - | 4,778 | 15,100 |
| Change in net financial assets (debt) | (9,726,967) | (1,435,620) | 157,477 |
| Net financial assets, beginning of year | 4,175,283 | 4,175,283 | 4,017,806 |
| Net financial assets (debt), end of year | $ (5,551,684) | $ 2,739,663 | $ 4,175,283 |
TOWN OF VIEW ROYAL
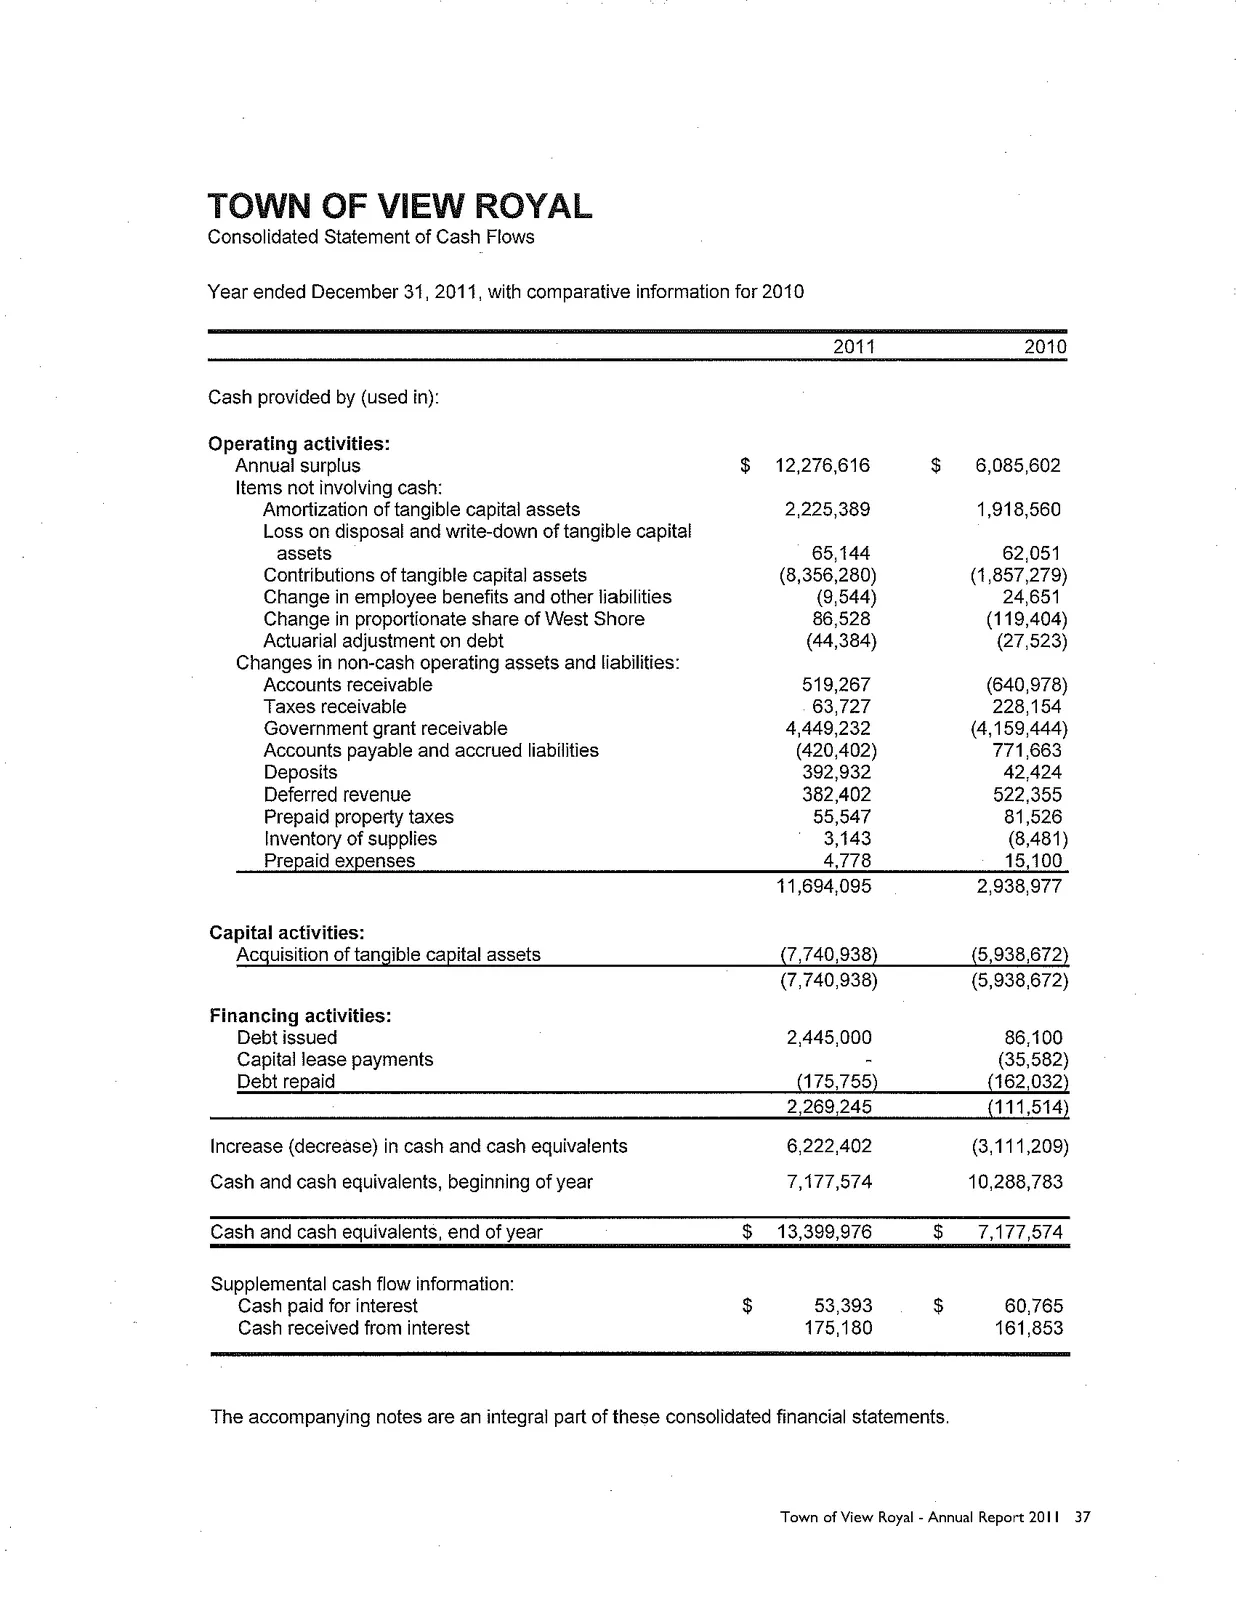
Consolidated Statement of Cash Flows Year ended December 31, 2011, with comparative information for 2010
| 2011 | 2010 | |
|---|---|---|
| Operating activities: | ||
| Annual surplus | $ 12,276,616 | $ 6,085,602 |
| Items not involving cash: | ||
| Amortization of tangible capital assets | 2,225,389 | 1,918,560 |
| Loss on disposal and write-down of tangible capital assets | 65,144 | 62,051 |
| Contributions of tangible capital assets | (8,356,280) | (1,857,279) |
| Change in employee benefits and other liabilities | (9,544) | 24,651 |
| Change in proportionate share of West Shore | 86,528 | (119,404) |
| Actuarial adjustment on debt | (44,384) | (27,523) |
| Changes in non-cash operating assets and liabilities: | ||
| Accounts receivable | 519,267 | (640,978) |
| Taxes receivable | 63,727 | 228,154 |
| Government grant receivable | 4,449,232 | (4,159,444) |
| Accounts payable and accrued liabilities | (420,402) | 771,663 |
| Deposits | 392,932 | 42,424 |
| Deferred revenue | 382,402 | 522,355 |
| Prepaid property taxes | 55,547 | 81,526 |
| Inventory of supplies | 3,143 | (8,481) |
| Prepaid expenses | 4,778 | 15,100 |
| 11,694,095 | 2,938,977 | |
| Capital activities: | ||
| Acquisition of tangible capital assets | (7,740,938) | (5,938,672) |
| (7,740,938) | (5,938,672) | |
| Financing activities: | ||
| Debt issued | 2,445,000 | 86,100 |
| Capital lease payments | - | (35,582) |
| Debt repaid | (175,755) | (162,032) |
| 2,269,245 | (111,514) | |
| Increase (decrease) in cash and cash equivalents | 6,222,402 | (3,111,209) |
| Cash and cash equivalents, beginning of year | 7,177,574 | 10,288,783 |
| Cash and cash equivalents, end of year | $ 13,399,976 | $ 7,177,574 |
| Supplemental cash flow information: | ||
| Cash paid for interest | $ 53,393 | $ 60,765 |
| Cash received from interest | 175,180 | 161,853 |
TOWN OF VIEW ROYAL
Notes to Consolidated Financial Statements Year ended December 31, 2011
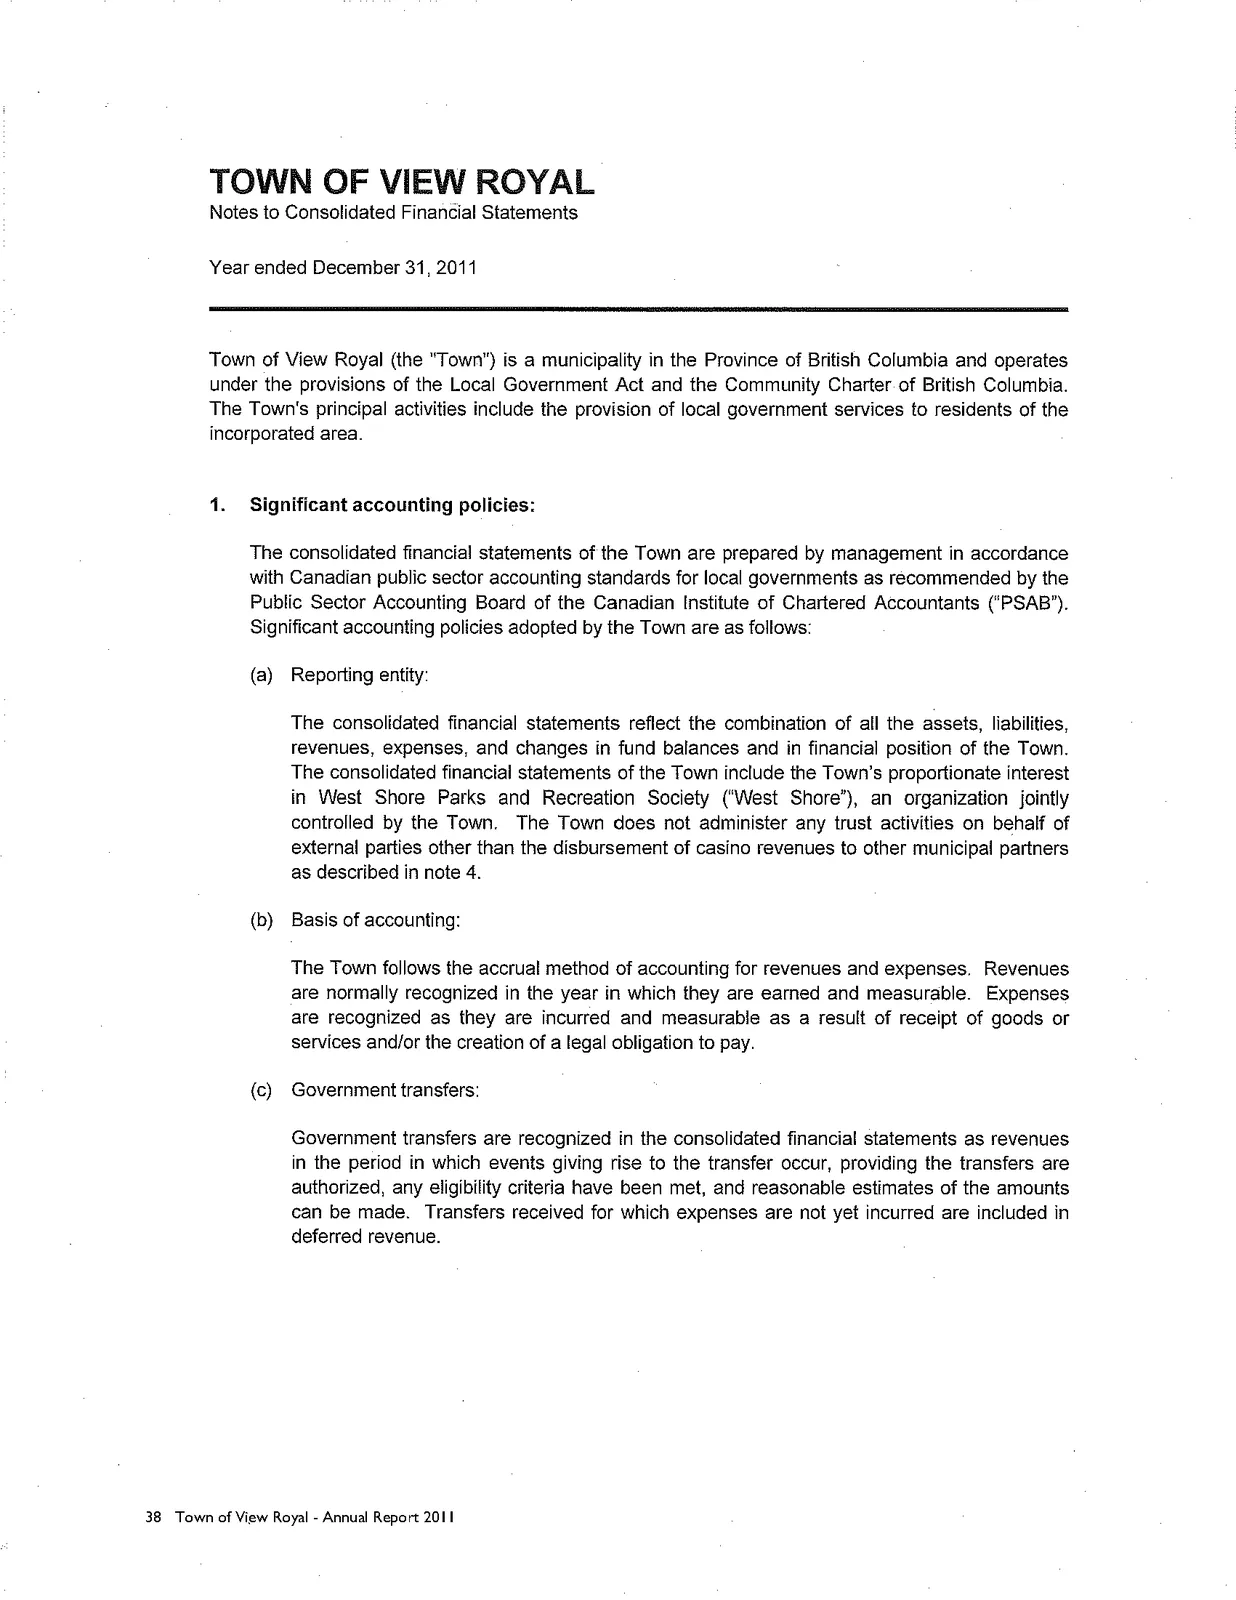
Town of View Royal (the "Town") is a municipality in the Province of British Columbia and operates under the provisions of the Local Government Act and the Community Charter of British Columbia. The Town's principal activities include the provision of local government services to residents of the incorporated area.
1. Significant accounting policies:
The consolidated financial statements of the Town are prepared by management in accordance with Canadian public sector accounting standards for local governments as recommended by the Public Sector Accounting Board of the Canadian Institute of Chartered Accountants ("PSAB"). Significant accounting policies adopted by the Town are as follows:
(a) Reporting entity: The consolidated financial statements reflect the combination of all the assets, liabilities, revenues, expenses, and changes in fund balances and in financial position of the Town. The consolidated financial statements of the Town include the Town's proportionate interest in West Shore Parks and Recreation Society ("West Shore"), an organization jointly controlled by the Town. The Town does not administer any trust activities on behalf of external parties other than the disbursement of casino revenues to other municipal partners as described in note 4.
(b) Basis of accounting: The Town follows the accrual method of accounting for revenues and expenses. Revenues are normally recognized in the year in which they are earned and measurable. Expenses are recognized as they are incurred and measurable as a result of receipt of goods or services and/or the creation of a legal obligation to pay.
(c) Government transfers: Government transfers are recognized in the consolidated financial statements as revenues in the period in which events giving rise to the transfer occur, providing the transfers are authorized, any eligibility criteria have been met, and reasonable estimates of the amounts can be made. Transfers received for which expenses are not yet incurred are included in deferred revenue.
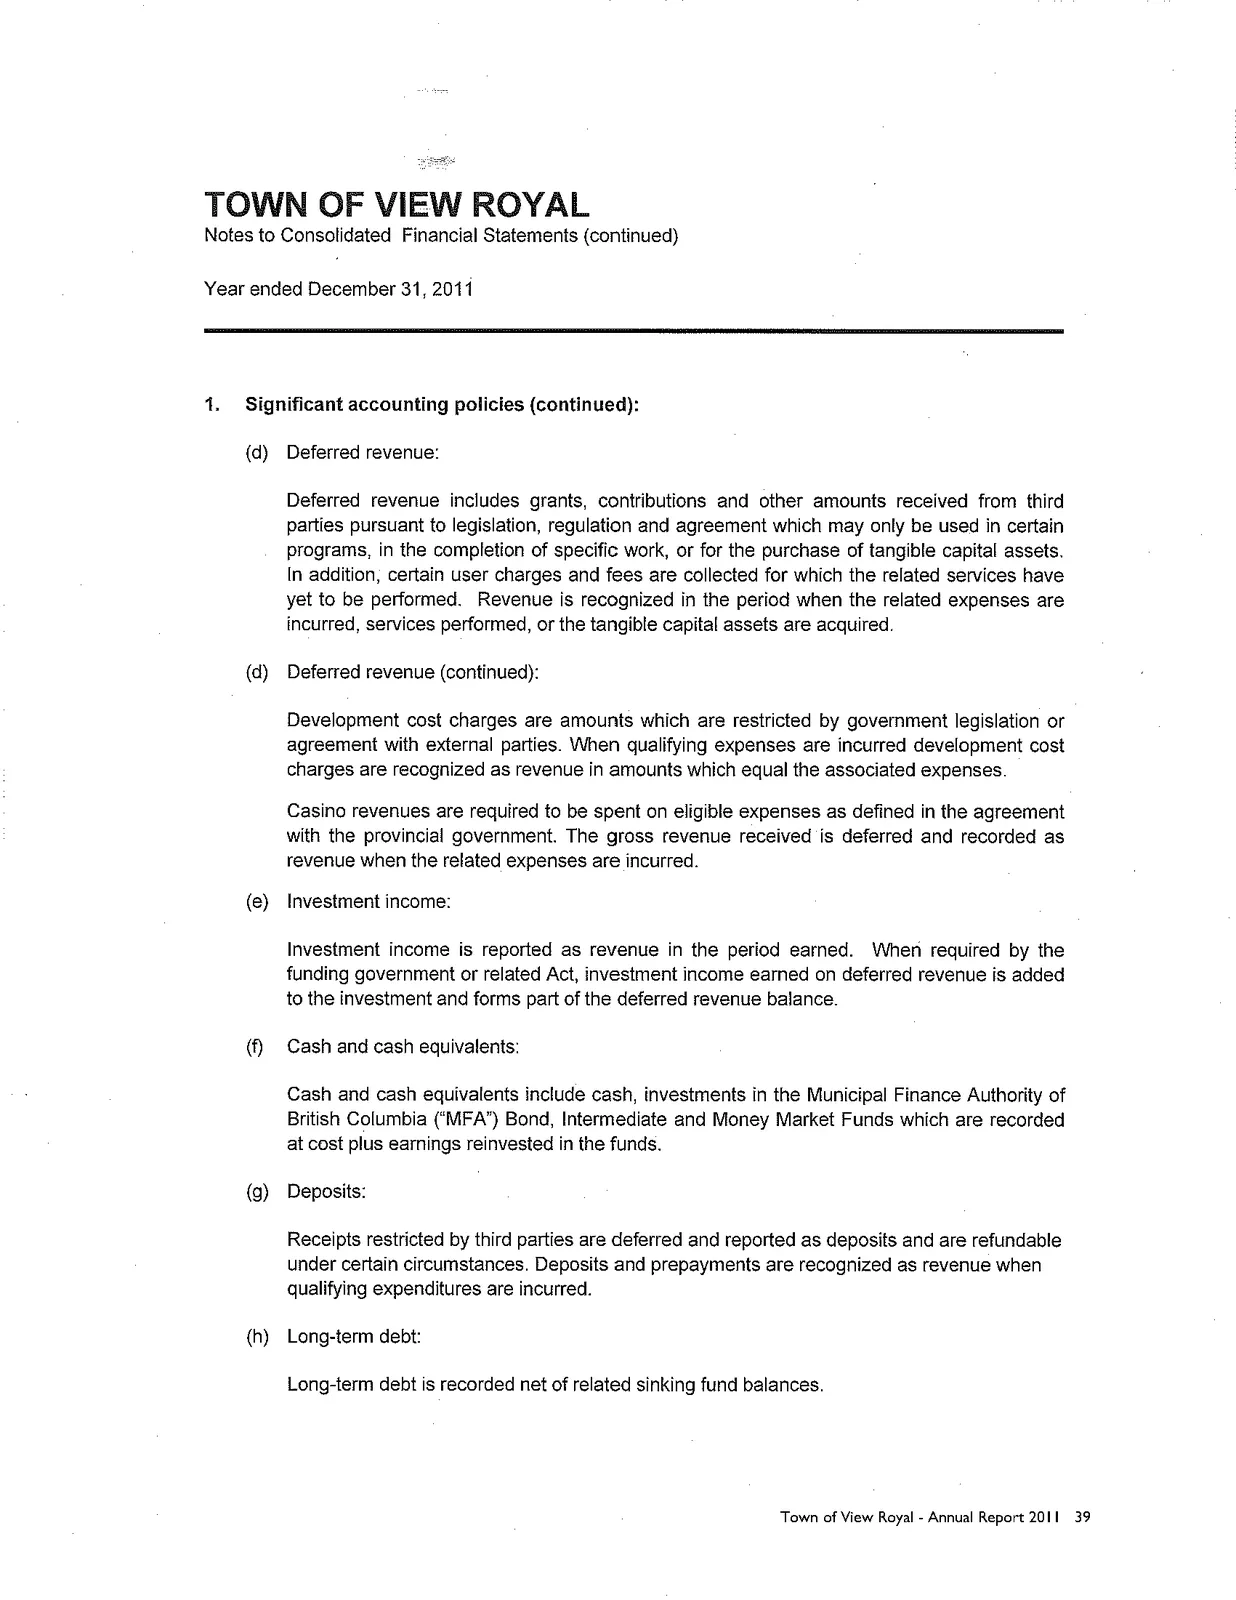
(d) Deferred revenue: Deferred revenue includes grants, contributions and other amounts received from third parties pursuant to legislation, regulation and agreement which may only be used in certain programs, in the completion of specific work, or for the purchase of tangible capital assets. In addition, certain user charges and fees are collected for which the related services have yet to be performed. Revenue is recognized in the period when the related expenses are incurred, services performed, or the tangible capital assets are acquired.
Development cost charges are amounts which are restricted by government legislation or agreement with external parties. When qualifying expenses are incurred development cost charges are recognized as revenue in amounts which equal the associated expenses.
Casino revenues are required to be spent on eligible expenses as defined in the agreement with the provincial government. The gross revenue received is deferred and recorded as revenue when the related expenses are incurred.
(e) Investment income: Investment income is reported as revenue in the period earned. When required by the funding government or related Act, investment income earned on deferred revenue is added to the investment and forms part of the deferred revenue balance.
(f) Cash and cash equivalents: Cash and cash equivalents include cash, investments in the Municipal Finance Authority of British Columbia ("MFA") Bond, Intermediate and Money Market Funds which are recorded at cost plus earnings reinvested in the funds.
(g) Deposits: Receipts restricted by third parties are deferred and reported as deposits and are refundable under certain circumstances. Deposits and prepayments are recognized as revenue when qualifying expenditures are incurred.
(h) Long-term debt: Long-term debt is recorded net of related sinking fund balances.
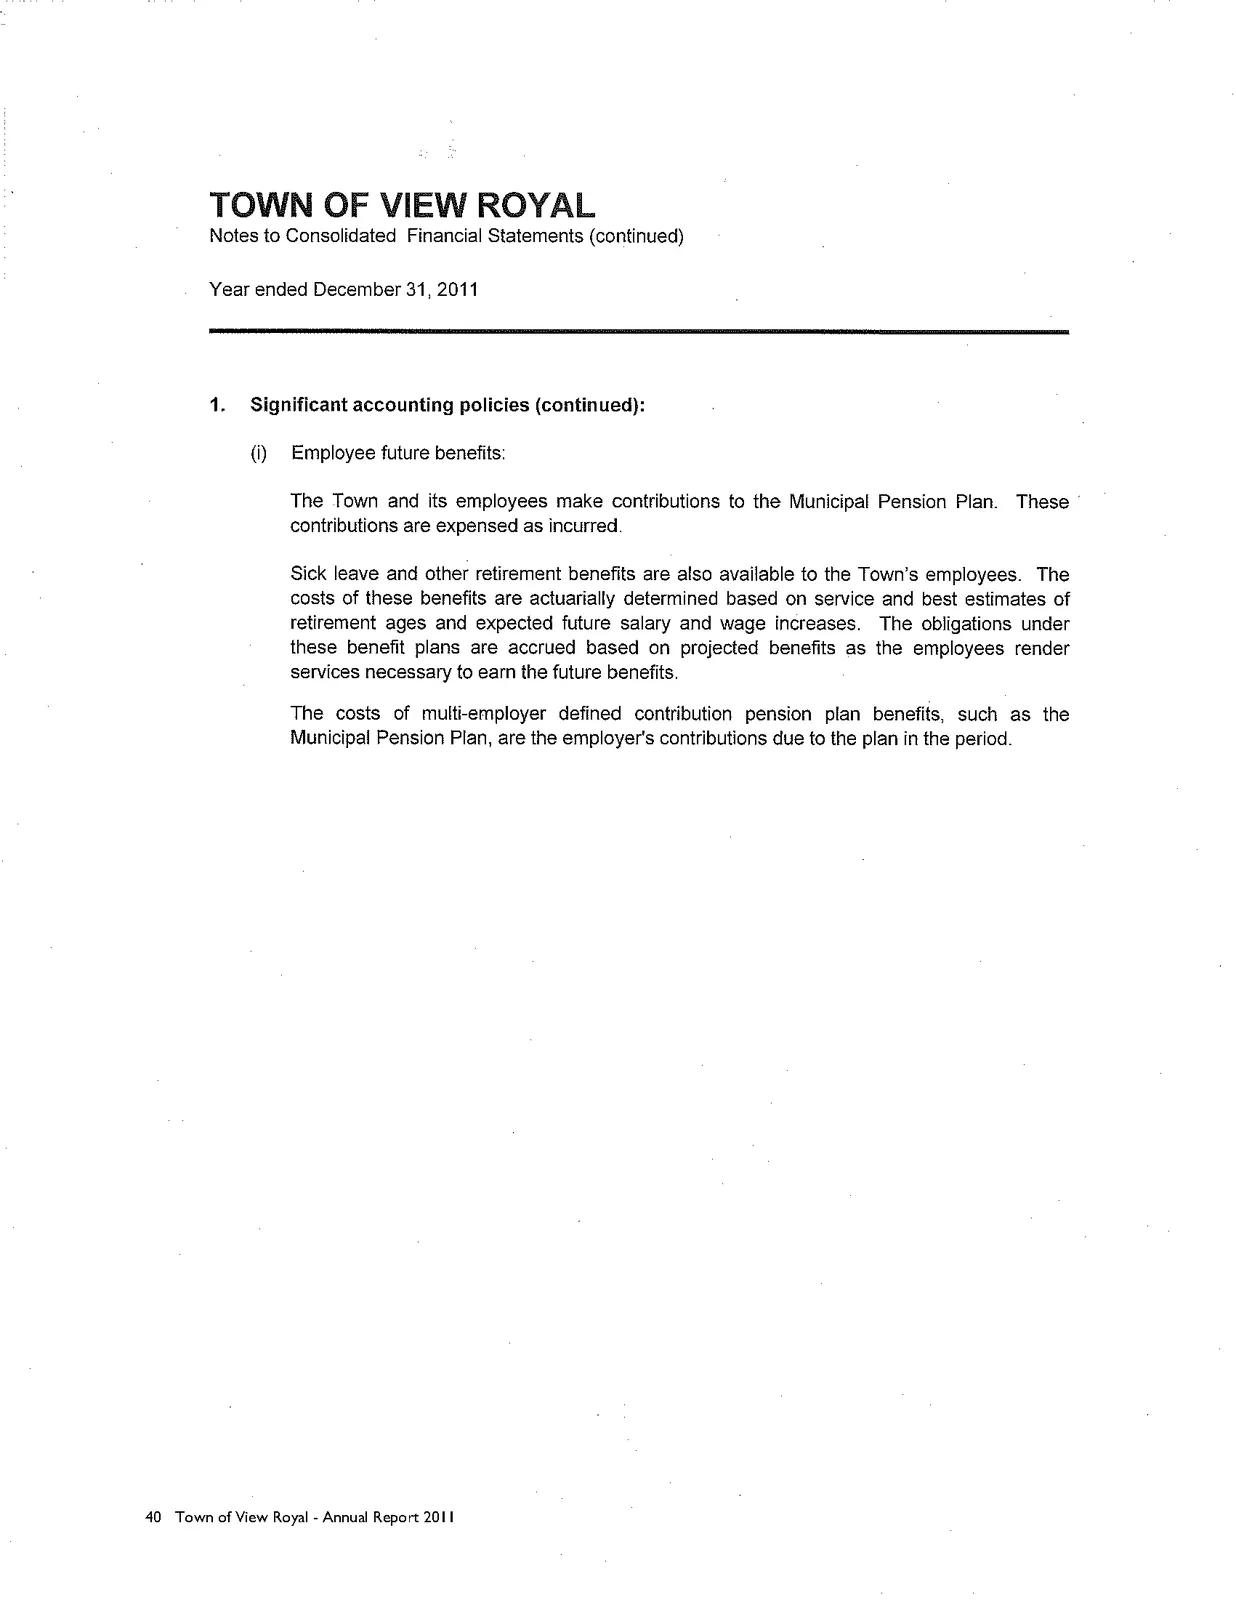
(i) Employee future benefits: The Town and its employees make contributions to the Municipal Pension Plan. These contributions are expensed as incurred.
Sick leave and other retirement benefits are also available to the Town's employees. The costs of these benefits are actuarially determined based on service and best estimates of retirement ages and expected future salary and wage increases. The obligations under these benefit plans are accrued based on projected benefits as the employees render services necessary to earn the future benefits.
The costs of multi-employer defined contribution pension plan benefits, such as the Municipal Pension Plan, are the employer's contributions due to the plan in the period.
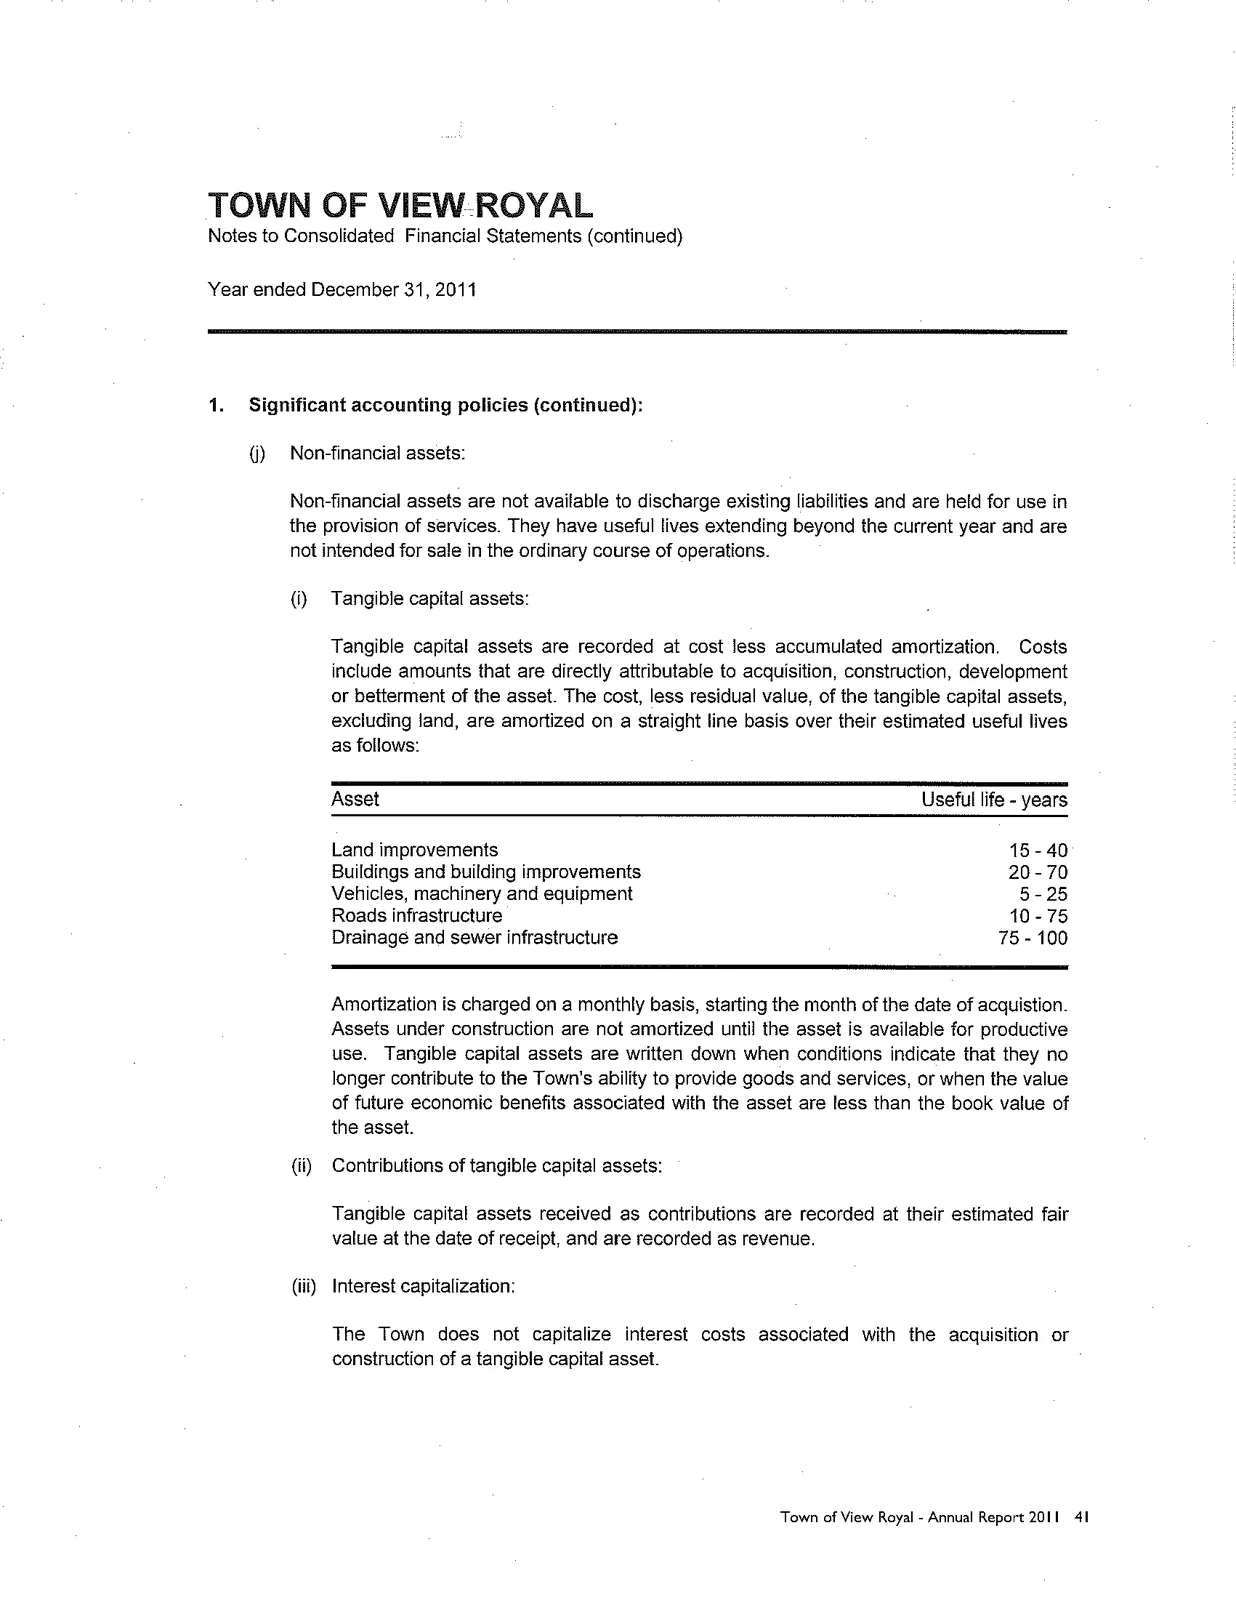
(j) Non-financial assets: Non-financial assets are not available to discharge existing liabilities and are held for use in the provision of services. They have useful lives extending beyond the current year and are not intended for sale in the ordinary course of operations.
(i) Tangible capital assets: Tangible capital assets are recorded at cost less accumulated amortization. Costs include amounts that are directly attributable to acquisition, construction, development or betterment of the asset. The cost, less residual value, of the tangible capital assets, excluding land, are amortized on a straight line basis over their estimated useful lives as follows:
| Asset | Useful life - years |
|---|---|
| Land improvements | 15 - 40 |
| Buildings and building improvements | 20 - 70 |
| Vehicles, machinery and equipment | 5 - 25 |
| Roads infrastructure | 10 - 75 |
| Drainage and sewer infrastructure | 75 - 100 |
Amortization is charged on a monthly basis, starting the month of the date of acquisition. Assets under construction are not amortized until the asset is available for productive use. Tangible capital assets are written down when conditions indicate that they no longer contribute to the Town's ability to provide goods and services, or when the value of future economic benefits associated with the asset are less than the book value of the asset.
(ii) Contributions of tangible capital assets: Tangible capital assets received as contributions are recorded at their estimated fair value at the date of receipt, and are recorded as revenue.
(iii) Interest capitalization: The Town does not capitalize interest costs associated with the acquisition or construction of a tangible capital asset.
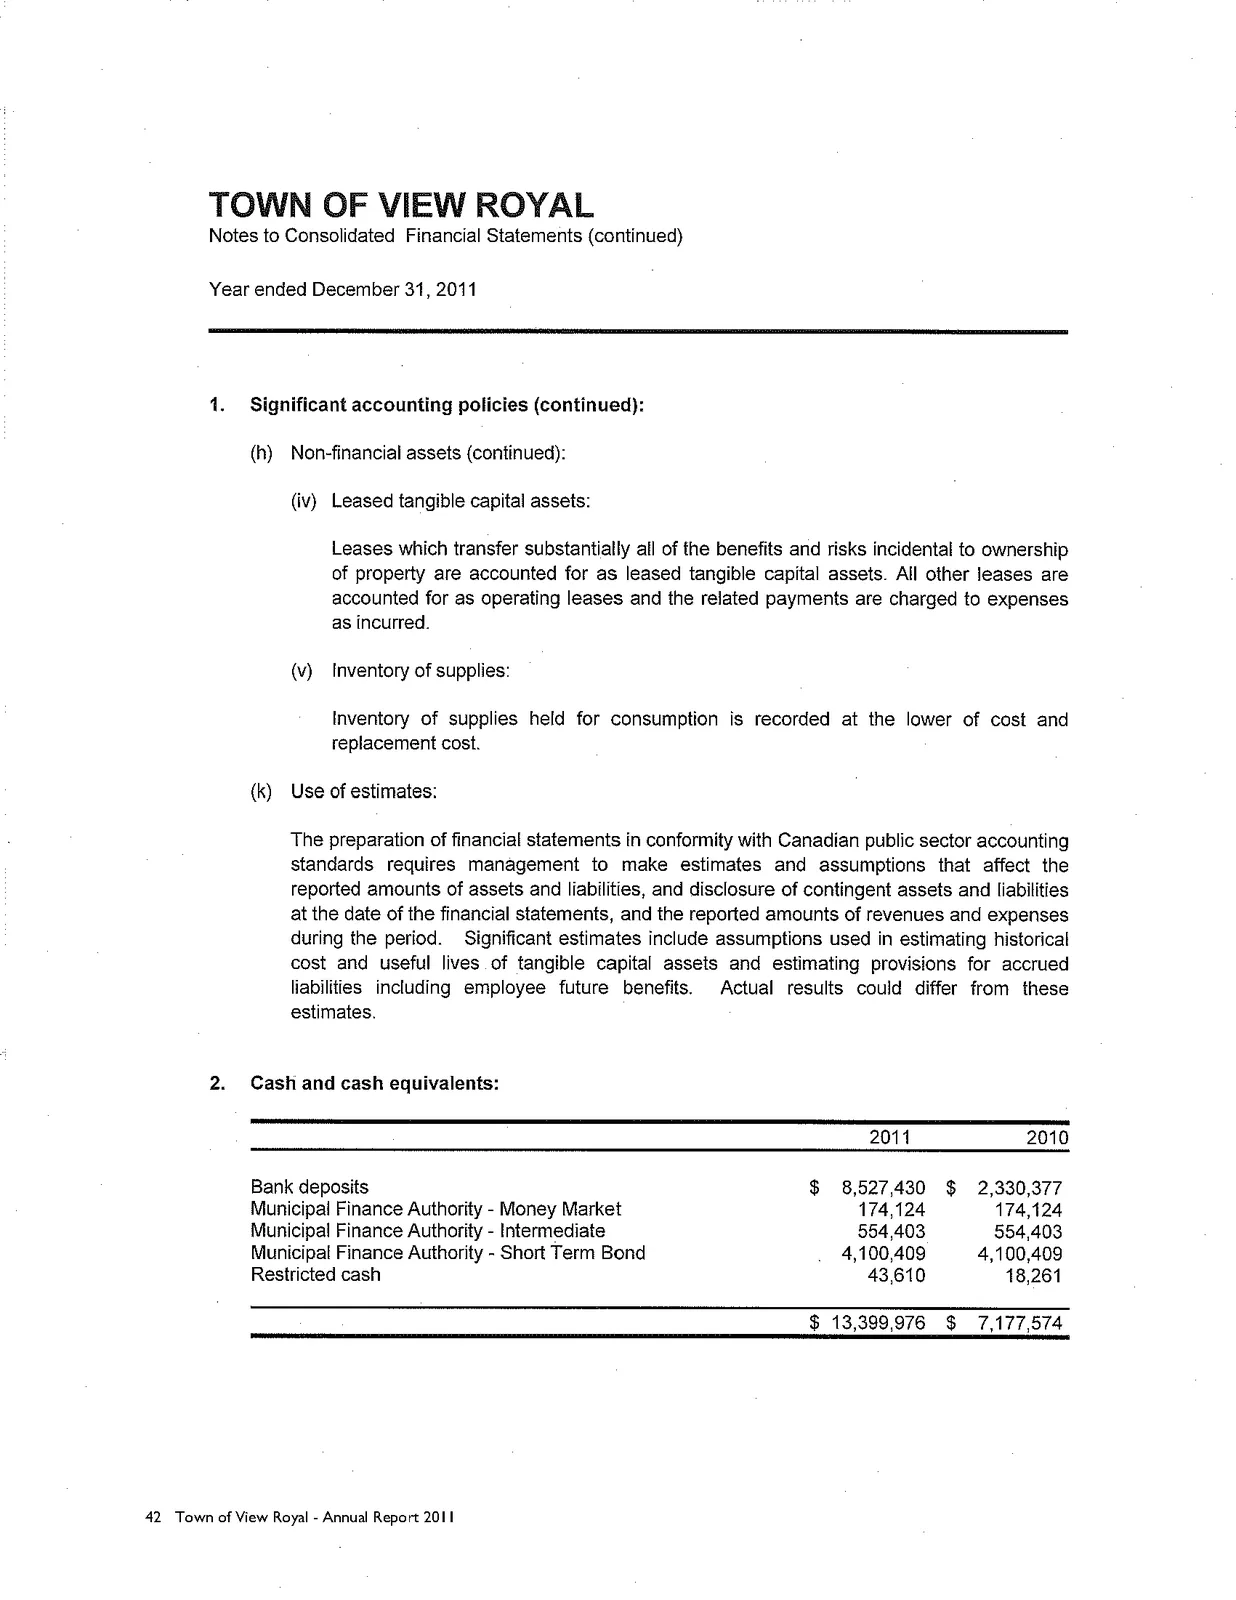
(iv) Leased tangible capital assets: Leases which transfer substantially all of the benefits and risks incidental to ownership of property are accounted for as leased tangible capital assets. All other leases are accounted for as operating leases and the related payments are charged to expenses as incurred.
(v) Inventory of supplies: Inventory of supplies held for consumption is recorded at the lower of cost and replacement cost.
(k) Use of estimates: The preparation of financial statements in conformity with Canadian public sector accounting standards requires management to make estimates and assumptions that affect the reported amounts of assets and liabilities, and disclosure of contingent assets and liabilities at the date of the financial statements, and the reported amounts of revenues and expenses during the period. Significant estimates include assumptions used in estimating historical cost and useful lives of tangible capital assets and estimating provisions for accrued liabilities including employee future benefits. Actual results could differ from these estimates.
2. Cash and cash equivalents:
| 2011 | 2010 | |
|---|---|---|
| Bank deposits | $ 8,527,430 | $ 2,330,377 |
| Municipal Finance Authority - Money Market | 174,124 | 174,124 |
| Municipal Finance Authority - Intermediate | 554,403 | 554,403 |
| Municipal Finance Authority - Short Term Bond | 4,100,409 | 4,100,409 |
| Restricted cash | 43,610 | 18,261 |
| $ 13,399,976 | $ 7,177,574 |
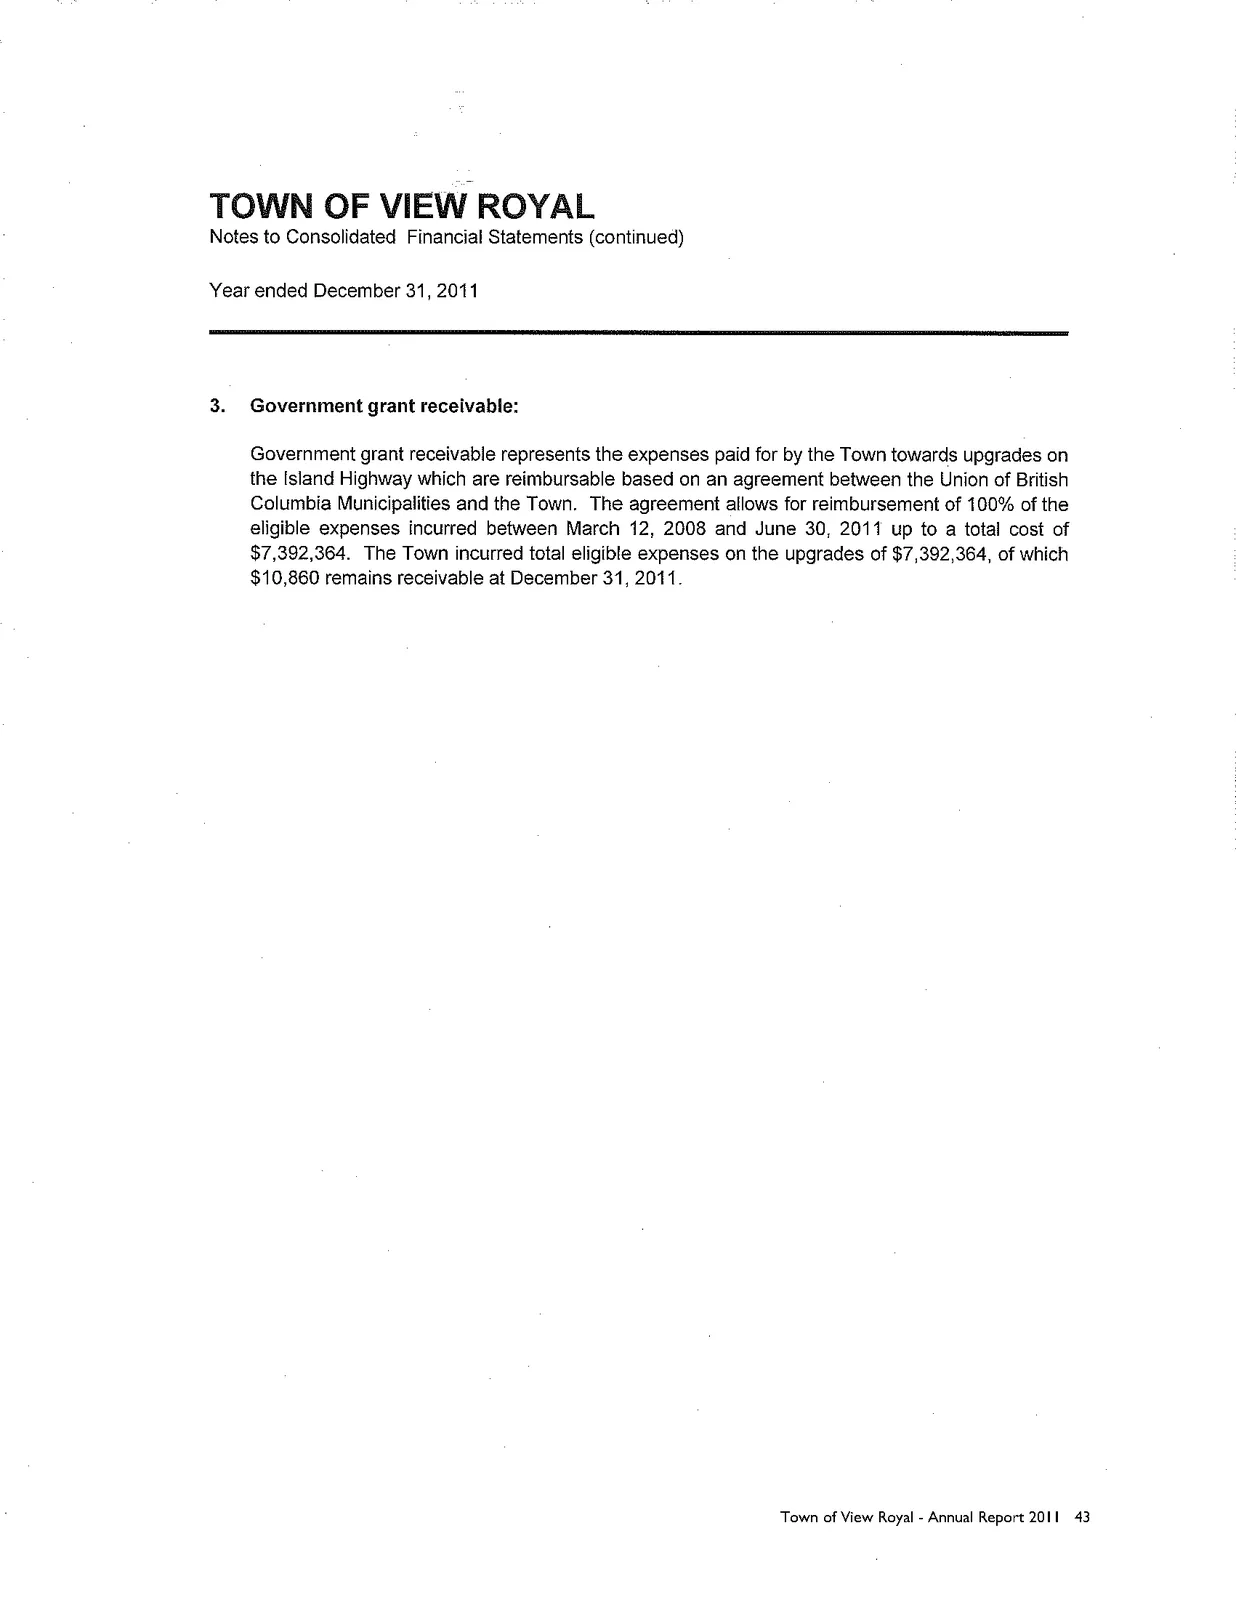
3. Government grant receivable:
Government grant receivable represents the expenses paid for by the Town towards upgrades on the Island Highway which are reimbursable based on an agreement between the Union of British Columbia Municipalities and the Town. The agreement allows for reimbursement of 100% of the eligible expenses incurred between March 12, 2008 and June 30, 2011 up to a total cost of $7,392,364. The Town incurred total eligible expenses on the upgrades of $7,392,364, of which $10,860 remains receivable at December 31, 2011.
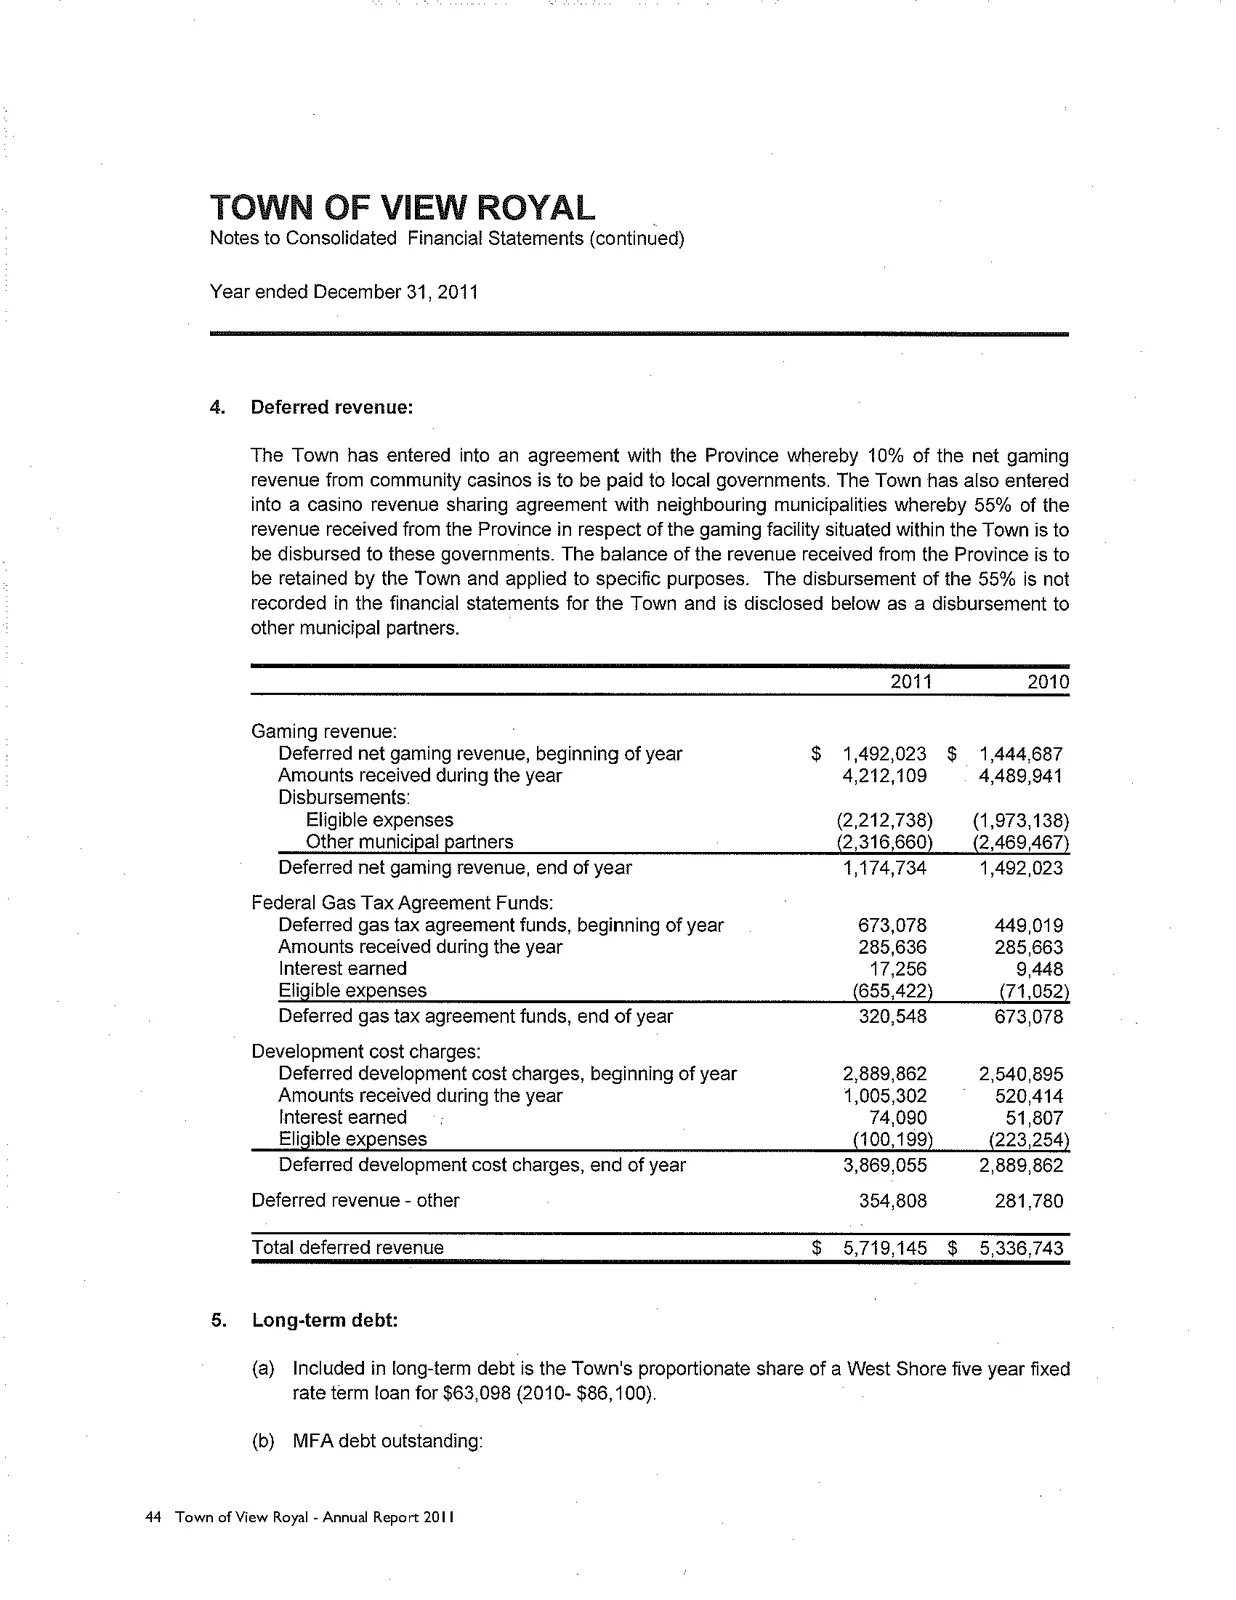
4. Deferred revenue:
The Town has entered into an agreement with the Province whereby 10% of the net gaming revenue from community casinos is to be paid to local governments. The Town has also entered into a casino revenue sharing agreement with neighbouring municipalities whereby 55% of the revenue received from the Province in respect of the gaming facility situated within the Town is to be disbursed to these governments. The balance of the revenue received from the Province is to be retained by the Town and applied to specific purposes. The disbursement of the 55% is not recorded in the financial statements for the Town and is disclosed below as a disbursement to other municipal partners.
| 2011 | 2010 | |
|---|---|---|
| Gaming revenue: | ||
| Deferred net gaming revenue, beginning of year | $ 1,492,023 | $ 1,444,687 |
| Amounts received during the year | 4,212,109 | 4,489,941 |
| Disbursements: | ||
| Eligible expenses | (2,212,738) | (1,973,138) |
| Other municipal partners | (2,316,660) | (2,469,467) |
| Deferred net gaming revenue, end of year | 1,174,734 | 1,492,023 |
| Federal Gas Tax Agreement Funds: | ||
| Deferred gas tax agreement funds, beginning of year | 673,078 | 449,019 |
| Amounts received during the year | 285,636 | 285,663 |
| Interest earned | 17,256 | 9,448 |
| Eligible expenses | (655,422) | (71,052) |
| Deferred gas tax agreement funds, end of year | 320,548 | 673,078 |
| Development cost charges: | ||
| Deferred development cost charges, beginning of year | 2,889,862 | 2,540,895 |
| Amounts received during the year | 1,005,302 | 520,414 |
| Interest earned | 74,090 | 51,807 |
| Eligible expenses | (100,199) | (223,254) |
| Deferred development cost charges, end of year | 3,869,055 | 2,889,862 |
| Deferred revenue - other | 354,808 | 281,780 |
| Total deferred revenue | $ 5,719,145 | $ 5,336,743 |
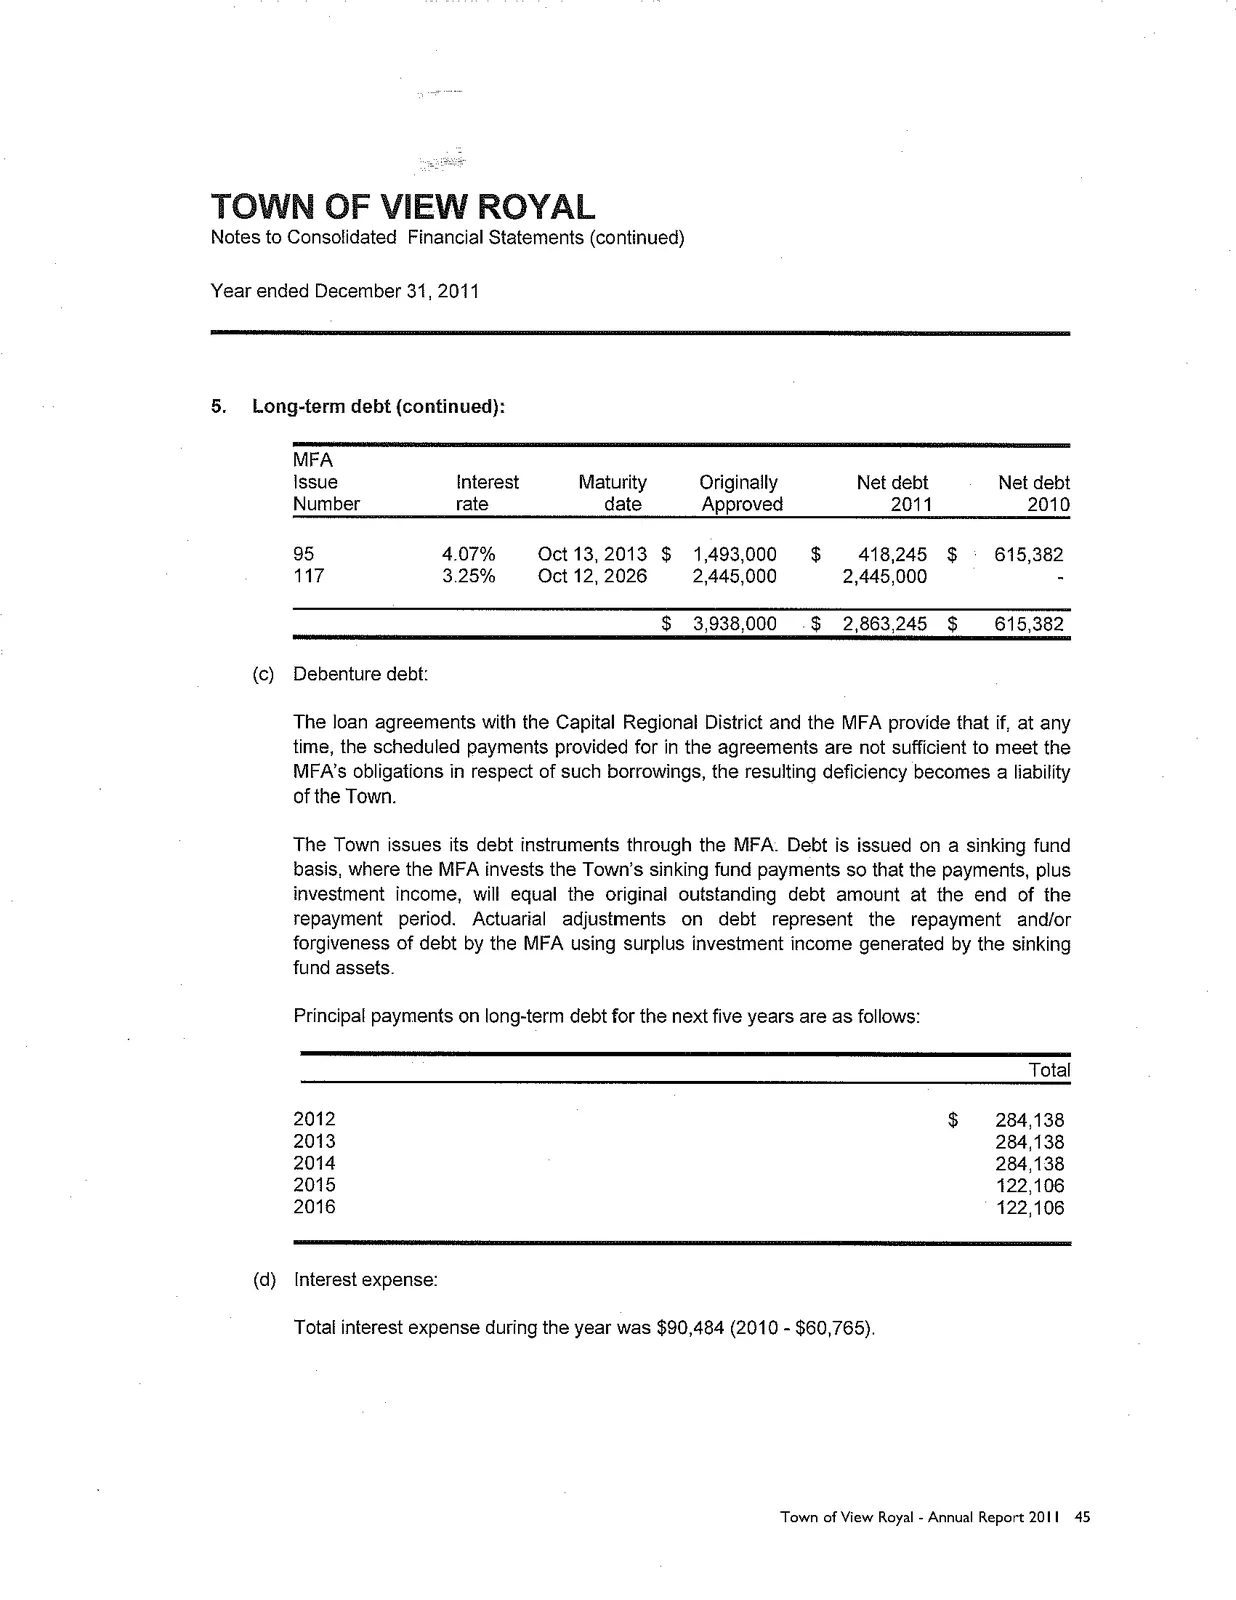
5. Long-term debt:
(a) Included in long-term debt is the Town's proportionate share of a West Shore five year fixed rate term loan for $63,098 (2010- $86,100).
(b) MFA debt outstanding:
| MFA Issue Number | Interest rate | Maturity date | Originally Approved | Net debt 2011 | Net debt 2010 |
|---|---|---|---|---|---|
| 95 | 4.07% | Oct 13, 2013 | $ 1,493,000 | $ 418,245 | $ 615,382 |
| 117 | 3.25% | Oct 12, 2026 | 2,445,000 | 2,445,000 | - |
| $ 3,938,000 | $ 2,863,245 | $ 615,382 |
(c) Debenture debt: The loan agreements with the Capital Regional District and the MFA provide that if, at any time, the scheduled payments provided for in the agreements are not sufficient to meet the MFA's obligations in respect of such borrowings, the resulting deficiency becomes a liability of the Town.
The Town issues its debt instruments through the MFA. Debt is issued on a sinking fund basis, where the MFA invests the Town's sinking fund payments so that the payments, plus investment income, will equal the original outstanding debt amount at the end of the repayment period. Actuarial adjustments on debt represent the repayment and/or forgiveness of debt by the MFA using surplus investment income generated by the sinking fund assets.
Principal payments on long-term debt for the next five years are as follows:
| Year | Total |
|---|---|
| 2012 | $ 284,138 |
| 2013 | 284,138 |
| 2014 | 284,138 |
| 2015 | 122,106 |
| 2016 | 122,106 |
(d) Interest expense: Total interest expense during the year was $90,484 (2010 - $60,765).
6. Employee future benefit obligations:
Employee benefit obligations represent accrued benefits as at December 31, 2011. Accrued sick leave is the estimated liability for sick leave for all employees. Accrued vacation is the amount of unused vacation entitlement carried forward into the next year. Sick leave entitlements can only be used while employed by the Town and are not paid out upon retirement or termination of employment.
Municipal Pension Plan The Town and its employees contribute to the Municipal Pension Plan (the "Plan"), a jointly trusteed pension plan. The Board of Trustees, representing plan members and employers, is responsible for overseeing the management of the Plan, including investment of the assets and administration of benefits. The pension plan is a multi-employer contributory pension plan. Basic pension benefits provided are defined. The plan has about 173,000 active members and approximately 63,000 retired members. Active members include approximately 35,000 contributors from local government.
Every three years an actuarial valuation is performed to assess the financial position of the Plan and the adequacy of Plan funding. The most recent valuation as at December 31, 2009 indicated an unfunded liability of $1,024 million for basic pension benefits. The next valuation will be as at December 31, 2012, with results available in 2013. The actuary does not attribute portions of the unfunded liability to individual employers. The Town paid $146,398 (2010 - $131,500) for employer contributions and Town employees paid $140,262 (2010 - $127,077) for employee contributions to the plan in fiscal 2011.
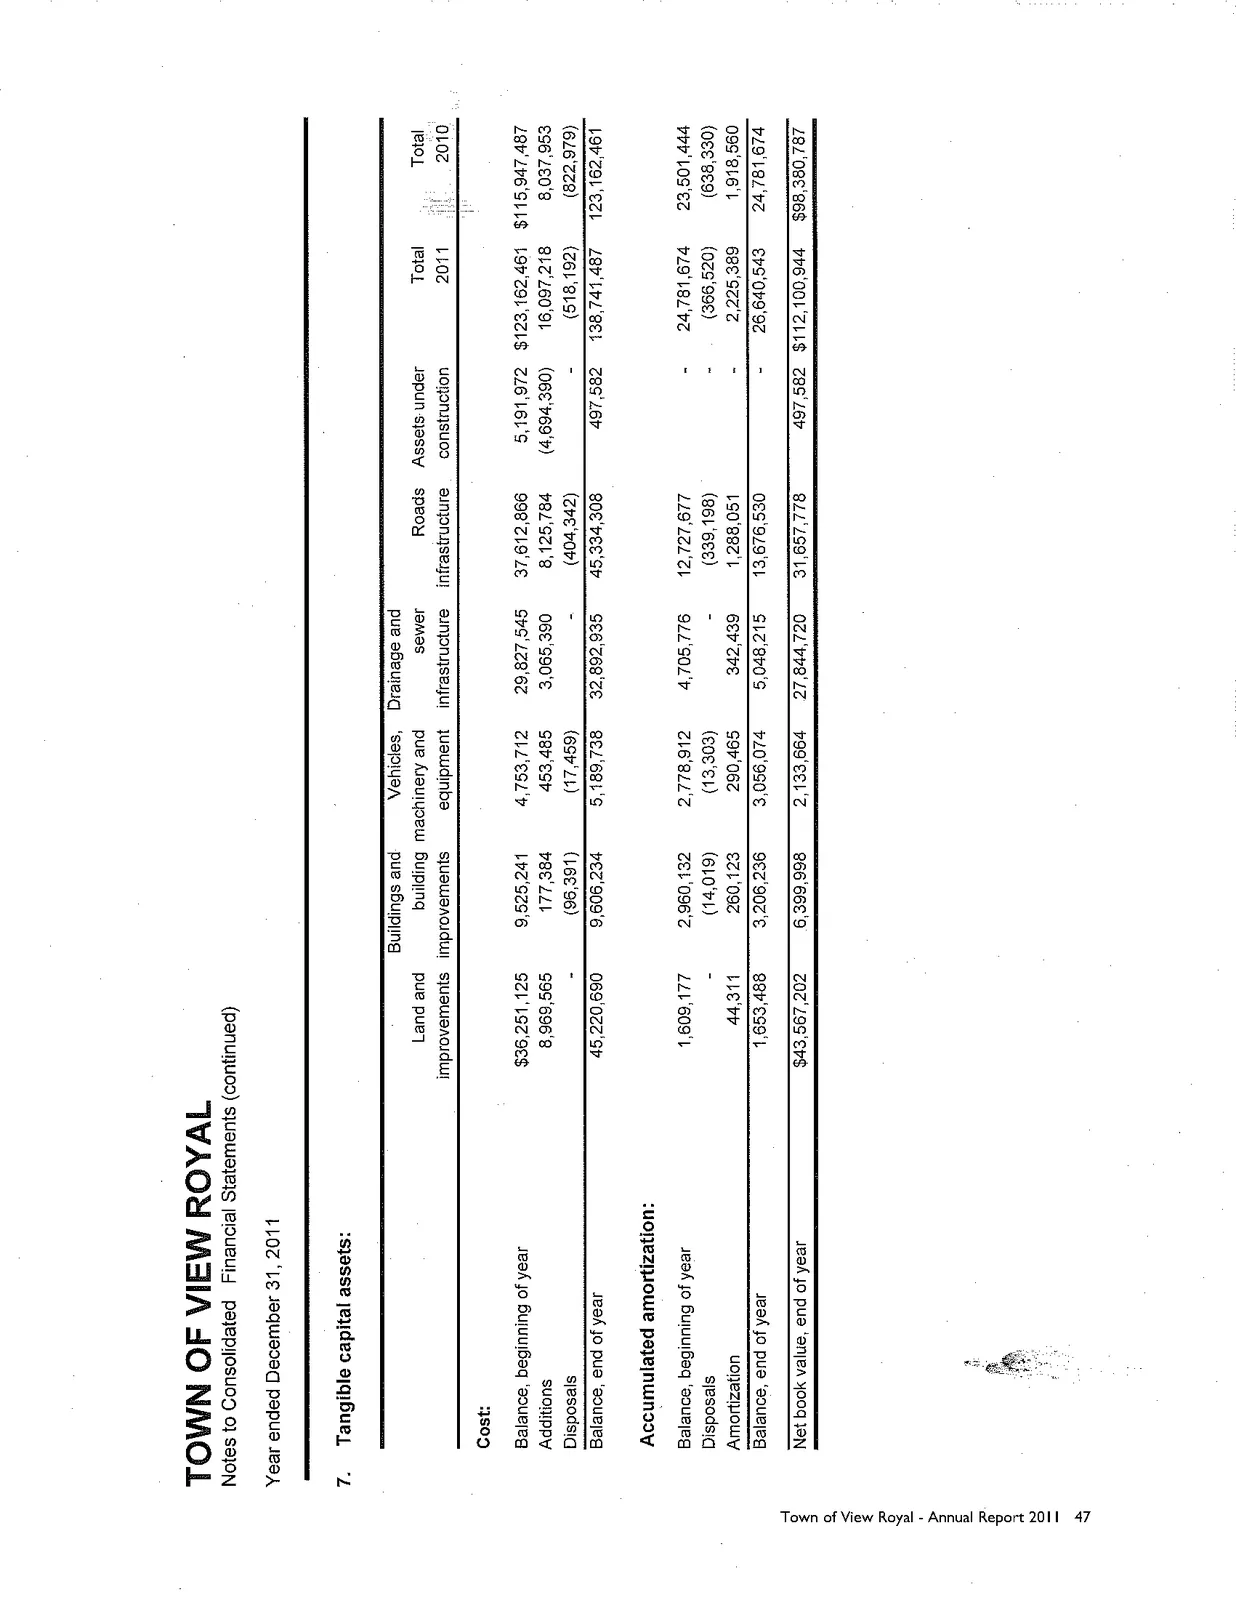
7. Tangible capital assets:
| Cost | Land and improvements | Buildings and building improvements | Vehicles, machinery and equipment | Drainage and sewer infrastructure | Roads infrastructure | Assets under construction | Total 2011 | Total 2010 |
|---|---|---|---|---|---|---|---|---|
| Balance, beginning of year | $36,251,125 | $9,525,241 | $4,753,712 | $29,827,545 | $37,612,866 | $5,191,972 | $123,162,461 | $115,947,487 |
| Additions | 8,969,565 | 177,384 | 453,485 | 3,065,390 | 8,125,784 | (4,694,390) | 16,097,218 | 8,037,953 |
| Disposals | - | (96,391) | (17,459) | - | (404,342) | - | (518,192) | (822,979) |
| Balance, end of year | 45,220,690 | 9,606,234 | 5,189,738 | 32,892,935 | 45,334,308 | 497,582 | 138,741,487 | 123,162,461 |
| Accumulated amortization: | ||||||||
| Balance, beginning of year | 1,609,177 | 2,960,132 | 2,778,912 | 4,705,776 | 12,727,677 | - | 24,781,674 | 23,501,444 |
| Disposals | - | (14,019) | (13,303) | - | (339,198) | - | (366,520) | (638,330) |
| Amortization | 44,311 | 260,123 | 290,465 | 342,439 | 1,288,051 | - | 2,225,389 | 1,918,560 |
| Balance, end of year | 1,653,488 | 3,206,236 | 3,056,074 | 5,048,215 | 13,676,530 | - | 26,640,543 | 24,781,674 |
| Net book value, end of year | $43,567,202 | $6,399,998 | $2,133,664 | $27,844,720 | $31,657,778 | $497,582 | $112,100,944 | $98,380,787 |
(a) Assets under construction: Assets under construction totaling $497,582 (2010 - $5,191,972) have not been amortized. Amortization of these assets will commence when the asset is put into service.
(b) Contributed tangible capital assets: Contributed tangible capital assets have been recognized at estimated fair market value at the date of contribution. The value of contributed capital assets received during the year is $8,356,280 (2010 - $1,857,279) comprised of land $3,284,633 (2010 - $1,353,528), sewer and storm infrastructure $2,659,987 (2010 - $81,800) and roads infrastructure $1,818,660 (2010 - $421,951).
(c) Tangible capital assets disclosed at nominal values: Where an estimate of fair value could not be made, the tangible capital asset has been recognized at a nominal value.
(d) Works of art and historical treasures: The Town manages and controls various works of art and non-operational historical cultural assets including buildings, artifacts, paintings and sculptures located at Town sites and public display areas. These assets are not recorded as tangible capital assets and are not amortized.
(e) Write-down of tangible capital assets: The write-down of tangible capital assets during the year was $nil (2010 - $62,051).
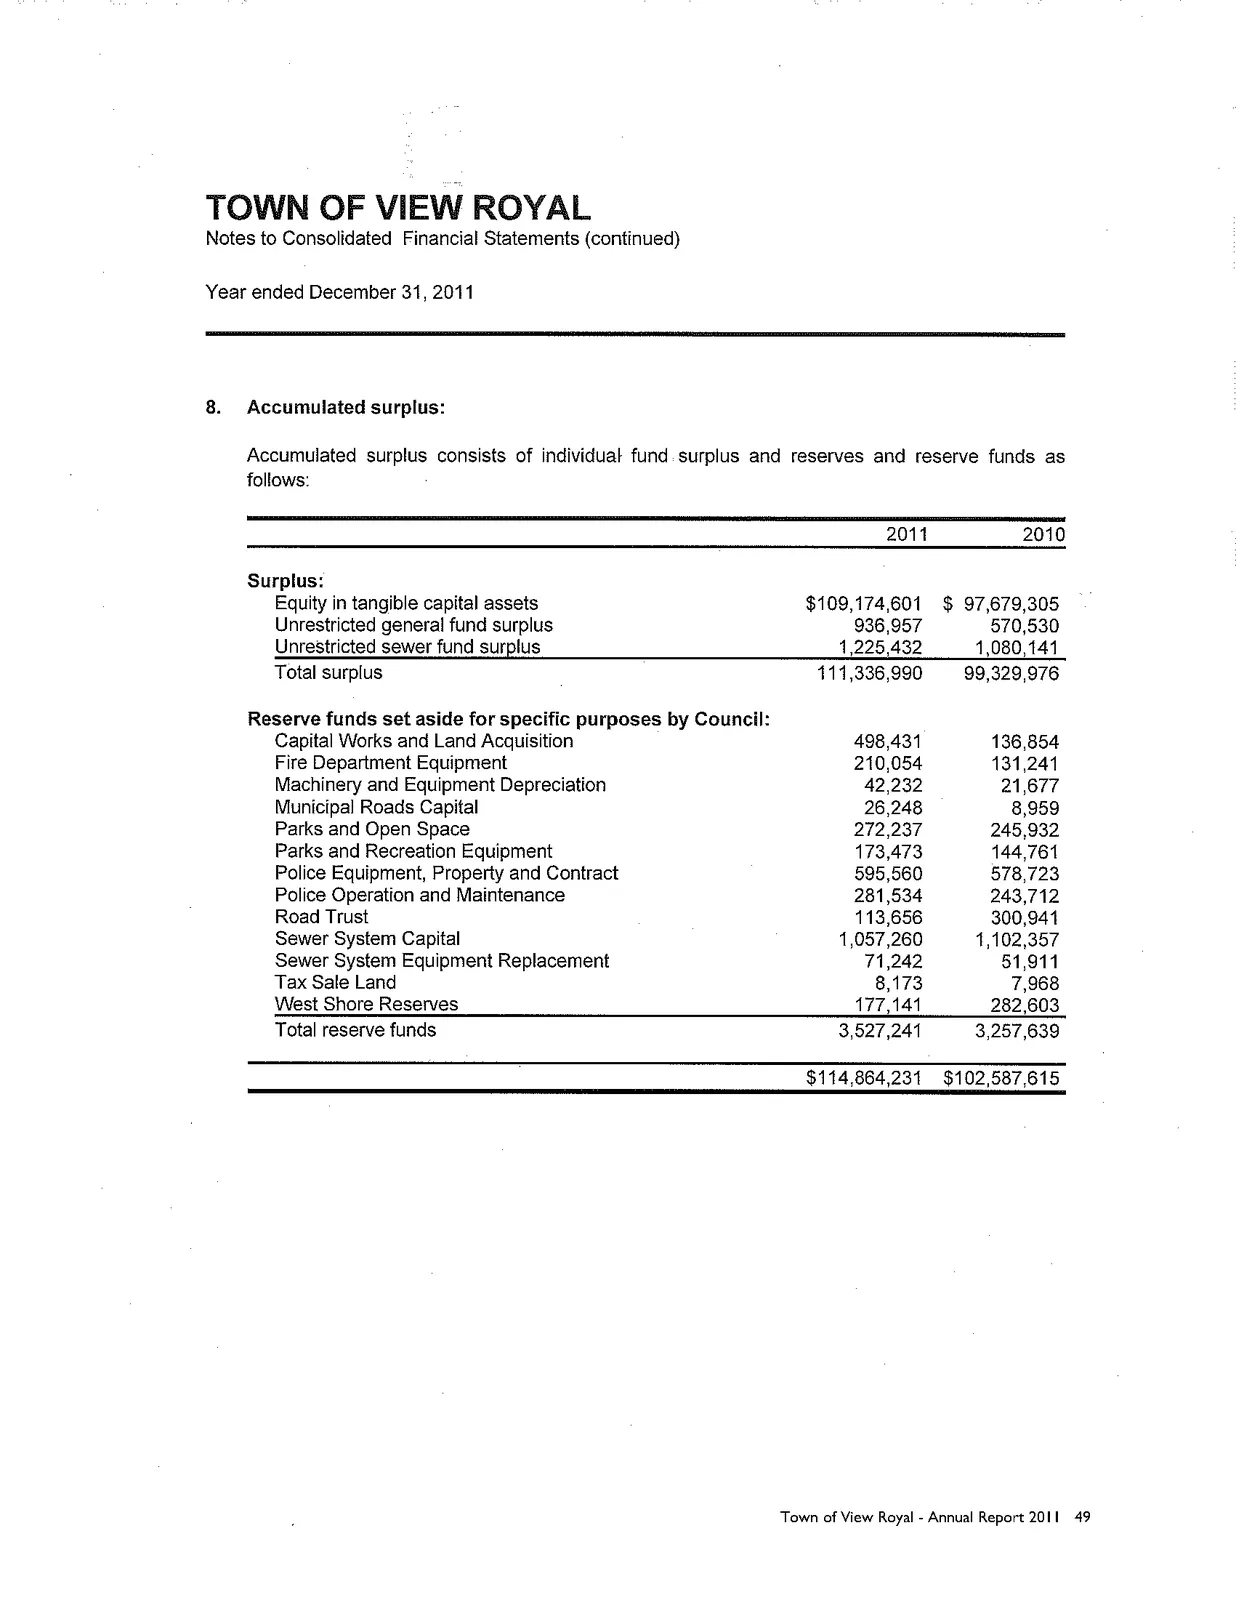
8. Accumulated surplus:
Accumulated surplus consists of individual fund surplus and reserves and reserve funds as follows:
| 2011 | 2010 | |
|---|---|---|
| Surplus: | ||
| Equity in tangible capital assets | $109,174,601 | $ 97,679,305 |
| Unrestricted general fund surplus | 936,957 | 570,530 |
| Unrestricted sewer fund surplus | 1,225,432 | 1,080,141 |
| Total surplus | 111,336,990 | 99,329,976 |
| Reserve funds set aside for specific purposes by Council: | ||
| Capital Works and Land Acquisition | 498,431 | 136,854 |
| Fire Department Equipment | 210,054 | 131,241 |
| Machinery and Equipment Depreciation | 42,232 | 21,677 |
| Municipal Roads Capital | 26,248 | 8,959 |
| Parks and Open Space | 272,237 | 245,932 |
| Parks and Recreation Equipment | 173,473 | 144,761 |
| Police Equipment, Property and Contract | 595,560 | 578,723 |
| Police Operation and Maintenance | 281,534 | 243,712 |
| Road Trust | 113,656 | 300,941 |
| Sewer System Capital | 1,057,260 | 1,102,357 |
| Sewer System Equipment Replacement | 71,242 | 51,911 |
| Tax Sale Land | 8,173 | 7,968 |
| West Shore Reserves | 177,141 | 282,603 |
| Total reserve funds | 3,527,241 | 3,257,639 |
| $114,864,231 | $102,587,615 |
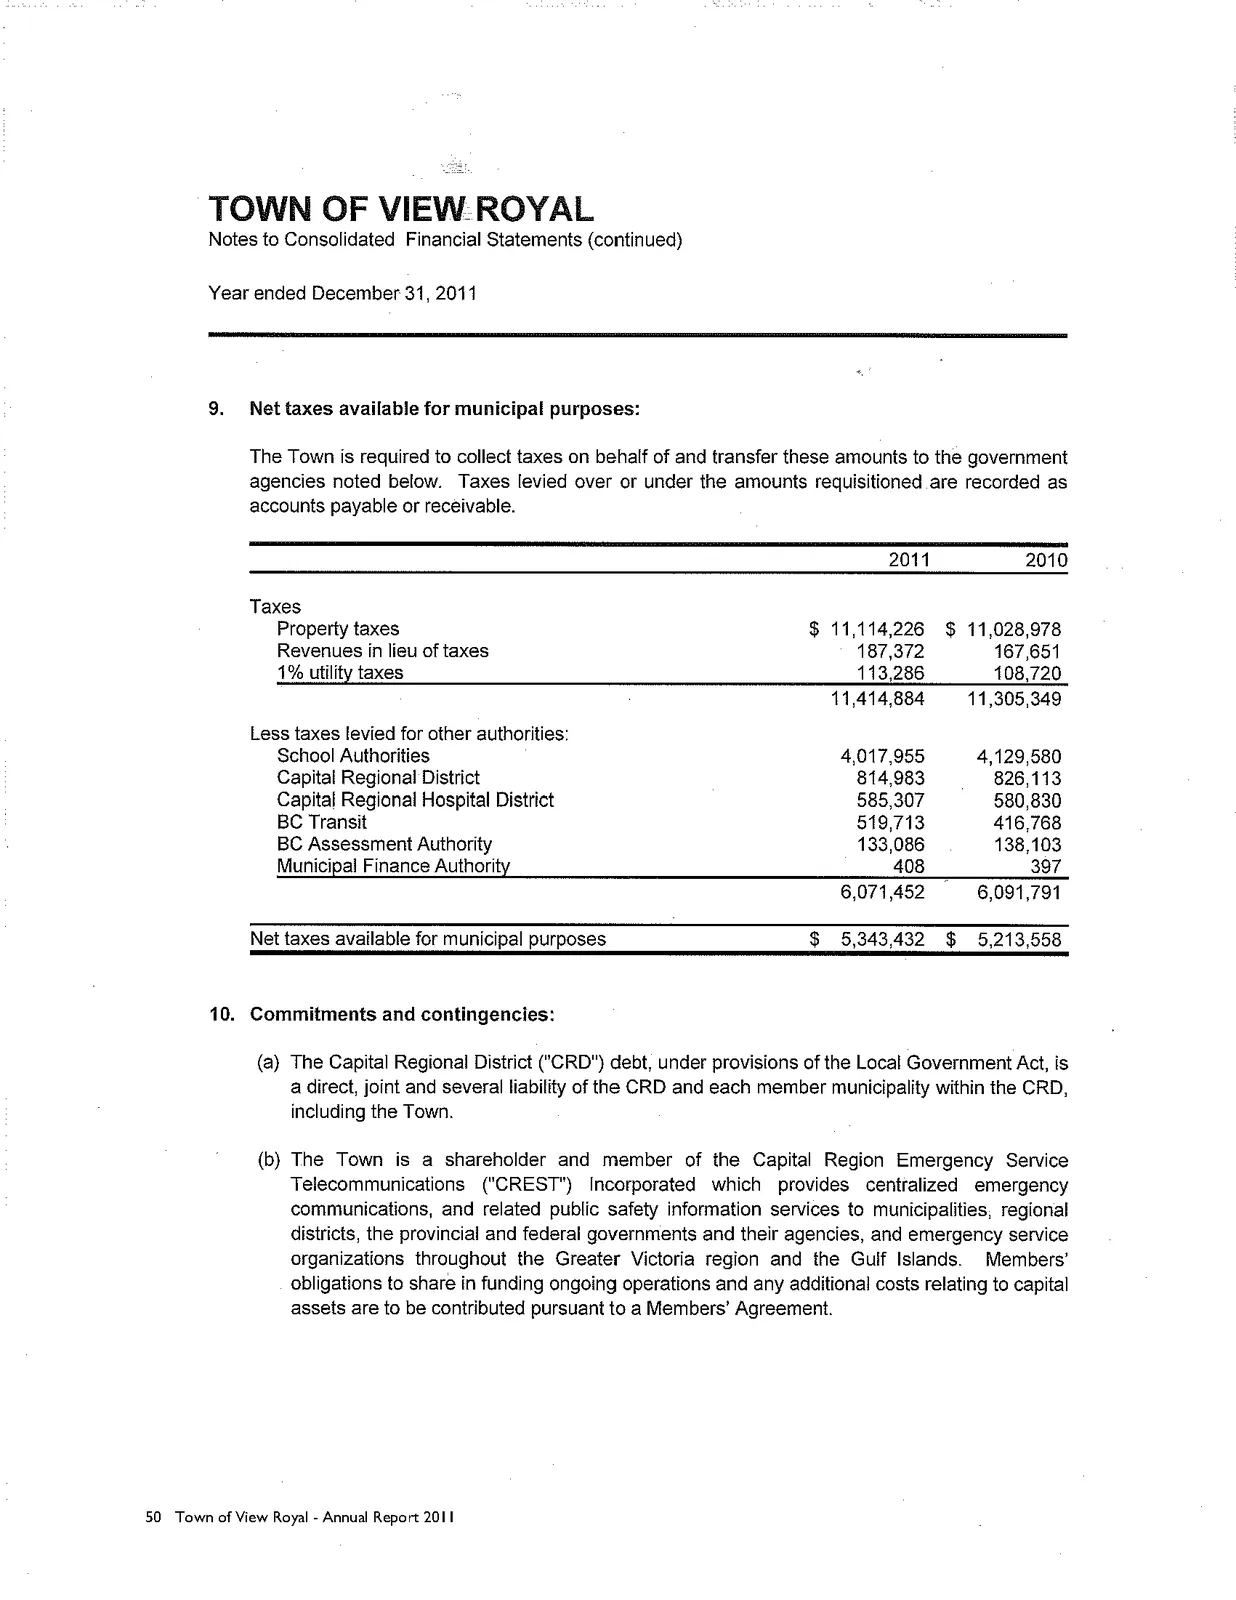
9. Net taxes available for municipal purposes:
The Town is required to collect taxes on behalf of and transfer these amounts to the government agencies noted below. Taxes levied over or under the amounts requisitioned are recorded as accounts payable or receivable.
| 2011 | 2010 | |
|---|---|---|
| Taxes | ||
| Property taxes | $ 11,114,226 | $ 11,028,978 |
| Revenues in lieu of taxes | 187,372 | 167,651 |
| 1% utility taxes | 113,286 | 108,720 |
| 11,414,884 | 11,305,349 | |
| Less taxes levied for other authorities: | ||
| School Authorities | 4,017,955 | 4,129,580 |
| Capital Regional District | 814,983 | 826,113 |
| Capital Regional Hospital District | 585,307 | 580,830 |
| BC Transit | 519,713 | 416,768 |
| BC Assessment Authority | 133,086 | 138,103 |
| Municipal Finance Authority | 408 | 397 |
| 6,071,452 | 6,091,791 | |
| Net taxes available for municipal purposes | $ 5,343,432 | $ 5,213,558 |
10. Commitments and contingencies:
(a) The Capital Regional District ("CRD") debt, under provisions of the Local Government Act, is a direct, joint and several liability of the CRD and each member municipality within the CRD, including the Town.
(b) The Town is a shareholder and member of the Capital Region Emergency Service Telecommunications ("CREST") Incorporated which provides centralized emergency communications, and related public safety information services to municipalities, regional districts, the provincial and federal governments and their agencies, and emergency service organizations throughout the Greater Victoria region and the Gulf Islands. Members' obligations to share in funding ongoing operations and any additional costs relating to capital assets are to be contributed pursuant to a Members' Agreement.
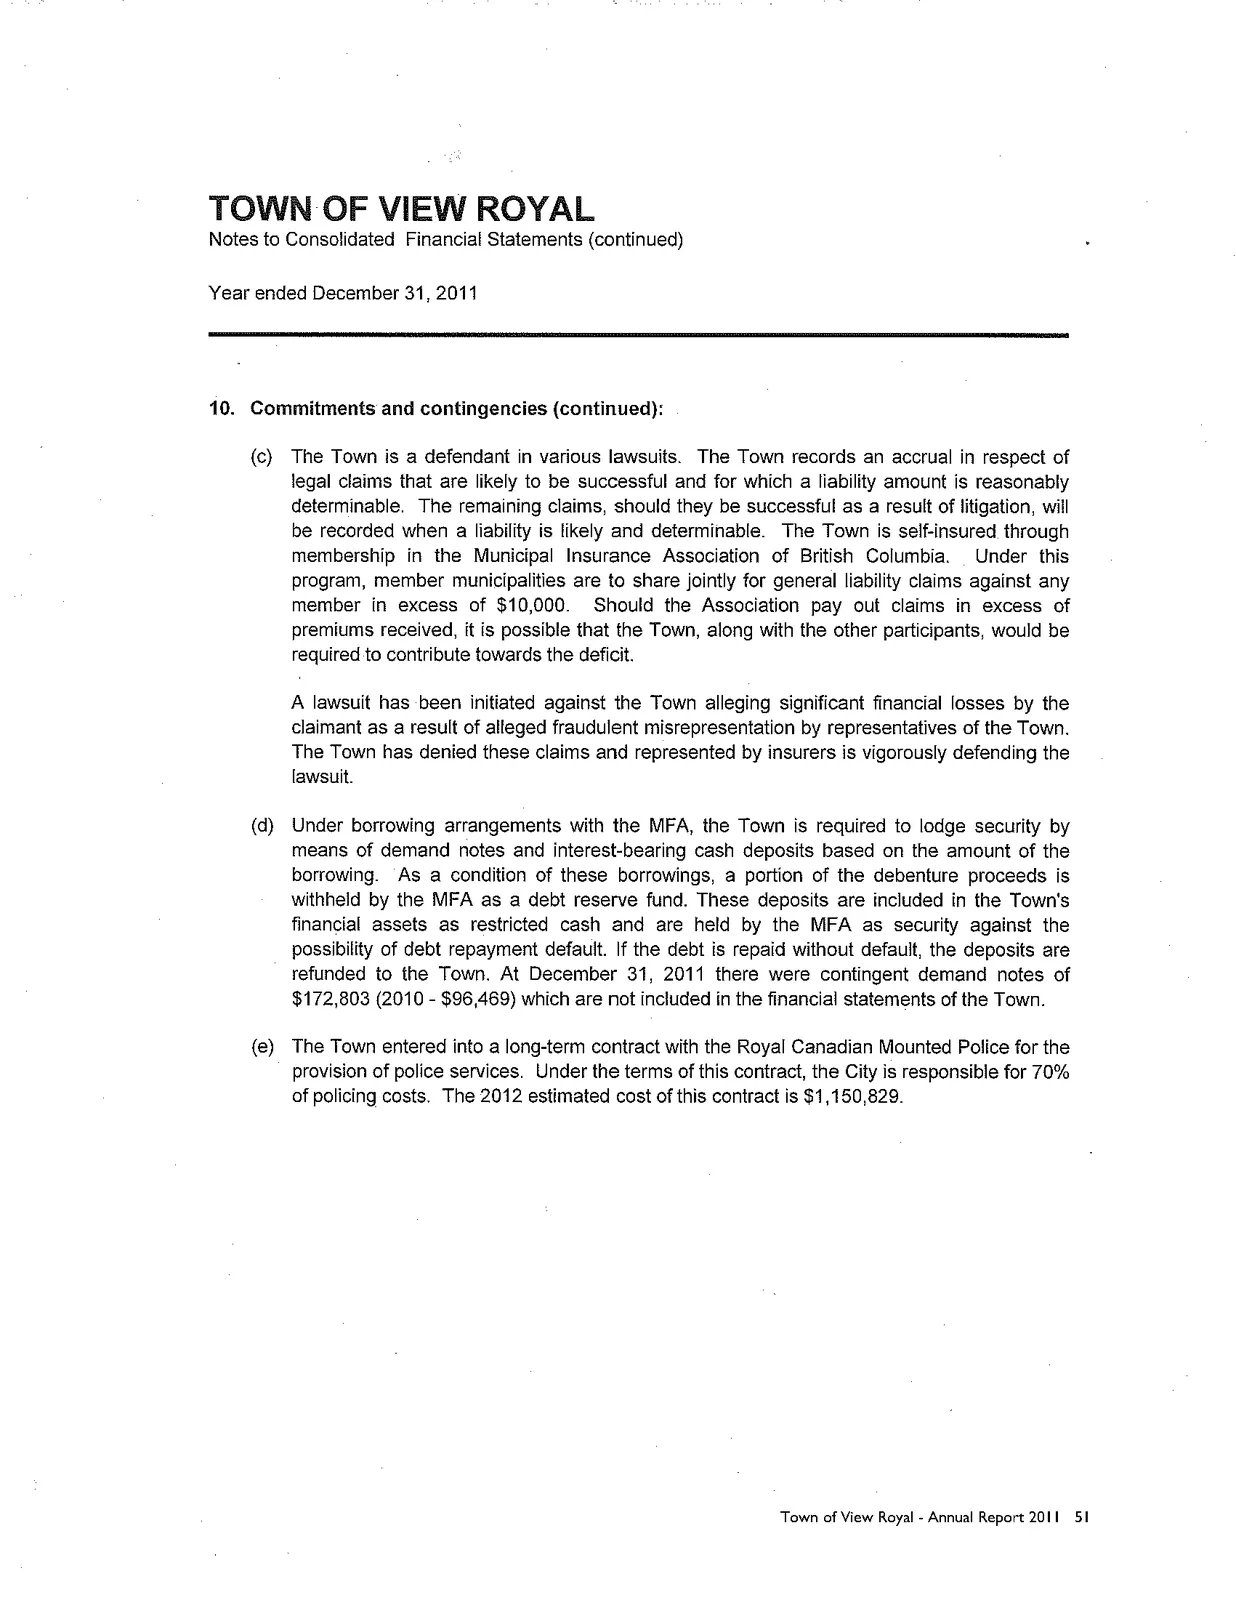
(c) The Town is a defendant in various lawsuits. The Town records an accrual in respect of legal claims that are likely to be successful and for which a liability amount is reasonably determinable. The remaining claims, should they be successful as a result of litigation, will be recorded when a liability is likely and determinable. The Town is self-insured through membership in the Municipal Insurance Association of British Columbia. Under this program, member municipalities are to share jointly for general liability claims against any member in excess of $10,000. Should the Association pay out claims in excess of premiums received, it is possible that the Town, along with the other participants, would be required to contribute towards the deficit.
A lawsuit has been initiated against the Town alleging significant financial losses by the claimant as a result of alleged fraudulent misrepresentation by representatives of the Town. The Town has denied these claims and represented by insurers is vigorously defending the lawsuit.
(d) Under borrowing arrangements with the MFA, the Town is required to lodge security by means of demand notes and interest-bearing cash deposits based on the amount of the borrowing. As a condition of these borrowings, a portion of the debenture proceeds is withheld by the MFA as a debt reserve fund. These deposits are included in the Town's financial assets as restricted cash and are held by the MFA as security against the possibility of debt repayment default. If the debt is repaid without default, the deposits are refunded to the Town. At December 31, 2011 there were contingent demand notes of $172,803 (2010 - $96,469) which are not included in the financial statements of the Town.
(e) The Town entered into a long-term contract with the Royal Canadian Mounted Police for the provision of police services. Under the terms of this contract, the City is responsible for 70% of policing costs. The 2012 estimated cost of this contract is $1,150,829.
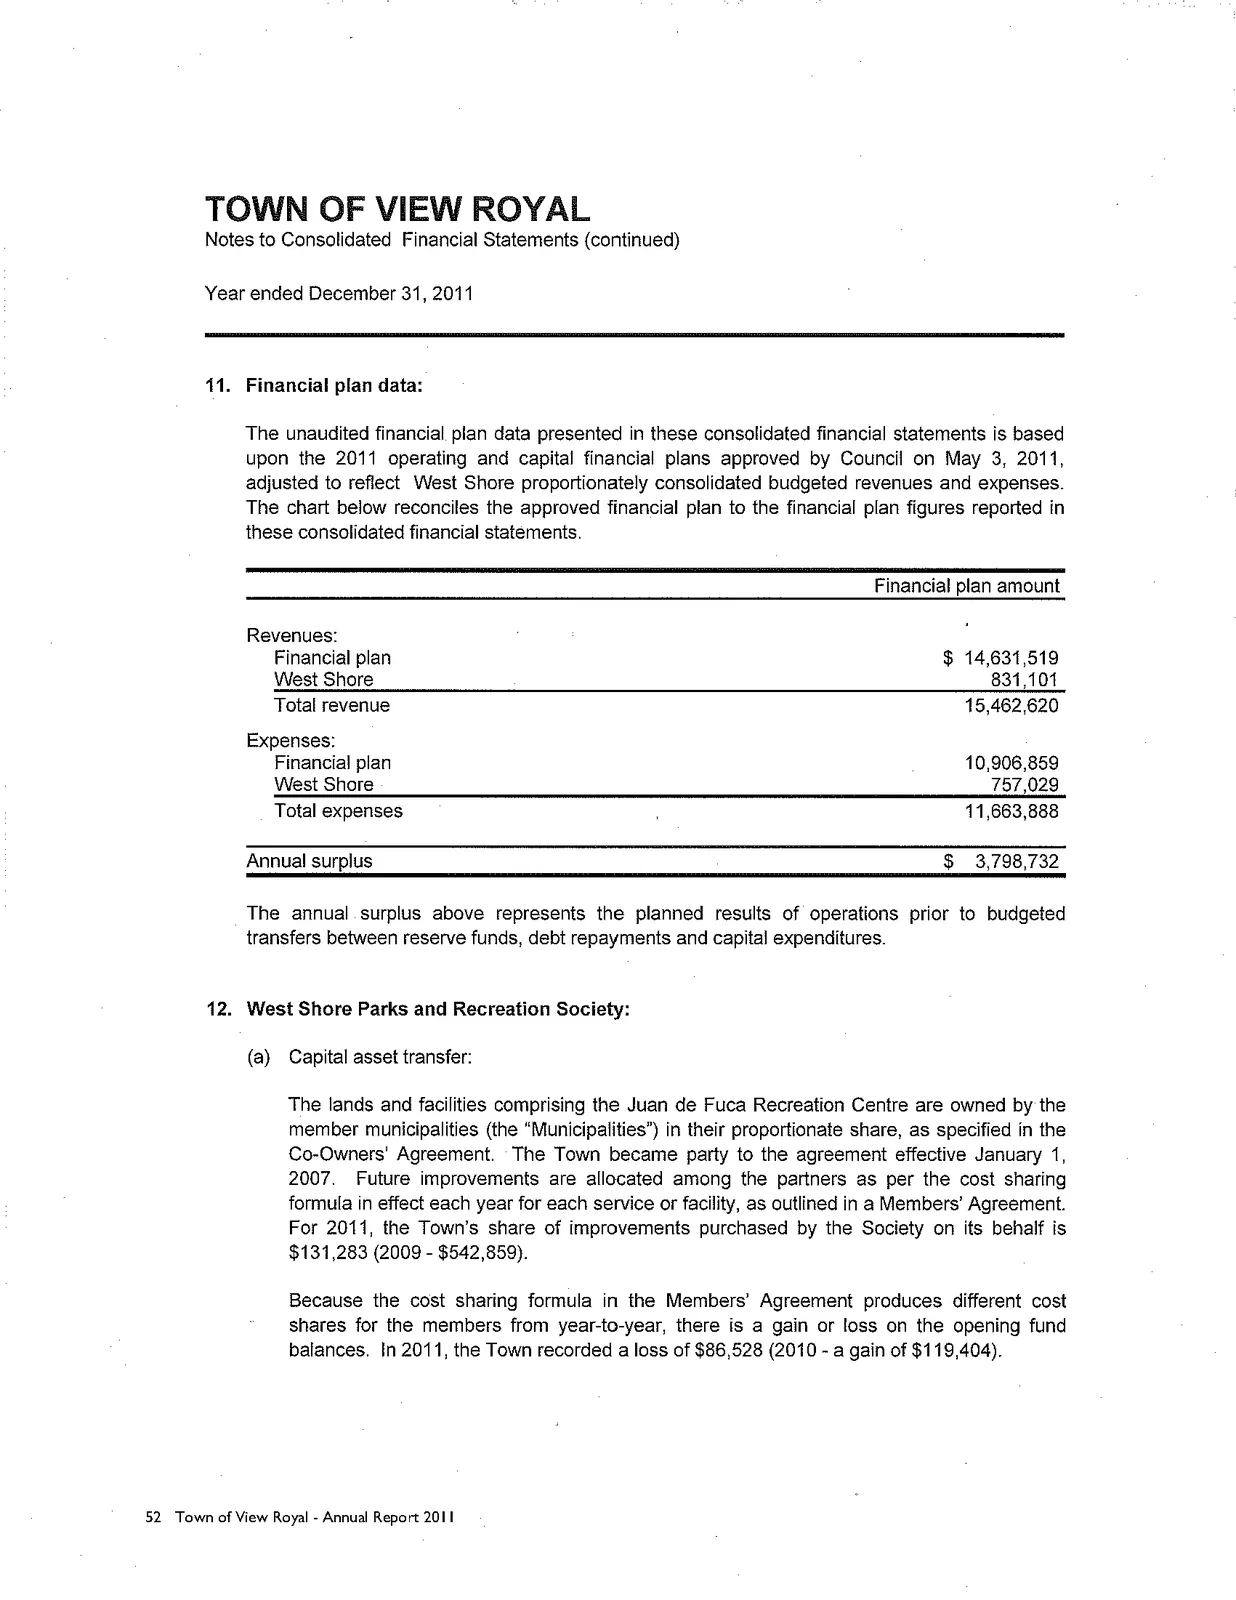
11. Financial plan data:
The unaudited financial plan data presented in these consolidated financial statements is based upon the 2011 operating and capital financial plans approved by Council on May 3, 2011, adjusted to reflect West Shore proportionately consolidated budgeted revenues and expenses. The chart below reconciles the approved financial plan to the financial plan figures reported in these consolidated financial statements.
| Financial plan amount | |
|---|---|
| Revenues: | |
| Financial plan | $ 14,631,519 |
| West Shore | 831,101 |
| Total revenue | 15,462,620 |
| Expenses: | |
| Financial plan | 10,906,859 |
| West Shore | 757,029 |
| Total expenses | 11,663,888 |
| Annual surplus | $ 3,798,732 |
The annual surplus above represents the planned results of operations prior to budgeted transfers between reserve funds, debt repayments and capital expenditures.
12. West Shore Parks and Recreation Society:
(a) Capital asset transfer: The lands and facilities comprising the Juan de Fuca Recreation Centre are owned by the member municipalities (the "Municipalities") in their proportionate share, as specified in the Co-Owners' Agreement. The Town became party to the agreement effective January 1, 2007. Future improvements are allocated among the partners as per the cost sharing formula in effect each year for each service or facility, as outlined in a Members' Agreement. For 2011, the Town's share of improvements purchased by the Society on its behalf is $131,283 (2009 - $542,859).
Because the cost sharing formula in the Members' Agreement produces different cost shares for the members from year-to-year, there is a gain or loss on the opening fund balances. In 2011, the Town recorded a loss of $86,528 (2010 - a gain of $119,404).
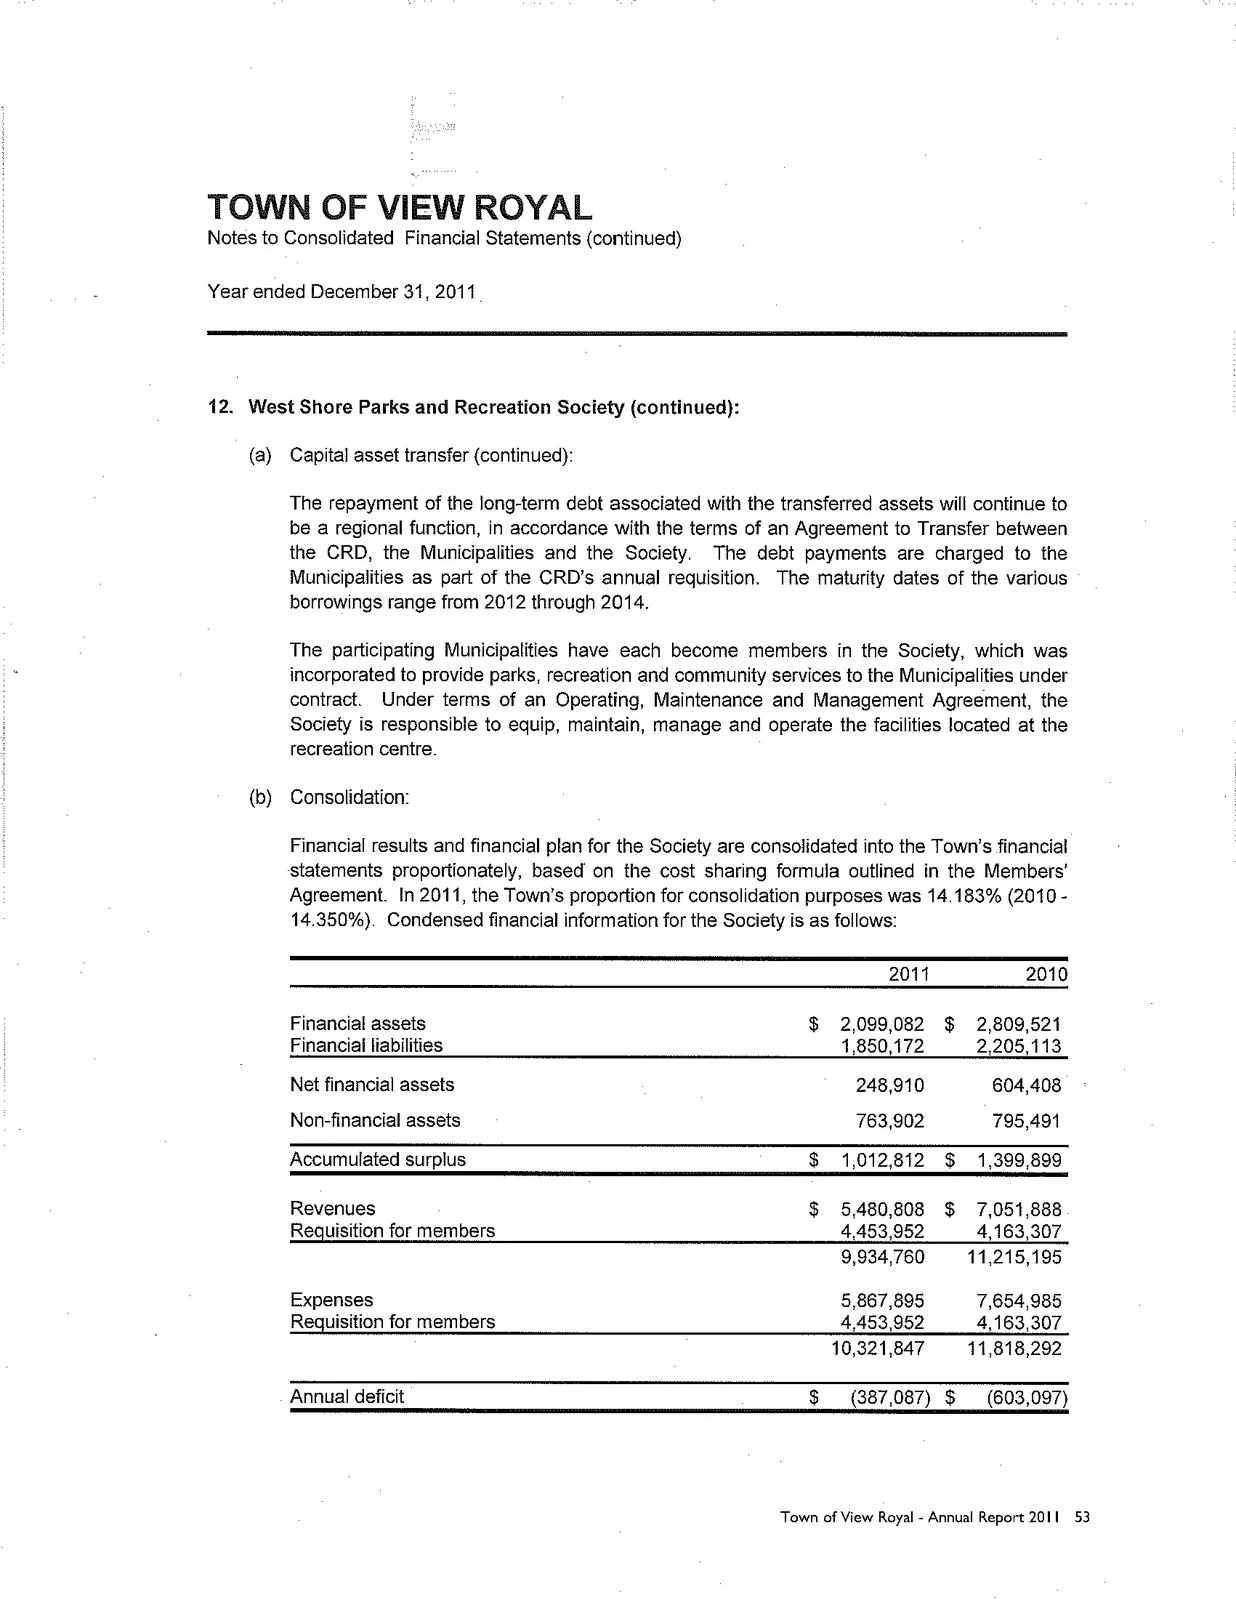
The repayment of the long-term debt associated with the transferred assets will continue to be a regional function, in accordance with the terms of an Agreement to Transfer between the CRD, the Municipalities and the Society. The debt payments are charged to the Municipalities as part of the CRD's annual requisition. The maturity dates of the various borrowings range from 2012 through 2014.
The participating Municipalities have each become members in the Society, which was incorporated to provide parks, recreation and community services to the Municipalities under contract. Under terms of an Operating, Maintenance and Management Agreement, the Society is responsible to equip, maintain, manage and operate the facilities located at the recreation centre.
(b) Consolidation: Financial results and financial plan for the Society are consolidated into the Town's financial statements proportionately, based on the cost sharing formula outlined in the Members' Agreement. In 2011, the Town's proportion for consolidation purposes was 14.183% (2010 - 14.350%). Condensed financial information for the Society is as follows:
| 2011 | 2010 | |
|---|---|---|
| Financial assets | $ 2,099,082 | $ 2,809,521 |
| Financial liabilities | 1,850,172 | 2,205,113 |
| Net financial assets | 248,910 | 604,408 |
| Non-financial assets | 763,902 | 795,491 |
| Accumulated surplus | $ 1,012,812 | $ 1,399,899 |
| Revenues | $ 5,480,808 | $ 7,051,888 |
| Requisition for members | 4,453,952 | 4,163,307 |
| 9,934,760 | 11,215,195 | |
| Expenses | 5,867,895 | 7,654,985 |
| Requisition for members | 4,453,952 | 4,163,307 |
| 10,321,847 | 11,818,292 | |
| Annual deficit | $ (387,087) | $ (603,097) |
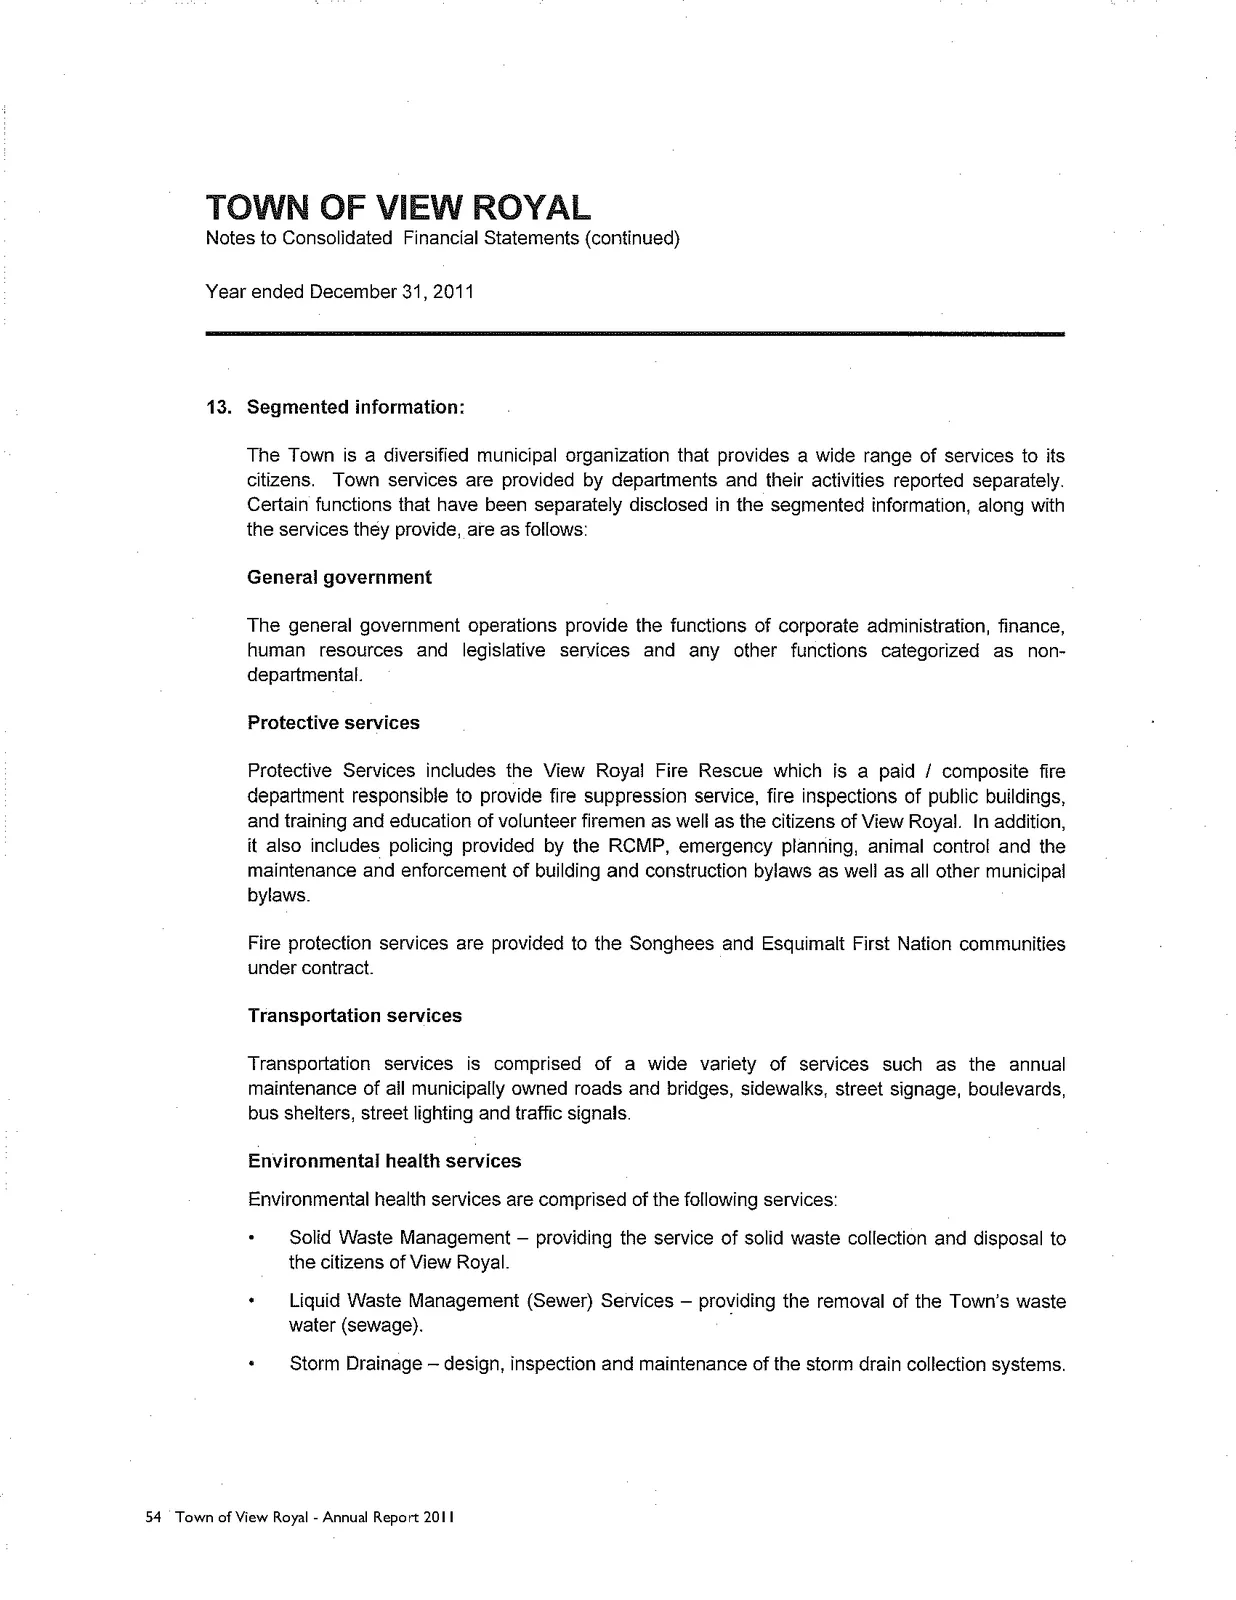
13. Segmented information:
The Town is a diversified municipal organization that provides a wide range of services to its citizens. Town services are provided by departments and their activities reported separately. Certain functions that have been separately disclosed in the segmented information, along with the services they provide, are as follows:
General government The general government operations provide the functions of corporate administration, finance, human resources and legislative services and any other functions categorized as non-departmental.
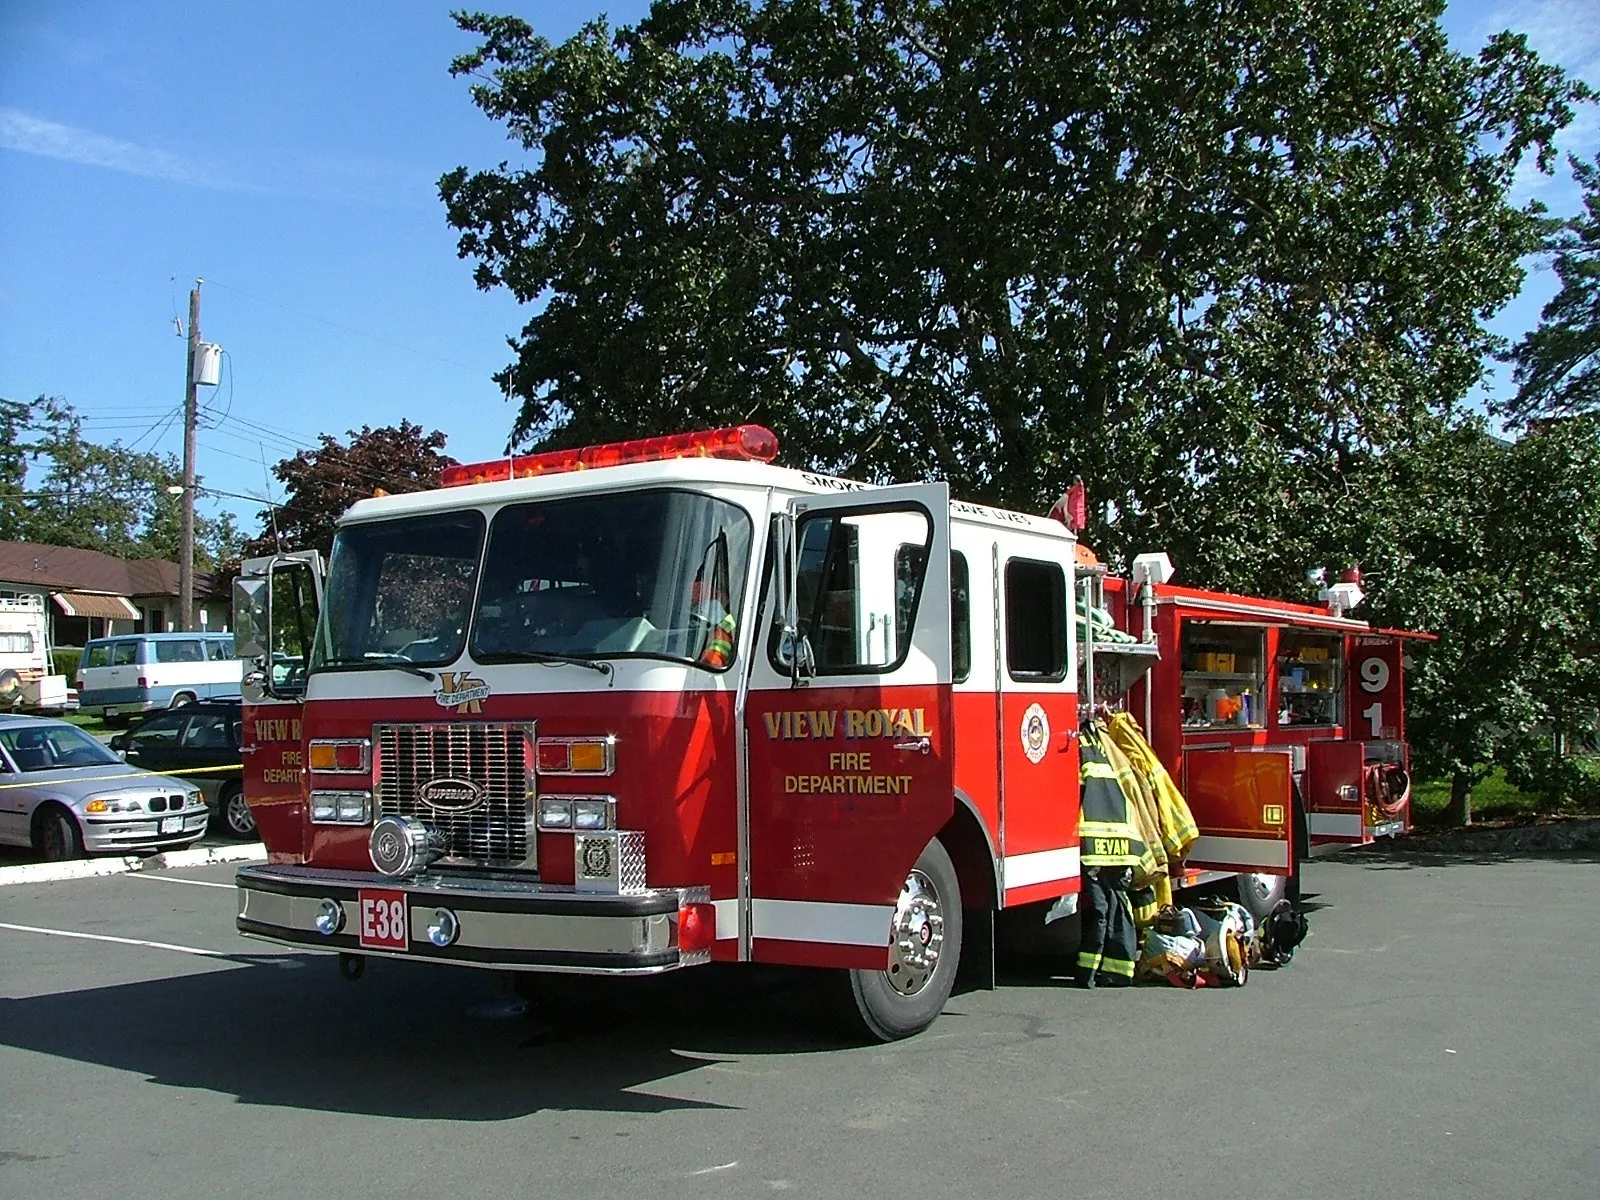
Protective services Protective Services includes the View Royal Fire Rescue which is a paid / composite fire department responsible to provide fire suppression service, fire inspections of public buildings, and training and education of volunteer firemen as well as the citizens of View Royal. In addition, it also includes policing provided by the RCMP, emergency planning, animal control and the maintenance and enforcement of building and construction bylaws as well as all other municipal bylaws.
Fire protection services are provided to the Songhees and Esquimalt First Nation communities under contract.
Transportation services Transportation services is comprised of a wide variety of services such as the annual maintenance of all municipally owned roads and bridges, sidewalks, street signage, boulevards, bus shelters, street lighting and traffic signals.
Environmental health services Environmental health services are comprised of the following services:
- Solid Waste Management – providing the service of solid waste collection and disposal to the citizens of View Royal.
- Liquid Waste Management (Sewer) Services – providing the removal of the Town's waste water (sewage).
- Storm Drainage – design, inspection and maintenance of the storm drain collection systems.
Planning and development services Environmental development services include all land use, planning and zoning issues in the Town of View Royal.
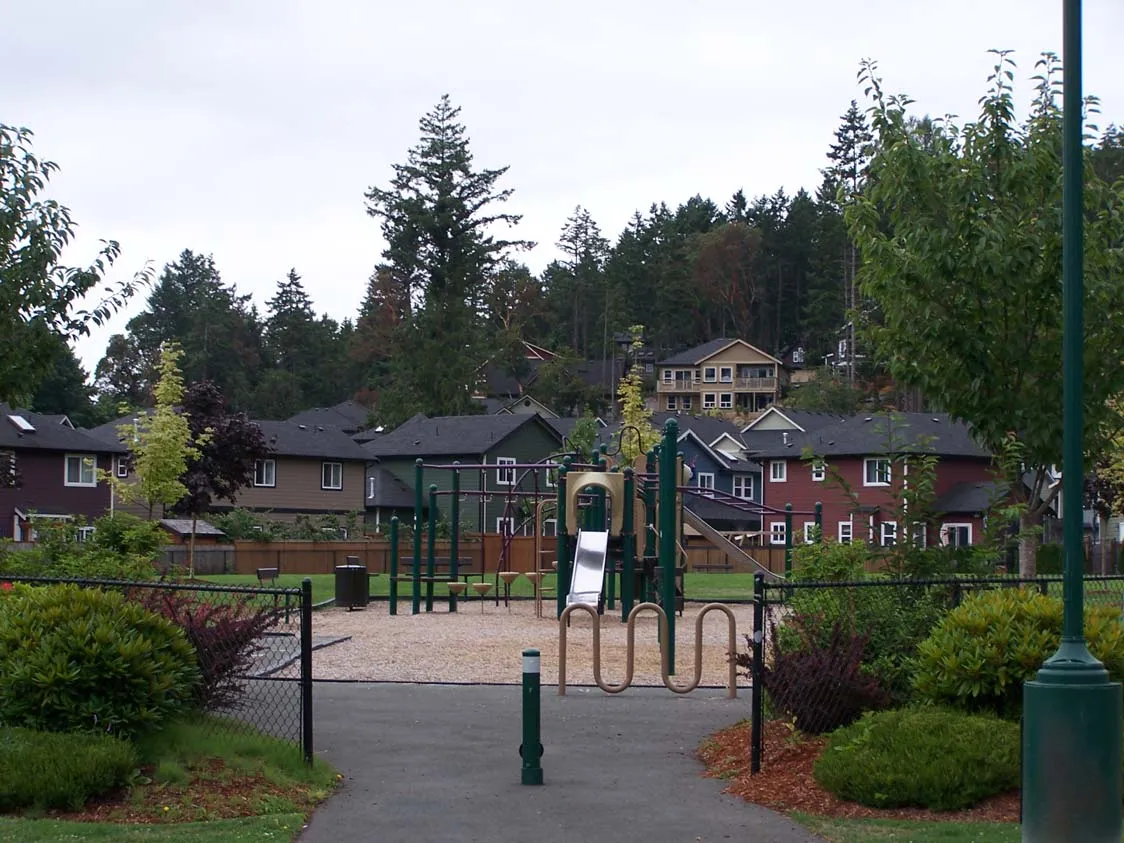
Recreation and cultural services Recreation and culture is comprised of services meant to improve the health and development of the citizens of View Royal.
This segment includes maintenance and development of all parks and green space within the Town of View Royal as well as the Town's financial contribution to the services provided by the Greater Victoria Public Library and the West Shore Parks and Recreation Society.
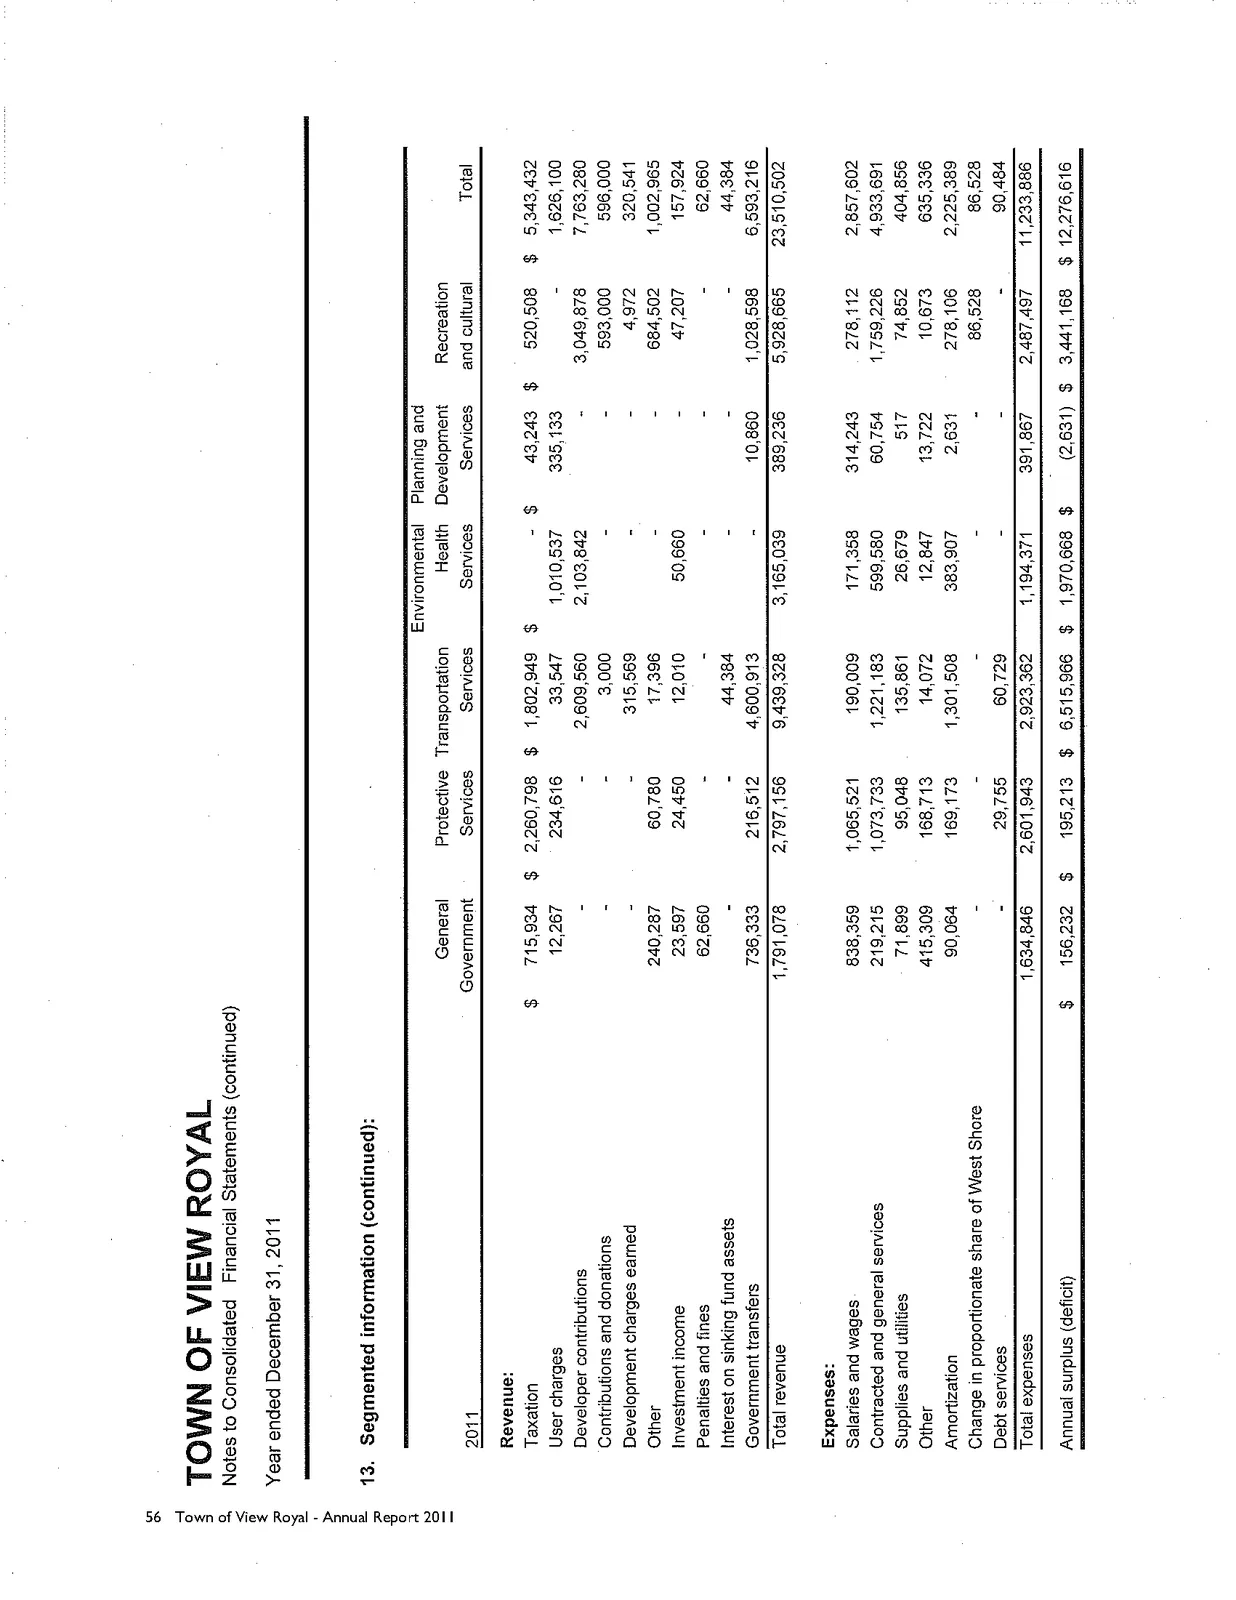
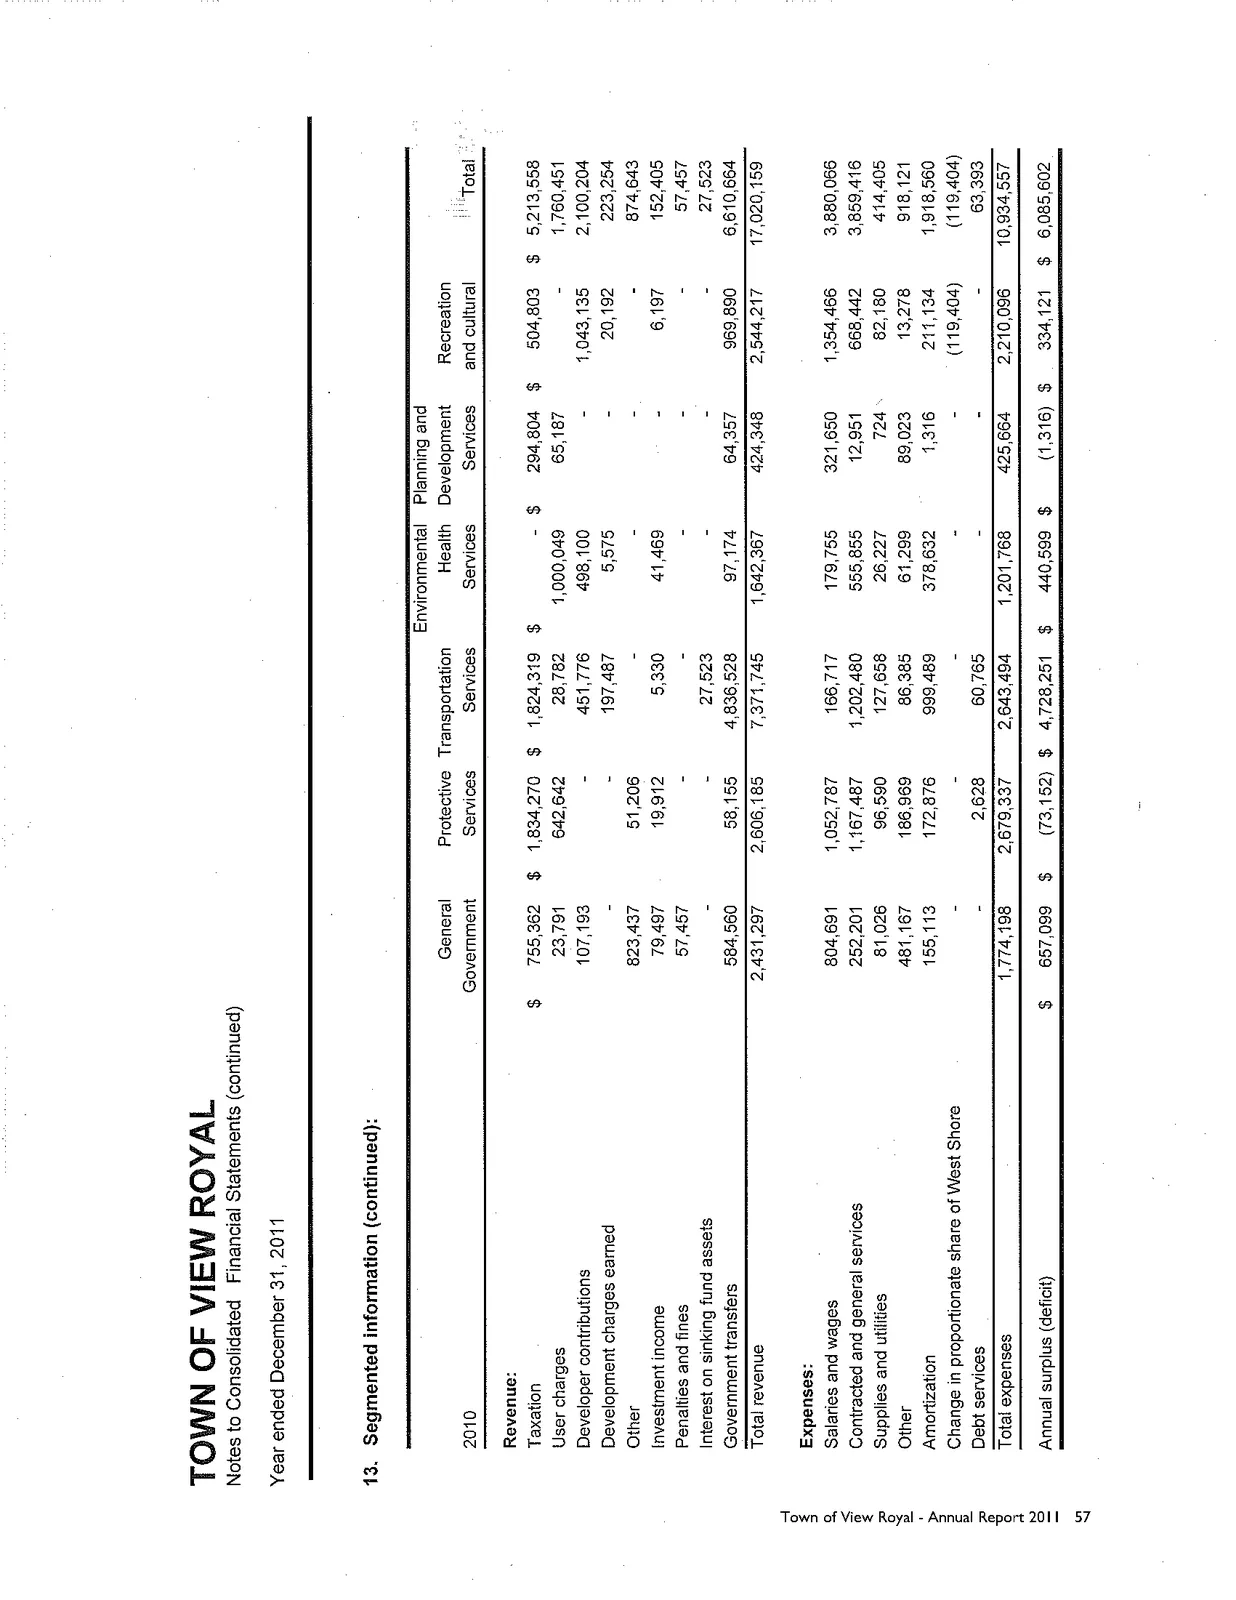
13. Segmented information (continued):
2011
| General Government | Protective Services | Transportation Services | Environmental Health Services | Planning and Development Services | Recreation and cultural | Total | |
|---|---|---|---|---|---|---|---|
| Revenue: | |||||||
| Taxation | $ 715,934 | $ 2,260,798 | $ 1,802,949 | $ - | $ 43,243 | $ 520,508 | $ 5,343,432 |
| User charges | 12,267 | 234,616 | 33,547 | 1,010,537 | 335,133 | - | 1,626,100 |
| Developer contributions | - | - | 2,609,560 | 2,103,842 | - | 3,049,878 | 7,763,280 |
| Contributions and donations | - | - | 3,000 | - | - | 593,000 | 596,000 |
| Development charges earned | - | - | 315,569 | - | - | 4,972 | 320,541 |
| Other | 240,287 | 60,780 | 17,396 | - | - | 684,502 | 1,002,965 |
| Investment income | 23,597 | 24,450 | 12,010 | 50,660 | - | 47,207 | 157,924 |
| Penalties and fines | 62,660 | - | - | - | - | - | 62,660 |
| Interest on sinking fund assets | - | - | 44,384 | - | - | - | 44,384 |
| Government transfers | 736,333 | 216,512 | 4,600,913 | - | 10,860 | 1,028,598 | 6,593,216 |
| Total revenue | 1,791,078 | 2,797,156 | 9,439,328 | 3,165,039 | 389,236 | 5,928,665 | 23,510,502 |
| Expenses: | |||||||
| Salaries and wages | 838,359 | 1,065,521 | 190,009 | 171,358 | 314,243 | 278,112 | 2,857,602 |
| Contracted and general services | 219,215 | 1,073,733 | 1,221,183 | 599,580 | 60,754 | 1,759,226 | 4,933,691 |
| Supplies and utilities | 71,899 | 95,048 | 135,861 | 26,679 | 517 | 74,852 | 404,856 |
| Other | 415,309 | 168,713 | 14,072 | 12,847 | 13,722 | 10,673 | 635,336 |
| Amortization | 90,064 | 169,173 | 1,301,508 | 383,907 | 2,631 | 278,106 | 2,225,389 |
| Change in proportionate share of West Shore | - | - | - | - | - | 86,528 | 86,528 |
| Debt services | - | 29,755 | 60,729 | - | - | - | 90,484 |
| Total expenses | 1,634,846 | 2,601,943 | 2,923,362 | 1,194,371 | 391,867 | 2,487,497 | 11,233,886 |
| Annual surplus (deficit) | $ 156,232 | $ 195,213 | $ 6,515,966 | $ 1,970,668 | $ (2,631) | $ 3,441,168 | $ 12,276,616 |
13. Segmented information (continued):
2010
| General Government | Protective Services | Transportation Services | Environmental Health Services | Planning and Development Services | Recreation and cultural | Total | |
|---|---|---|---|---|---|---|---|
| Revenue: | |||||||
| Taxation | $ 755,362 | $ 1,834,270 | $ 1,824,319 | $ - | $ 294,804 | $ 504,803 | $ 5,213,558 |
| User charges | 23,791 | 642,642 | 28,782 | 1,000,049 | 65,187 | - | 1,760,451 |
| Developer contributions | 107,193 | - | 451,776 | 498,100 | - | 1,043,135 | 2,100,204 |
| Development charges earned | - | - | 197,487 | 5,575 | - | 20,192 | 223,254 |
| Other | 823,437 | 51,206 | - | - | - | - | 874,643 |
| Investment income | 79,497 | 19,912 | 5,330 | 41,469 | - | 6,197 | 152,405 |
| Penalties and fines | 57,457 | - | - | - | - | - | 57,457 |
| Interest on sinking fund assets | - | - | 27,523 | - | - | - | 27,523 |
| Government transfers | 584,560 | 58,155 | 4,836,528 | 97,174 | 64,357 | 969,890 | 6,610,664 |
| Total revenue | 2,431,297 | 2,606,185 | 7,371,745 | 1,642,367 | 424,348 | 2,544,217 | 17,020,159 |
| Expenses: | |||||||
| Salaries and wages | 804,691 | 1,052,787 | 166,717 | 179,755 | 321,650 | 1,354,466 | 3,880,066 |
| Contracted and general services | 252,201 | 1,167,487 | 1,202,480 | 555,855 | 12,951 | 668,442 | 3,859,416 |
| Supplies and utilities | 81,026 | 96,590 | 127,658 | 26,227 | 724 | 82,180 | 414,405 |
| Other | 481,167 | 186,969 | 86,385 | 61,299 | 89,023 | 13,278 | 918,121 |
| Amortization | 155,113 | 172,876 | 999,489 | 378,632 | 1,316 | 211,134 | 1,918,560 |
| Change in proportionate share of West Shore | - | - | - | - | - | (119,404) | (119,404) |
| Debt services | - | 2,628 | 60,765 | - | - | - | 63,393 |
| Total expenses | 1,774,198 | 2,679,337 | 2,643,494 | 1,201,768 | 425,664 | 2,210,096 | 10,934,557 |
| Annual surplus (deficit) | $ 657,099 | $ (73,152) | $ 4,728,251 | $ 440,599 | $ (1,316) | $ 334,121 | $ 6,085,602 |
14. Comparative information:
Certain comparative information has been reclassified to conform with the financial statement presentation adopted for the current year.
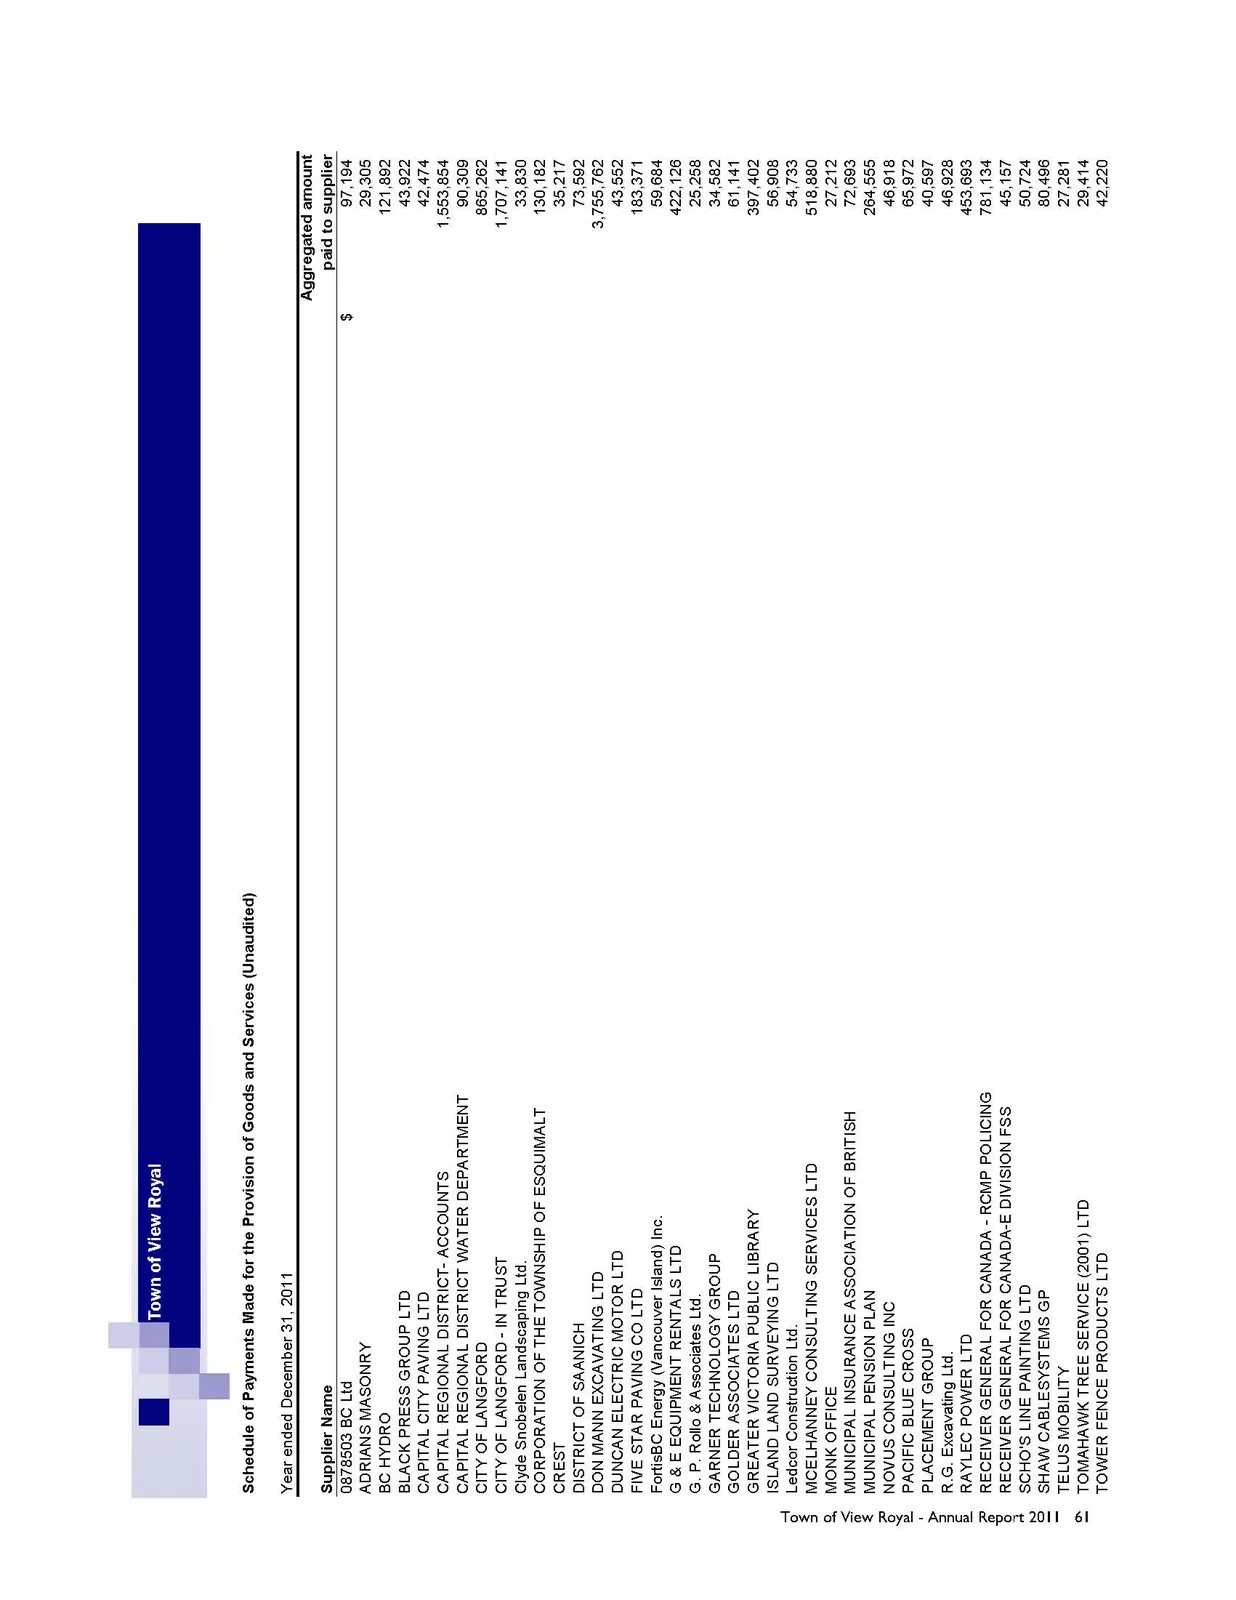
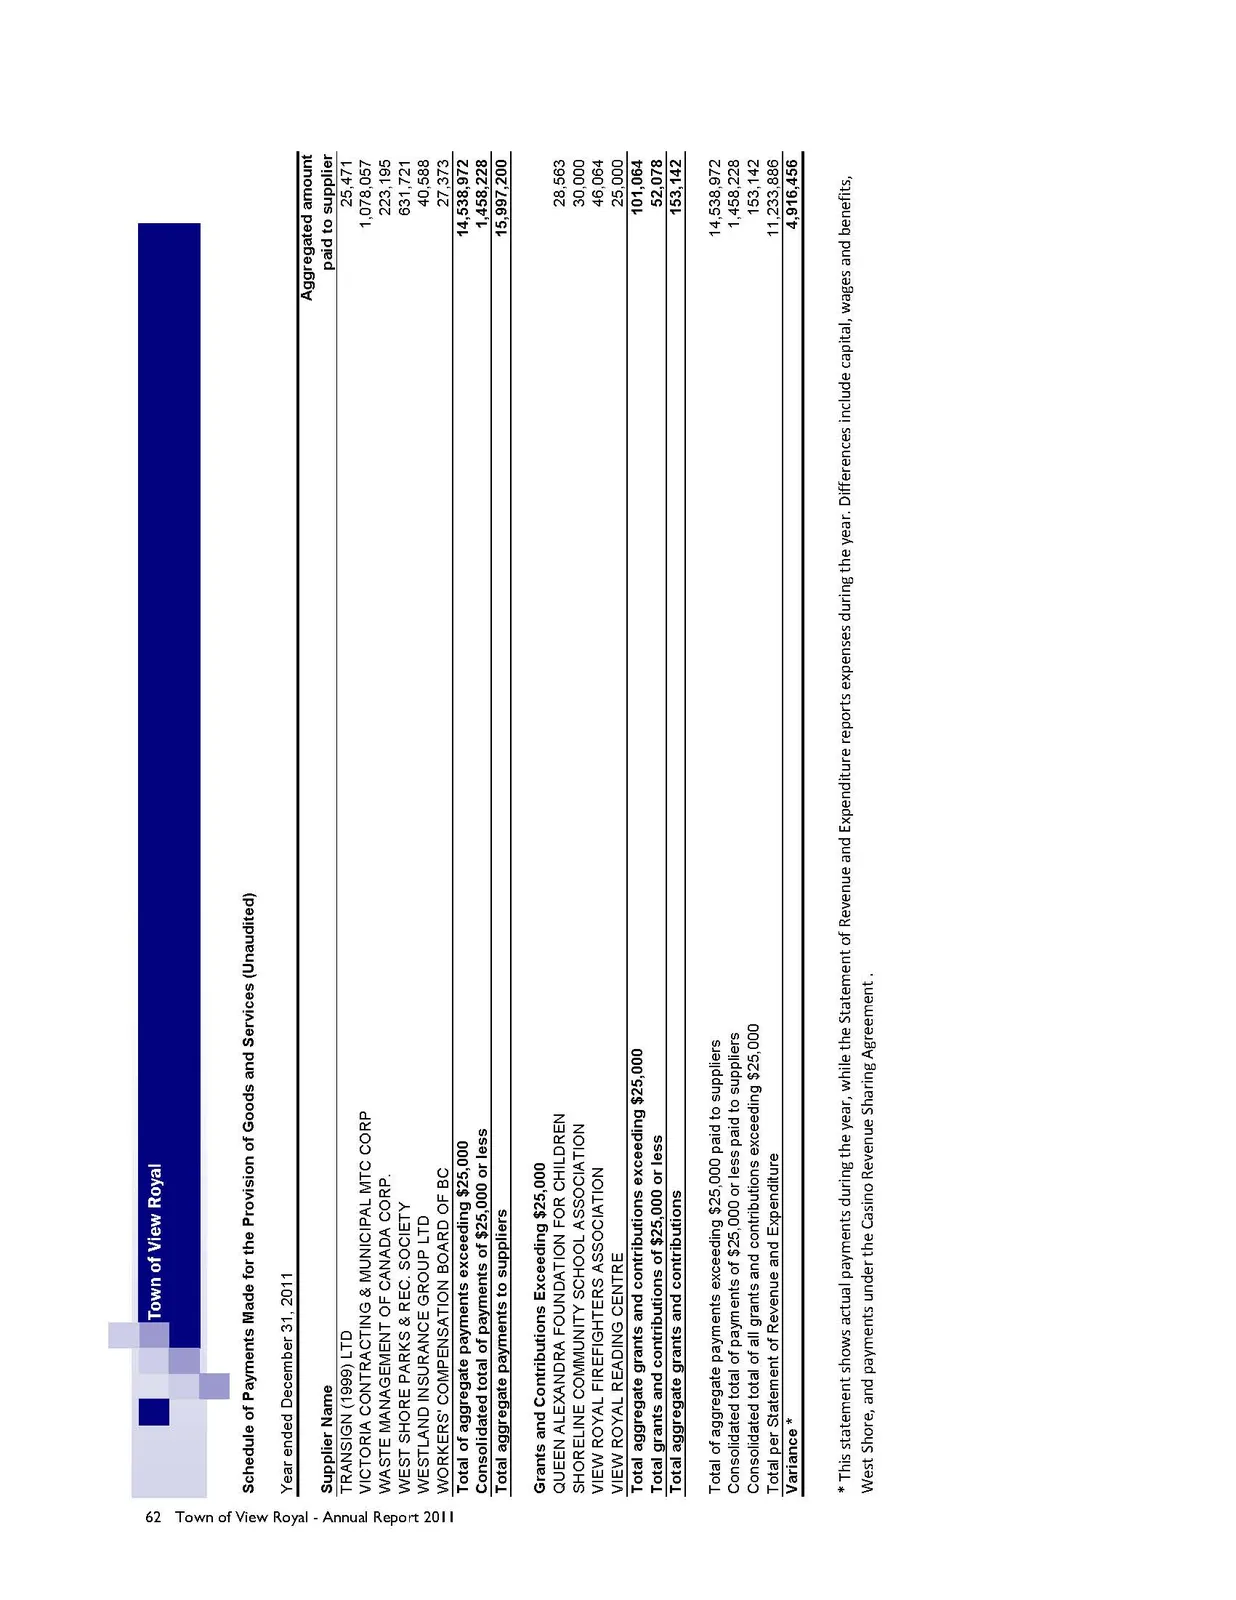
Schedule of Payments Made for the Provision of Goods and Services (Unaudited)
Year ended December 31, 2011
| Supplier Name | Aggregated amount paid to supplier |
|---|---|
| 0878503 BC Ltd | $ 97,194 |
| ADRIANS MASONRY | 29,305 |
| BC HYDRO | 121,892 |
| BLACK PRESS GROUP LTD | 43,922 |
| CAPITAL CITY PAVING LTD | 42,474 |
| CAPITAL REGIONAL DISTRICT- ACCOUNTS | 1,553,854 |
| CAPITAL REGIONAL DISTRICT WATER DEPARTMENT | 90,309 |
| CITY OF LANGFORD | 865,262 |
| CITY OF LANGFORD - IN TRUST | 1,707,141 |
| Clyde Snobelen Landscaping Ltd. | 33,830 |
| CORPORATION OF THE TOWNSHIP OF ESQUIMALT | 130,182 |
| CREST | 35,217 |
| DISTRICT OF SAANICH | 73,592 |
| DON MANN EXCAVATING LTD | 3,755,762 |
| DUNCAN ELECTRIC MOTOR LTD | 41,552 |
| FIVE STAR PAVING CO LTD | 183,371 |
| FortisBC Energy (Vancouver Island) Inc. | 59,684 |
| G & E EQUIPMENT RENTALS LTD | 422,126 |
| G. P. Rollo & Associates Ltd. | 25,258 |
| GARNER TECHNOLOGY GROUP | 34,582 |
| GOLDER ASSOCIATES LTD | 61,141 |
| GREATER VICTORIA PUBLIC LIBRARY | 397,402 |
| ISLAND LAND SURVEYING LTD | 56,908 |
| Ledcor Construction Ltd. | 54,733 |
| MCELHANNEY CONSULTING SERVICES LTD | 518,880 |
| MONK OFFICE | 27,212 |
| MUNICIPAL INSURANCE ASSOCIATION OF BRITISH | 72,693 |
| MUNICIPAL PENSION PLAN | 264,555 |
| NOVUS CONSULTING INC | 46,918 |
| PACIFIC BLUE CROSS | 65,972 |
| PLACEMENT GROUP | 40,597 |
| R.G. Excavating Ltd. | 46,928 |
| RAYLEC POWER LTD | 453,693 |
| RECEIVER GENERAL FOR CANADA - RCMP POLICING | 781,134 |
| RECEIVER GENERAL FOR CANADA-E DIVISION FSS | 45,157 |
| SCHO'S LINE PAINTING LTD | 50,724 |
| SHAW CABLESYSTEMS GP | 80,496 |
| TELUS MOBILITY | 27,281 |
| TOMAHAWK TREE SERVICE (2001) LTD | 29,414 |
| TOWER FENCE PRODUCTS LTD | 42,220 |
| TRANSIGN (1999) LTD | 25,471 |
| VICTORIA CONTRACTING & MUNICIPAL MTC CORP | 1,078,057 |
| WASTE MANAGEMENT OF CANADA CORP. | 223,195 |
| WEST SHORE PARKS & REC. SOCIETY | 631,721 |
| WESTLAND INSURANCE GROUP LTD | 40,588 |
| WORKERS' COMPENSATION BOARD OF BC | 27,373 |
| Total of aggregate payments exceeding $25,000 | 14,538,972 |
| Consolidated total of payments of $25,000 or less | 1,458,228 |
| Total aggregate payments to suppliers | 15,997,200 |
| Grants and Contributions Exceeding $25,000 | |
| QUEEN ALEXANDRA FOUNDATION FOR CHILDREN | 28,563 |
| SHORELINE COMMUNITY SCHOOL ASSOCIATION | 30,000 |
| VIEW ROYAL FIREFIGHTERS ASSOCIATION | 46,084 |
| VIEW ROYAL READING CENTRE | 25,000 |
| Total aggregate grants and contributions exceeding $25,000 | 129,647 |
| Total aggregate grants and contributions of $25,000 or less | 23,495 |
| Total aggregate grants and contributions | 153,142 |
| Total of aggregate payments exceeding $25,000 paid to suppliers | 14,538,972 |
| Consolidated total of payments of $25,000 or less paid to suppliers | 1,458,228 |
| Consolidated total of all grants and contributions exceeding $25,000 | 153,142 |
| Total per Statement of Revenue and Expenditure | 11,233,886 |
| Variance* | 4,916,456 |
*This statement shows actual payments during the year, while the Statement of Revenue and Expenditure reports expenses during the year. Differences include capital, wages and benefits, West Shore, and payments under the Casino Revenue Sharing Agreement.
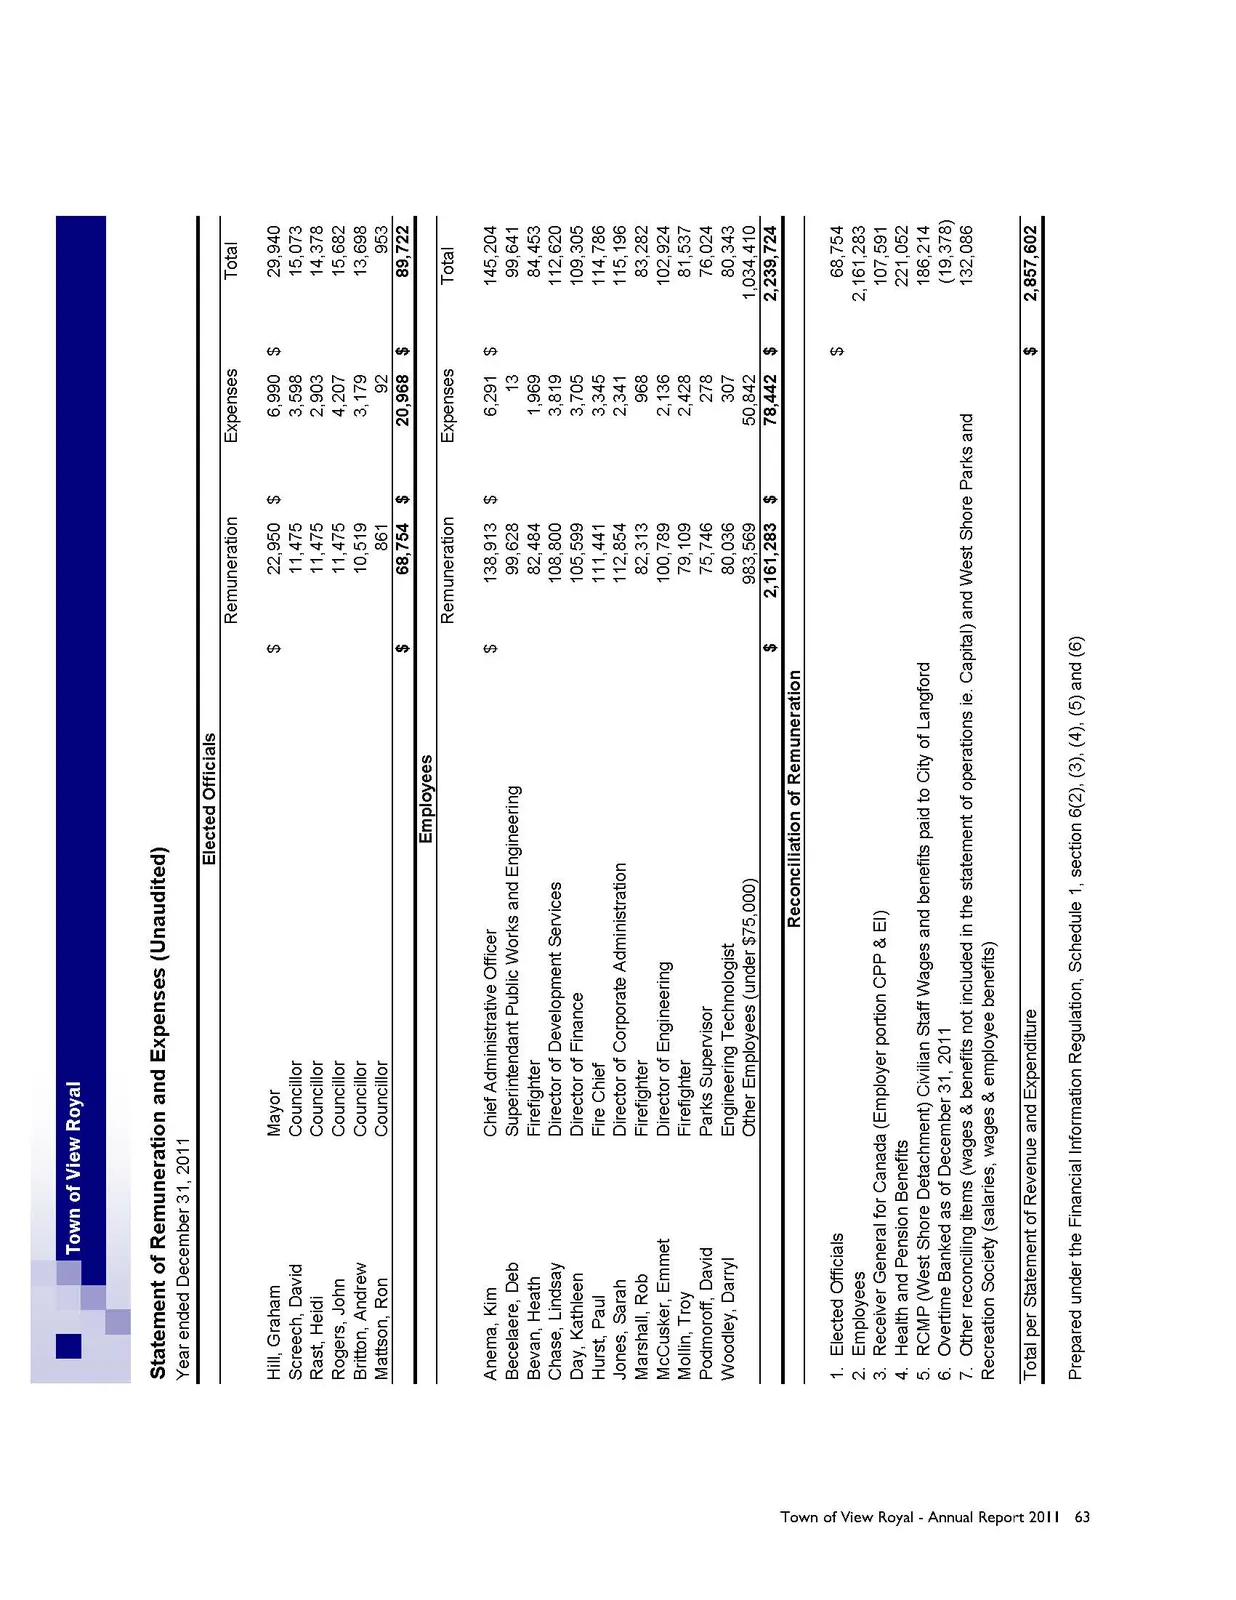
Statement of Remuneration and Expenses (Unaudited)
Year ended December 31, 2011
Elected Officials
| Name | Position | Remuneration | Expenses | Total |
|---|---|---|---|---|
| Hill, Graham | Mayor | $ 22,950 | $ 6,990 | $ 29,940 |
| Screech, David | Councillor | 11,475 | 3,598 | 15,073 |
| Rast, Heidi | Councillor | 11,475 | 2,903 | 14,378 |
| Rogers, John | Councillor | 11,475 | 4,207 | 15,682 |
| Britton, Andrew | Councillor | 10,519 | 3,179 | 13,698 |
| Mattson, Ron | Councillor | 861 | 92 | 953 |
| $ 68,754 | $ 20,968 | $ 89,722 |
Employees
| Name | Position | Remuneration | Expenses | Total |
|---|---|---|---|---|
| Anema, Kim | Chief Administrative Officer | $ 138,913 | $ 6,291 | $ 145,204 |
| Becelaere, Deb | Superintendent Public Works and Engineering | 99,628 | 13 | 99,641 |
| Bevan, Heath | Firefighter | 82,484 | 1,969 | 84,453 |
| Chase, Lindsay | Director of Development Services | 108,800 | 3,819 | 112,620 |
| Day, Kathleen | Director of Finance | 105,599 | 3,705 | 109,305 |
| Hurst, Paul | Fire Chief | 111,441 | 3,345 | 114,786 |
| Jones, Sarah | Director of Corporate Administration | 112,854 | 2,341 | 115,196 |
| Marshall, Rob | Firefighter | 82,313 | 968 | 83,282 |
| McCusker, Emmet | Director of Engineering | 100,789 | 2,136 | 102,924 |
| Mollin, Troy | Firefighter | 79,109 | 2,428 | 81,537 |
| Podmoroff, David | Parks Supervisor | 75,746 | 278 | 76,024 |
| Woodley, Darryl | Engineering Technologist | 80,036 | 307 | 80,343 |
| Other Employees (under $75,000) | 983,569 | 50,842 | 1,034,410 | |
| $ 2,161,283 | $ 78,442 | $ 2,239,724 |
Reconciliation of Remuneration
- Elected Officials: $ 68,754
- Employees: 2,161,283
- Receiver General for Canada (Employer portion CPP & EI): 107,591
- Health and Pension Benefits: 221,052
- RCMP (West Shore Detachment) Civilian Staff Wages and benefits paid to City of Langford: 186,214
- Overtime Banked as of December 31, 2011: (19,378)
- Other reconciling items (wages & benefits not included in the statement of operations ie. Capital) and West Shore Parks and Recreation Society (salaries, wages & employee benefits): 132,086
Total per Statement of Revenue and Expenditure: $ 2,857,602
Statement of Gaurantee and Indemnity Agreements
Year ended December 31, 2011
The Town of View Royal has not provided any guarantees or indemnities under the Gaurantee and Indemnities Regulation.
Statement of Severance Agreements
Year ended December 31, 2011
There were 2 severance agreements under which payments commenced between the Town of View Royal and an employee during the fiscal year 2011.
These agreements represent from 1 to 2 months of compensation.
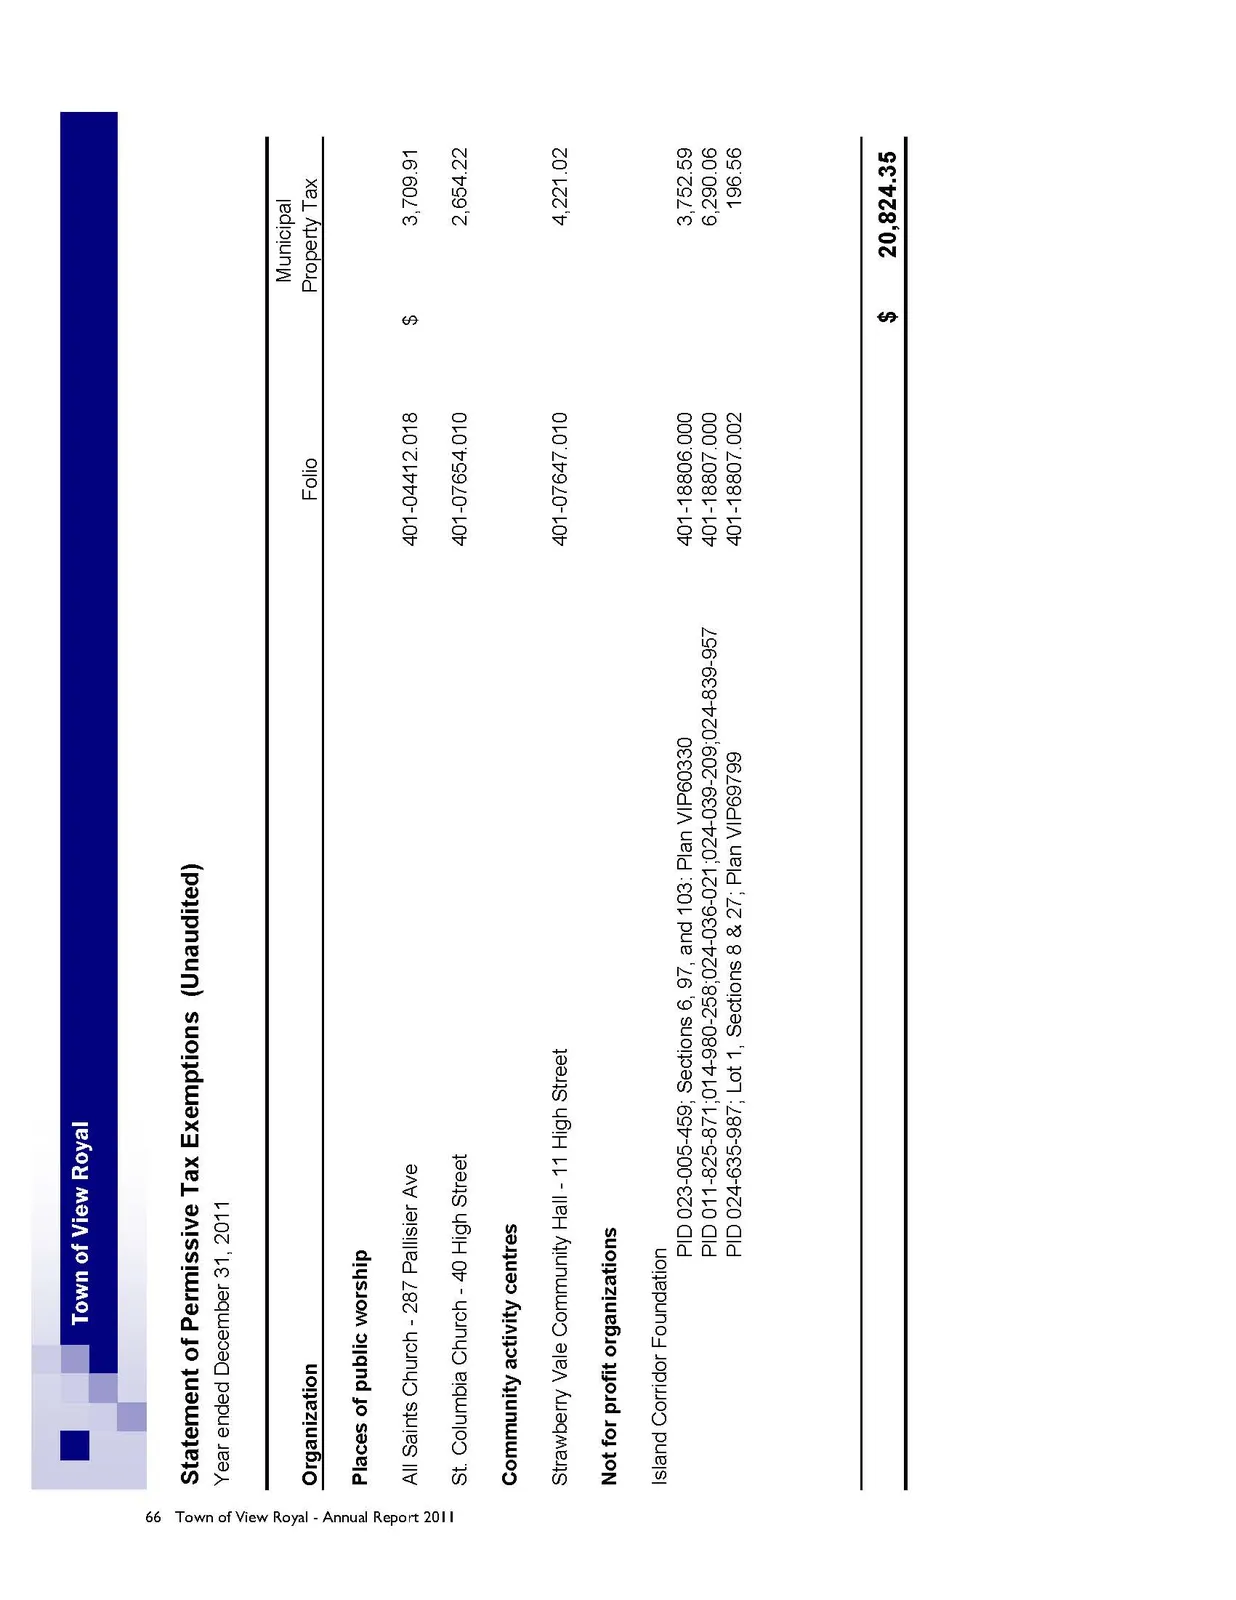
Statement of Permissive Tax Exemptions (Unaudited)
Year ended December 31, 2011
| Organization | Folio | Municipal Property Tax |
|---|---|---|
| Places of public worship | ||
| All Saints Church - 287 Pallisier Ave | 401-04412.018 | $ 3,709.91 |
| St. Columbia Church - 40 High Street | 401-07654.010 | 2,654.22 |
| Community activity centres | ||
| Strawberry Vale Community Hall - 11 High Street | 401-07647.010 | 4,221.02 |
| Not for profit organizations | ||
| Island Corridor Foundation | ||
| PID 023-005-459; Sections 6, 97, and 103; Plan VIP60330 | 401-18806.000 | 3,752.59 |
| PID 011-825-871; 014-980-258; 024-036-021; 024-039-209; 024-839-957 | 401-18807.000 | 6,290.06 |
| PID 024-635-987; Lot 1, Sections 8 & 27; Plan VIP69799 | 401-18807.002 | 196.56 |
| TOTAL | $ 20,824.35 |
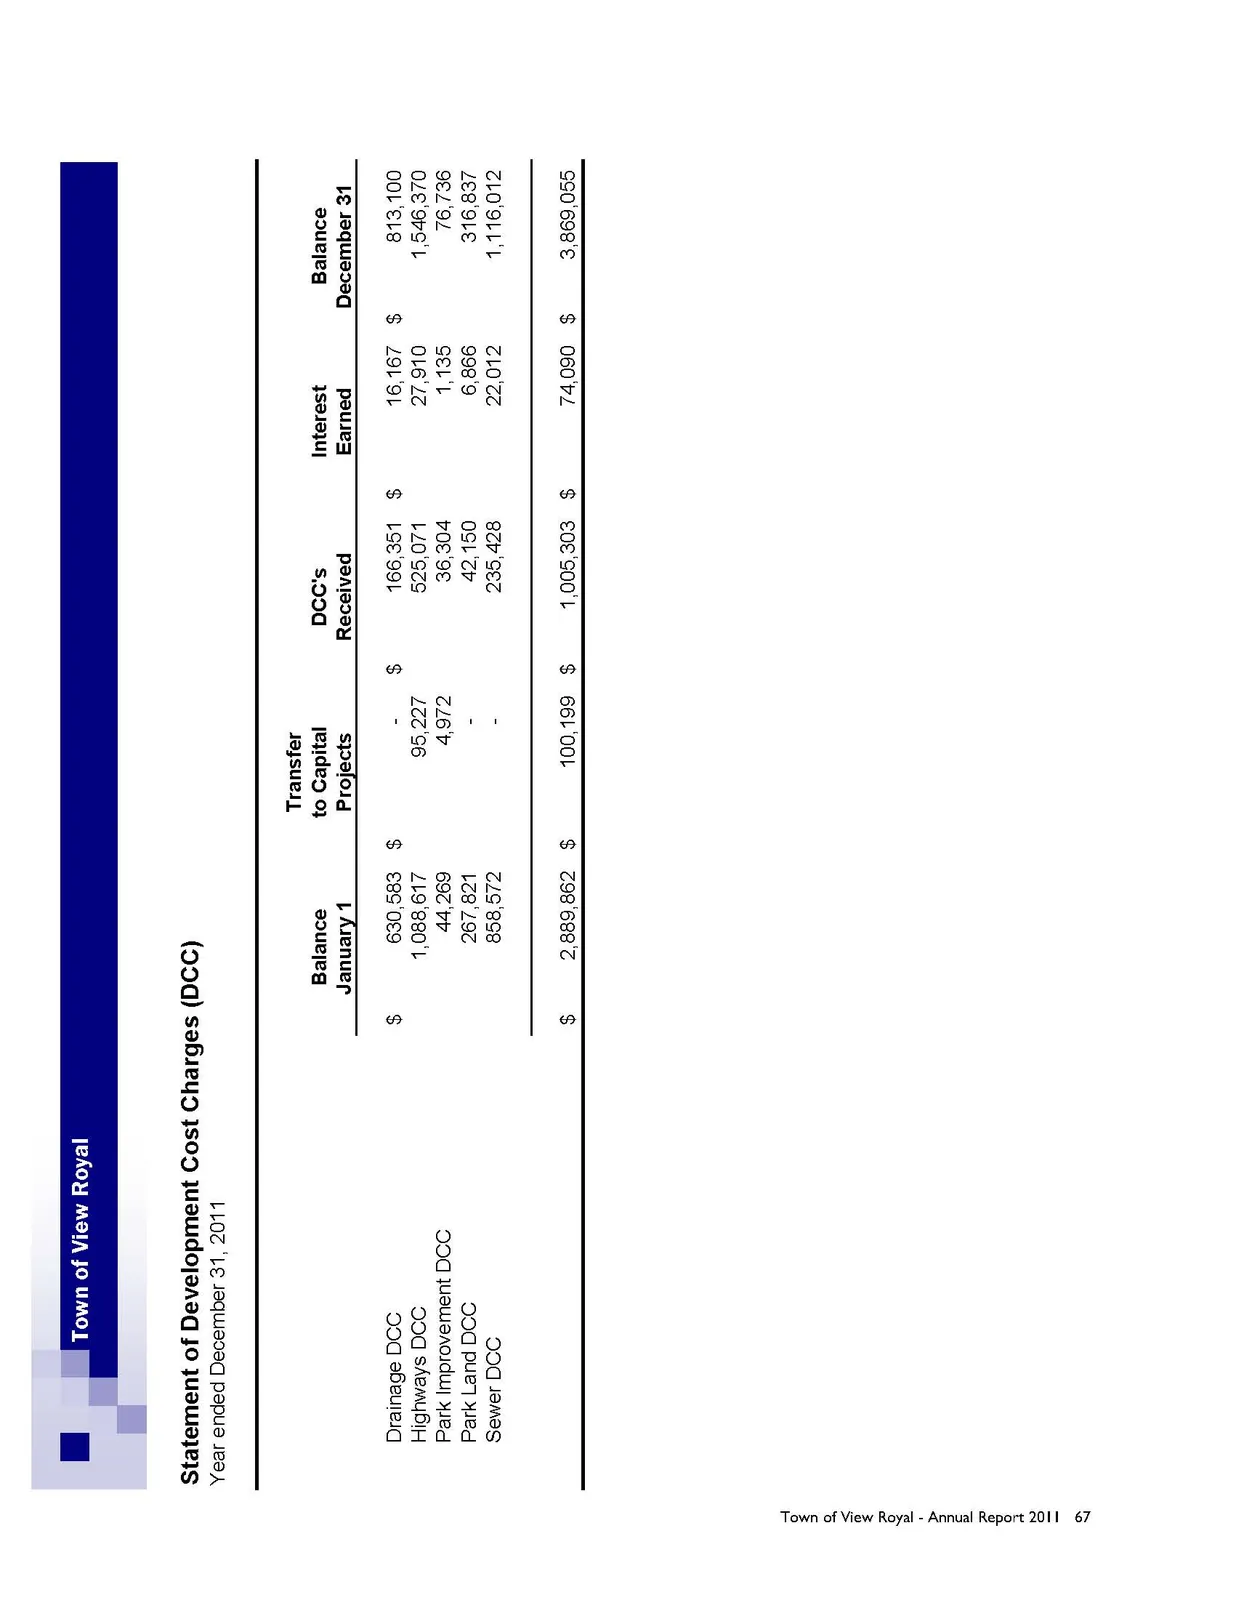
Statement of Development Cost Charges (DCC)
Year ended December 31, 2011
| Balance January 1 | Transfer to Capital Projects | DCC's Received | Interest Earned | Balance December 31 | |
|---|---|---|---|---|---|
| Drainage DCC | $ 630,583 | $ - | $ 166,351 | $ 16,167 | $ 813,100 |
| Highways DCC | 1,088,617 | 95,227 | 525,071 | 27,910 | 1,546,370 |
| Park Improvement DCC | 44,269 | 4,972 | 36,304 | 1,135 | 76,736 |
| Park Land DCC | 267,821 | - | 42,150 | 6,866 | 316,837 |
| Sewer DCC | 858,572 | - | 235,428 | 22,012 | 1,116,012 |
| $ 2,889,862 | $ 100,199 | $ 1,005,303 | $ 74,090 | $ 3,869,055 |
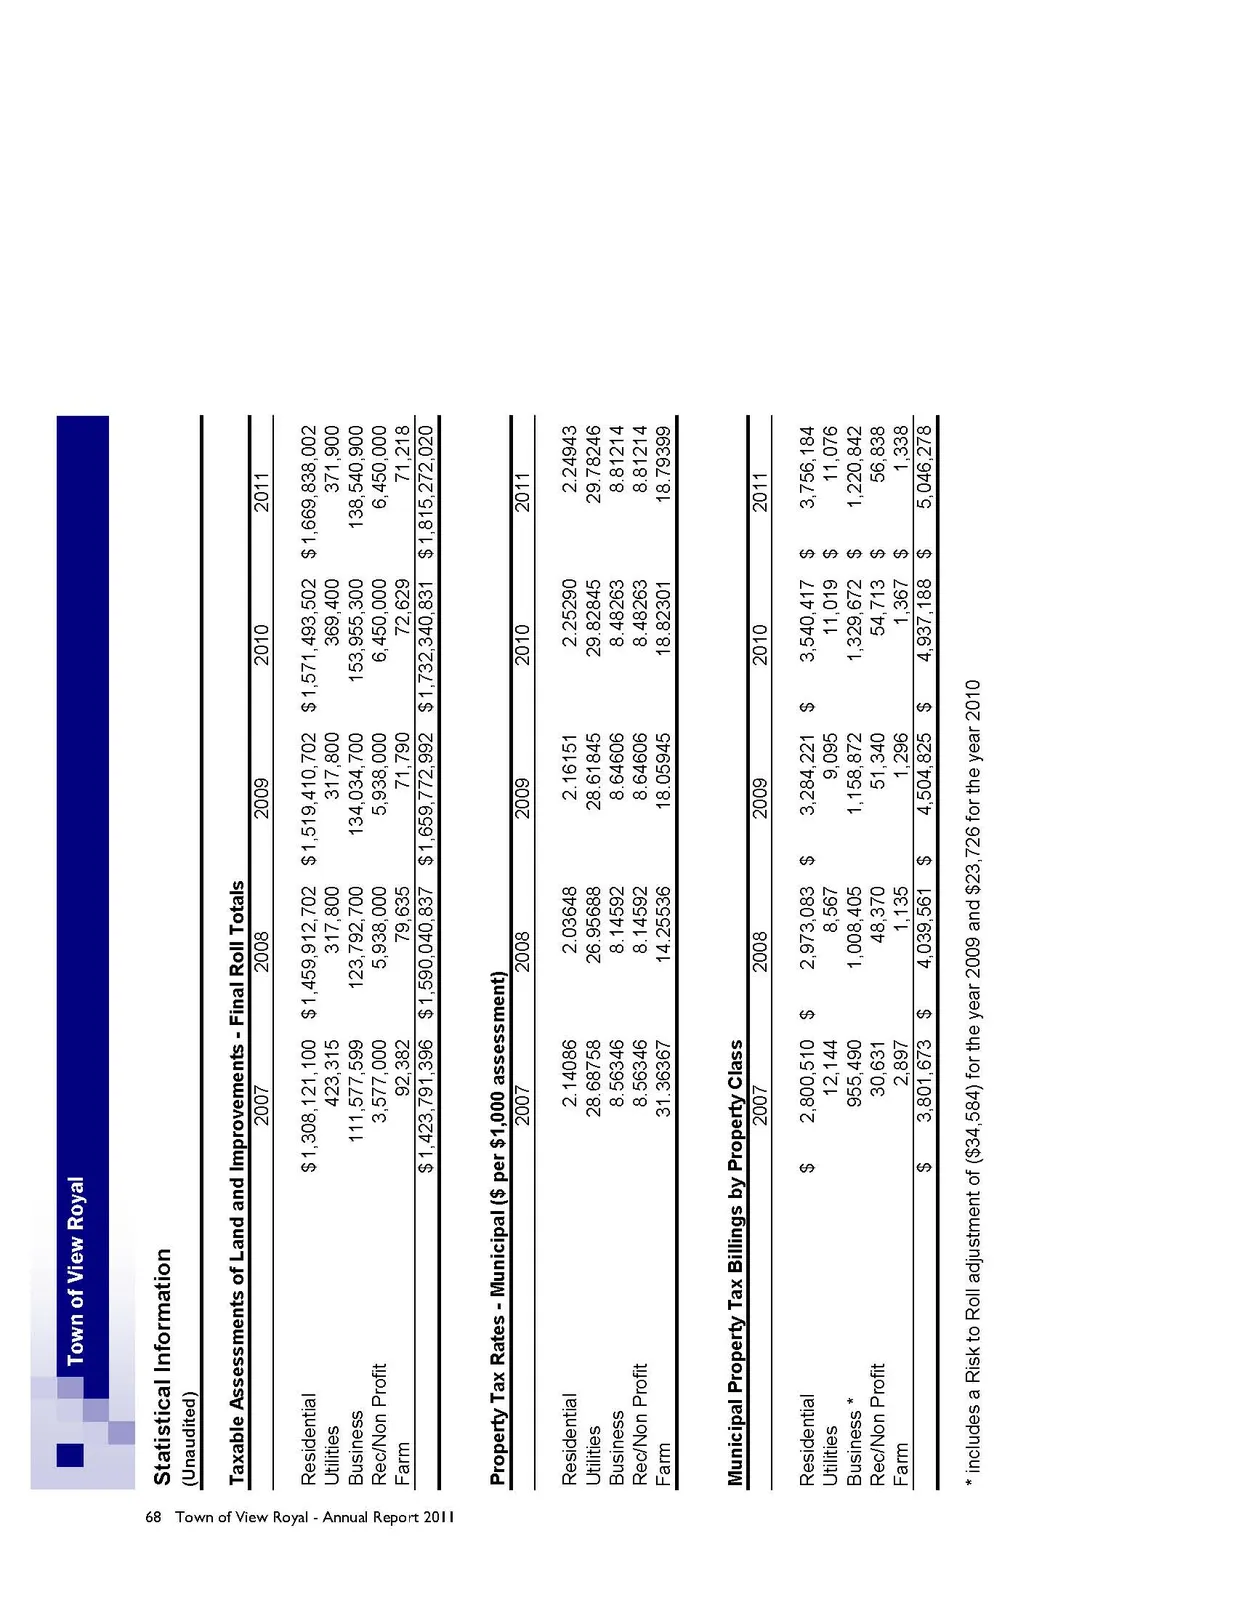
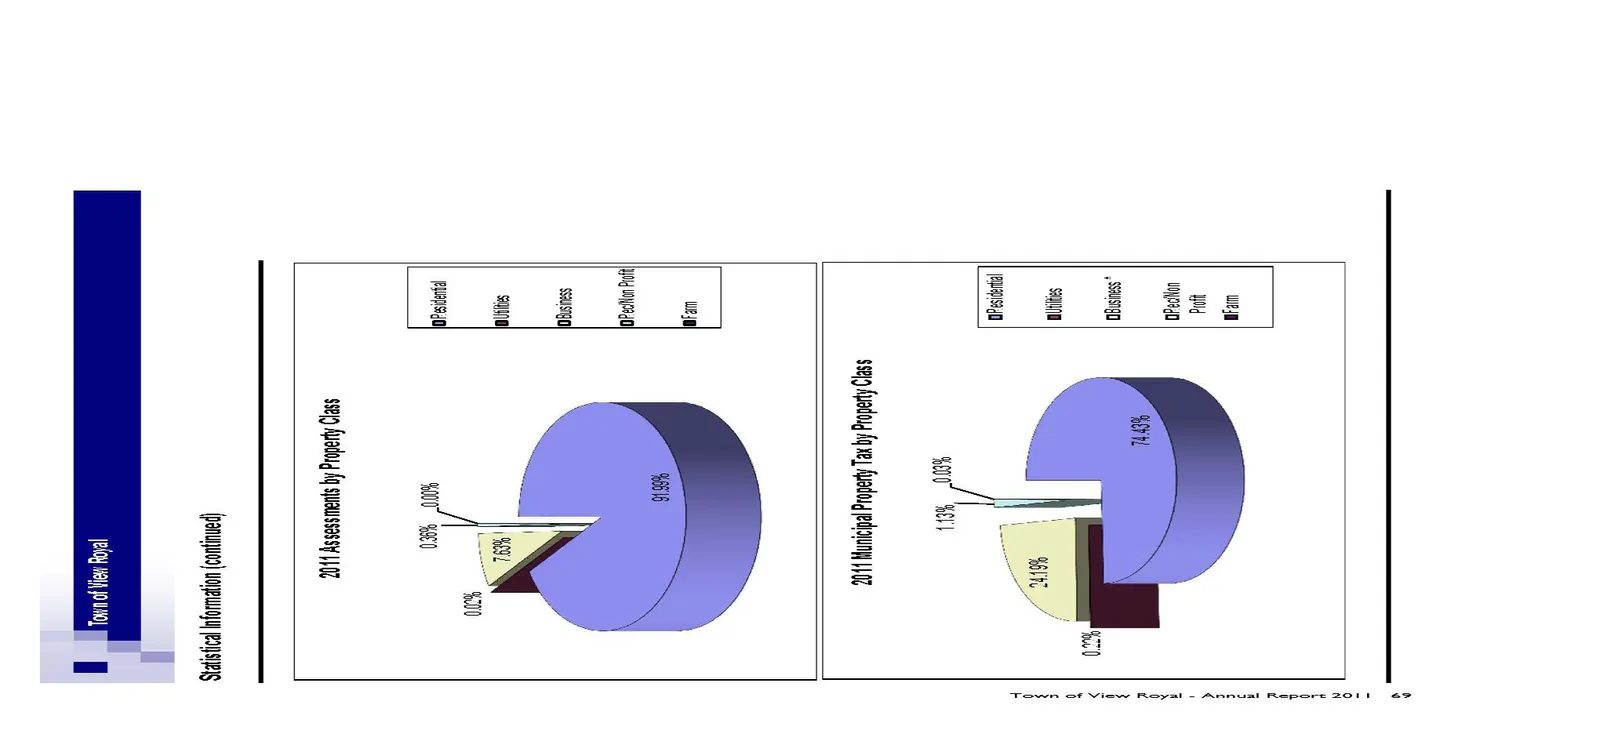
Statistical Information (Unaudited)
Taxable Assessments of Land and Improvements - Final Roll Totals
| 2007 | 2008 | 2009 | 2010 | 2011 | |
|---|---|---|---|---|---|
| Residential | $ 1,308,121,100 | $ 1,459,912,702 | $ 1,519,410,702 | $ 1,571,493,502 | $ 1,669,838,002 |
| Utilities | 423,315 | 317,800 | 317,800 | 369,400 | 371,900 |
| Business | 111,577,599 | 123,792,700 | 134,034,700 | 153,955,300 | 138,540,900 |
| Rec/Non Profit | 3,577,000 | 5,938,000 | 5,938,000 | 6,450,000 | 6,450,000 |
| Farm | 92,382 | 79,635 | 71,790 | 72,629 | 71,218 |
| $ 1,423,791,396 | $ 1,590,040,837 | $ 1,659,772,992 | $ 1,732,340,831 | $ 1,815,272,020 |
Property Tax Rates - Municipal ($ per $1,000 assessment)
| 2007 | 2008 | 2009 | 2010 | 2011 | |
|---|---|---|---|---|---|
| Residential | 2.14086 | 2.03648 | 2.16151 | 2.25290 | 2.24943 |
| Utilities | 28.68758 | 26.95688 | 28.61845 | 29.82845 | 29.78246 |
| Business | 8.56346 | 8.14592 | 8.64606 | 8.48263 | 8.81214 |
| Rec/Non Profit | 8.56346 | 8.14592 | 8.64606 | 8.48263 | 8.81214 |
| Farm | 31.36367 | 14.25536 | 18.05945 | 18.82301 | 18.79399 |
Municipal Property Tax Billings by Property Class
| 2007 | 2008 | 2009 | 2010 | 2011 | |
|---|---|---|---|---|---|
| Residential | $ 2,800,510 | $ 2,973,083 | $ 3,284,221 | $ 3,540,417 | $ 3,756,184 |
| Utilities | 12,144 | 8,567 | 9,095 | 11,019 | 11,076 |
| Business * | 955,490 | 1,008,405 | 1,158,872 | 1,329,672 | 1,220,842 |
| Rec/Non Profit | 30,631 | 48,370 | 51,340 | 54,713 | 56,838 |
| Farm | 2,897 | 1,135 | 1,296 | 1,367 | 1,338 |
| $ 3,801,673 | $ 4,039,561 | $ 4,504,825 | $ 4,937,188 | $ 5,046,278 |
- includes a Risk to Roll adjustment of ($34,584) for the year 2009 and $23,726 for the year 2010
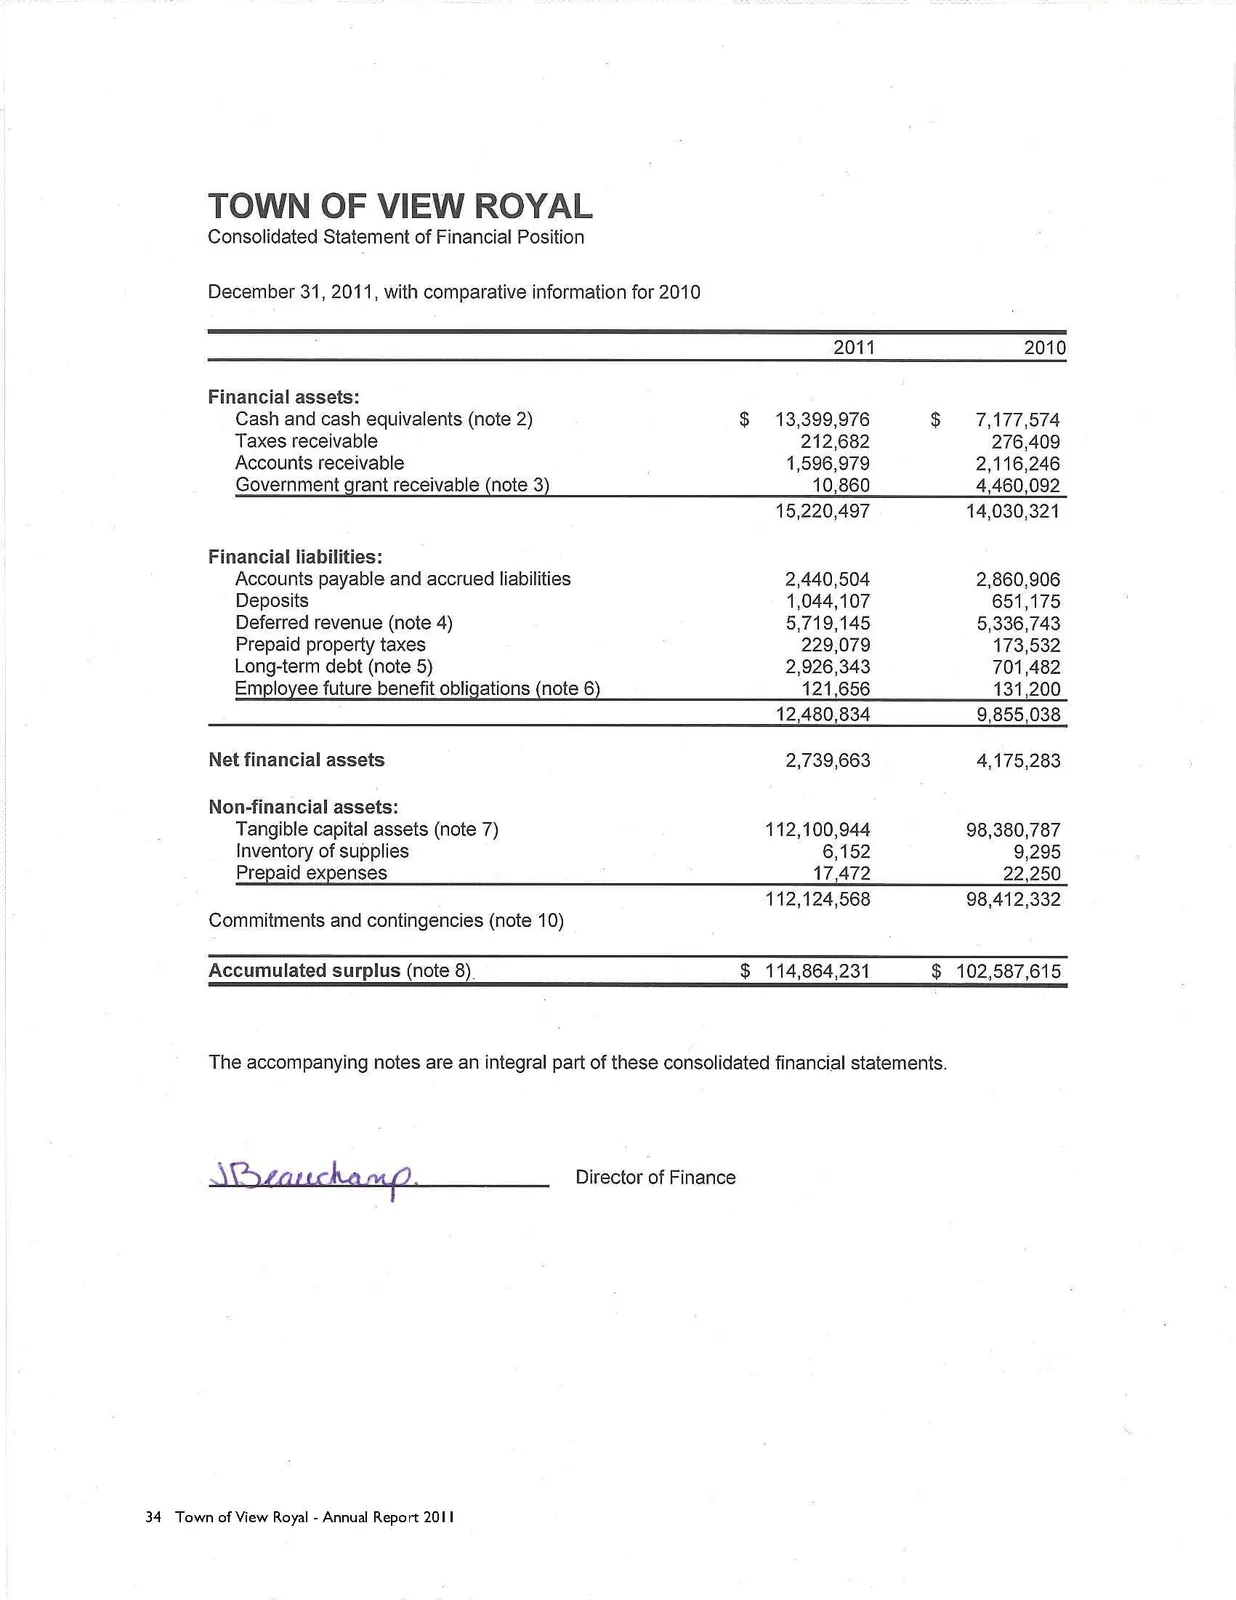
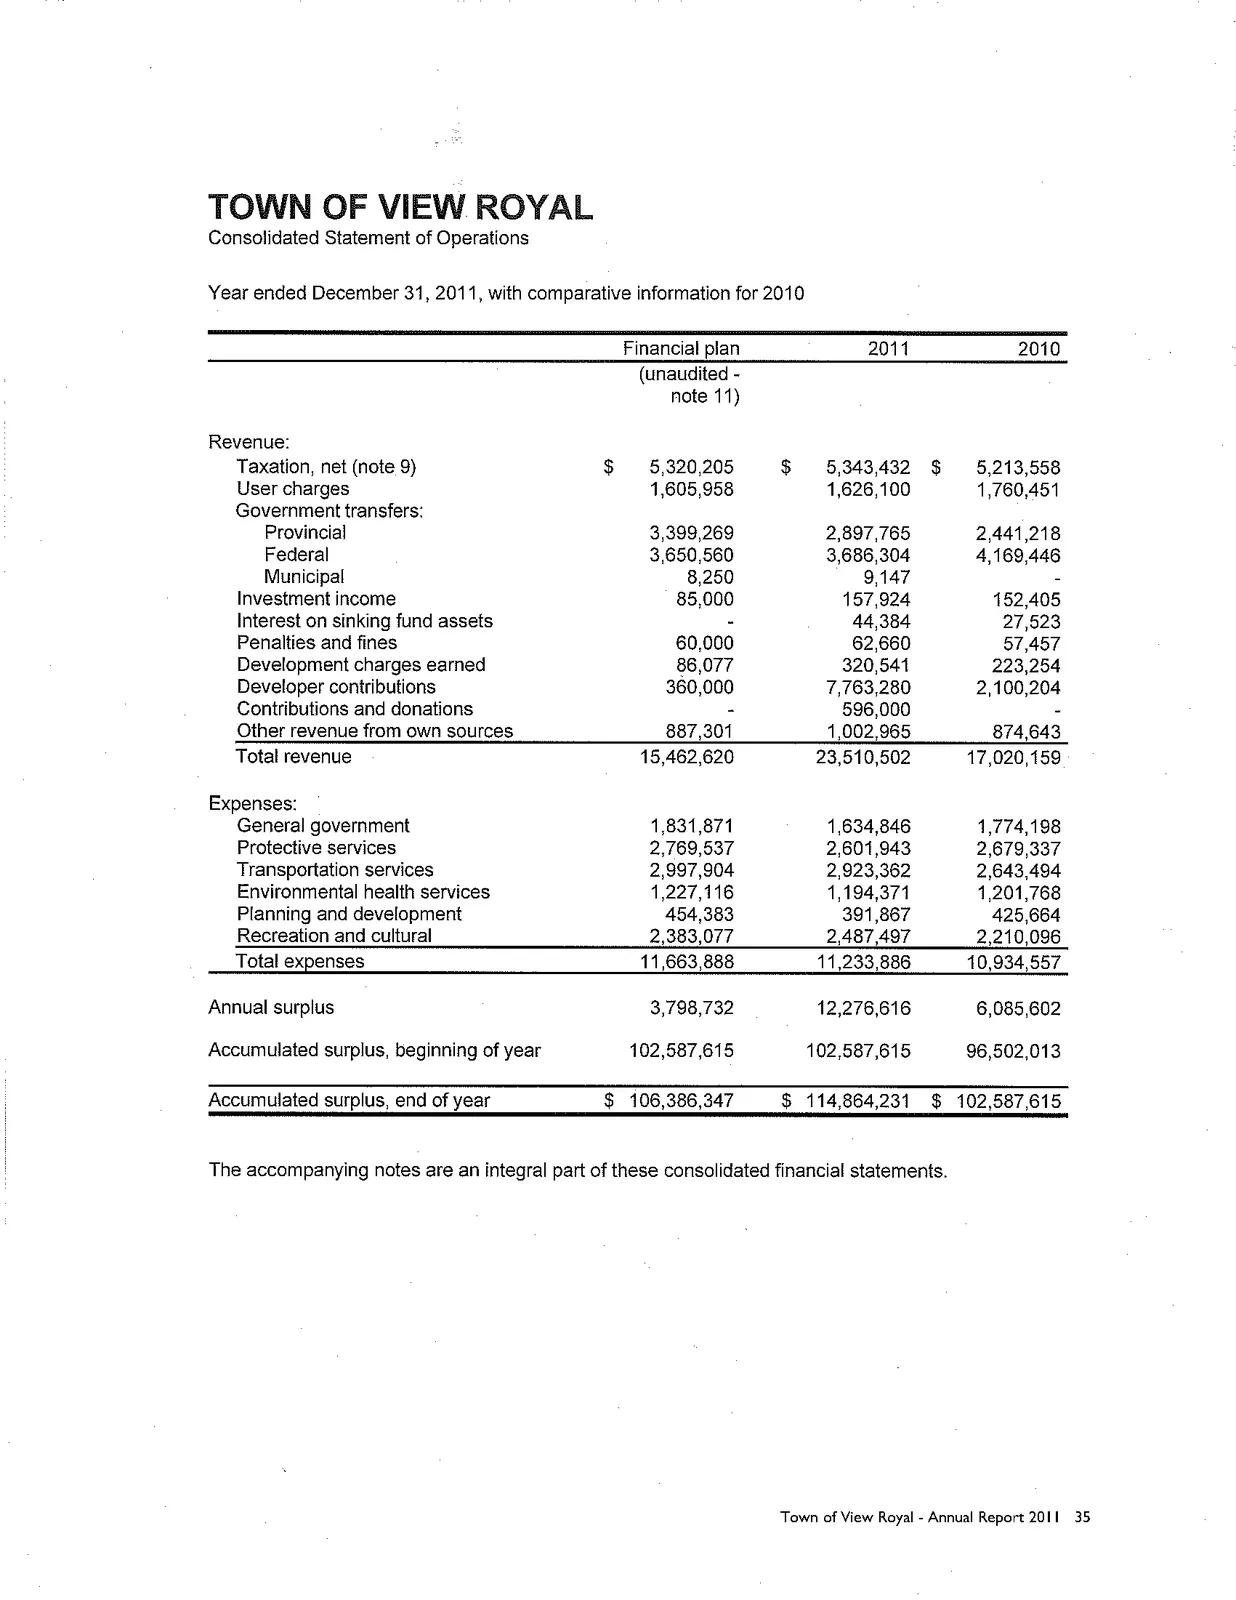
Long Term Debt and Capital Lease Obligations (Unaudited)
| 2011 | 2010 | 2009 | 2008 | 2007 | |
|---|---|---|---|---|---|
| Long-term debt | |||||
| General - transportation services | $ 804,937 | $ 615,382 | $ 804,937 | $ 987,201 | $ 1,162,455 |
| Consolidated entity debt | 63,098 | 86,100 | - | - | - |
| 868,035 | 701,482 | 804,937 | 987,201 | 1,162,455 | |
| Capital lease obligation | |||||
| General - protective services | - | - | 35,841 | 101,067 | 159,740 |
| Total Long Term Debt and Capital Lease Obligations | 868,035 | 701,482 | 840,778 | 1,088,268 | 1,322,195 |
| Population (BC Stats Estimates 2007 to 2011) | 9,838 | 9,743 | 9,596 | 9,355 | 9,171 |
| Debt per capita | $ 88 | $ 72 | $ 88 | $ 116 | $ 144 |
Principal Corporate Taxpayers (Unaudited)
| Registered Owner | Primary Property | Total 2011 General Municipal Taxes Levied |
|---|---|---|
| Admirals Walk Properties Ltd Inc | Admirals Walk | $192,307 |
| Great Canadian Casinos Inc | View Royal Casino | 149,366 |
| Canadian Tire Real Estate Ltd | Canadian Tire | 106,424 |
| West Shore U-Lock Mini Storage Ltd | U-Lock Mini Storage | 75,696 |
| Goodwill Investments Ltd | Fort Victoria | 73,304 |
| Adams Storage Ltd | Adams Storage | 64,386 |
| Boardwalk Equities (BC) Inc | Spruce Apartments | 59,169 |
| 535167 BC Ltd | Nelson Square Shopping Centre | 50,608 |
| 0848052 BC Ltd | Thetis Cove | 50,197 |
| Helmcken Meadows Apts Ltd | Helmcken Meadows Apartments | 44,541 |
| Total Tax Contributions from Top 10 Corporate Taxpayers | $865,999 | |
| Total General Municipal Tax | $5,034,913 | |
| Proportion of municipal tax paid by top ten | 17.2% |
Strategic Community Investment Funds Plan and Progress Report
(1) SCI Funds received or anticipated
| Strategic Community Investment Funds | Use | Date | Amount |
|---|---|---|---|
| SC Grants | local government services | April 2011 | $222,889 |
| June 2011 | $320,721 | ||
| TFRS Grants | Defray the cost of local police enforcement | April 2011 | $31,679 |
| June 2011 | $50,325 |
(2) SCI Funds intended use, performance targets and progress made:
Small Community or Regional District Portion of the SCI Funds
| Intended Use | Performance Targets | Progress made in first reporting period |
|---|---|---|
| Use funding to support local government services to avoid tax rate increases. | Minimize tax rate increases | Moderate tax rate increases were needed due to loss of taxation revenue as a result of reduced Casino revenue, and to meet financial sustainability targets in Councils Revenue Policy. |
Traffic Fine Revenue Sharing Portion of the SCI Funds
| Intended Use | Performance Targets | Progress made in first reporting period |
|---|---|---|
| Funding used to support police enforcement. | 100% of Funds used to support integrated police units in the Greater Victoria Region. | Funds maintained: View Royals participation in the Greater Victoria Integrated Regional Crime Unit, Crises Response Team & Youth Services, and Community policing in View Royal. |
Report Date: July 10, 2012
Document Images
(44)
Welcome to View Royal sign with stone wall and landscaping
Mayor Hill with the Simmons Family at a View Royal Casino event

Portrait of Councillor John Rogers

Portrait of Councillor David Screech

Flowchart showing the organizational structure of the Town of View Royal. The Mayor & Council oversee the Chief Administrative Officer. The CAO manages an Executive Assistant and various department directors including: Director of Corporate Administration, Director of Development Services, Director of Engineering, Director of Finance, and the Fire Chief. Each department has several subordinate positions listed.

Header image showing a scenic view of a forested coastline with calm water
Photo of a children's playground in a residential area
Photo of a public transit bus on a road