9 Erskine Lane Traffic Impact Assessment
A technical report assessing the traffic impacts of a proposed 336-unit residential development at 9 Erskine Lane, including trip generation forecasts and intersection performance analysis.
On an arterial roadway the main way to impact vehicle speeds and calm traffic is to change the road cross section to introduce more urban elements (such as sidewalks, medians, and landscaping) to visually narrow the roadway, along with physical narrowing of the lanes (to 3.3m) as well as added density (increased natural surveillance). The Town has a DCC project for this section of Watkiss Way that includes narrowed lanes, medians with landscaping, and sidewalk. With the development there is an opportunity to narrow the lanes along the development frontage on Watkiss Way.
The short length of Erskine Lane and the lack of connection to other roadways reduces the potential need for traffic calming on Erskine Lane itself, since motorists on the street have limited distance to speed.
2.3 Transit Network
2.3.1 Existing Transit Network
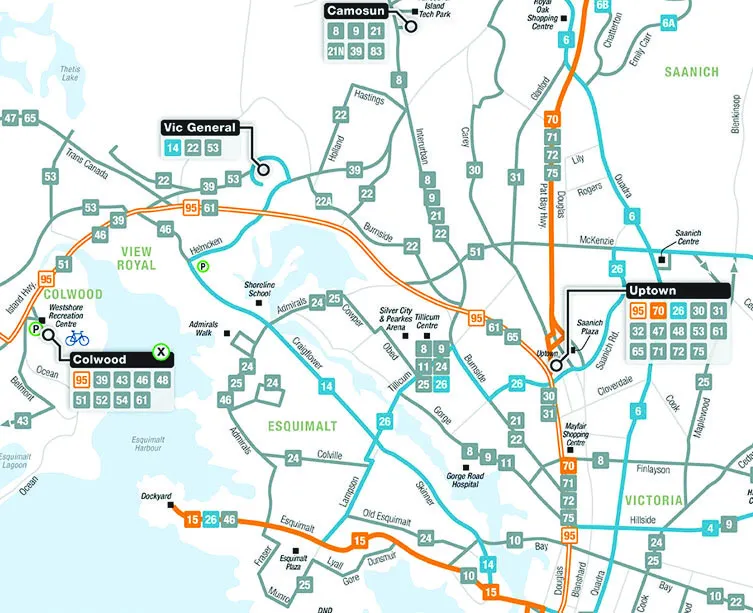
The area transit network is illustrated in Figure 3.
Route 14 – Vic General / UVic operates between the University of Victoria and the Victoria General Hospital, passing by the Oak Bay Junction. The closest stop is approximately 400 metres (i.e., a 5-minute walk) from the site at Hospital Way at Watkiss Way or the Victoria General Hospital stop. Buses operate at 15-to-30-minute headways on weekdays and Saturdays, and 20-to-30-minute headways on Sundays.
Route 22 – Vic General / Hillside Centre operates between the Hillside Mall and the Victoria General Hospital, passing the Tillicum Mall. The closest stop is approximately 190 metres (i.e., a 3-minute walk) from the site at Watkiss Way at Stoneridge. Buses operate at 20-to-30-minute headways on weekdays, and 30-to-45-minute headways on weekends.
Route 39 – Westhills / Interurban / Royal Oak / UVic generally operates in an east-west direction between Westhills Exchange and the University of Victoria, passing by the Colwood Exchange, Camosun College Interurban Campus, and the Royal Oak Exchange. The closest stop is approximately 190 metres (i.e., a 3-minute walk) from the site at Watkiss Way at Stoneridge. Near the site, buses operate at 30-to-60-minute headways on weekdays only.
Route 53 – Victoria General Hospital / Langford Exchange generally operates in an east-west direction between the Lanford Exchange and Victoria General Hospital. The closest stop is approximately 190 metres (i.e., a 3-minute walk) from the site at Watkiss Way at Stoneridge. Buses operate at 40-to-90-minute headways on weekdays and 90 minutes to 2-hour headways on weekends.
Route 95 –Langford / Downton RAPIDBUS generally operates in an east-west direction between the Lanford Exchange and the Legislature downtown Victoria, passing the Colwood Exchange. The closest stop is approximately 350 metres (i.e., a 4-minute walk) from the Watkiss Way at Helmcken bus stop at Highway 1 at Helmcken. Residents can take bus 14, 22, or 39 bus for one stop (approximately 1-min) to reach the Watkiss way at Helmcken bus stop. Buses operate at 8-to-30-minute headways on weekdays, 15-to-30-minute headways on weekends.
The Highway 1 at Helmcken bus stop provides access to routes 44, 47, 48, 51, 61, 65, 66, 95, and 99.
Figure 3 – Existing Transit Network
2.3.2 Evolving Transit Network
BC Transit is collaborating with municipal, regional, and provincial partners to develop the Victoria Regional RapidBus Implementation Strategy. RapidBus routes are planned to operate two-ways, 18-20 hours per day, 7 days a week. Phase 1 is complete and includes the Westshore Line which runs from Langford to Victoria’s Downtown Core.
2.4 Cycling Network
2.4.1 Existing Cycling Network
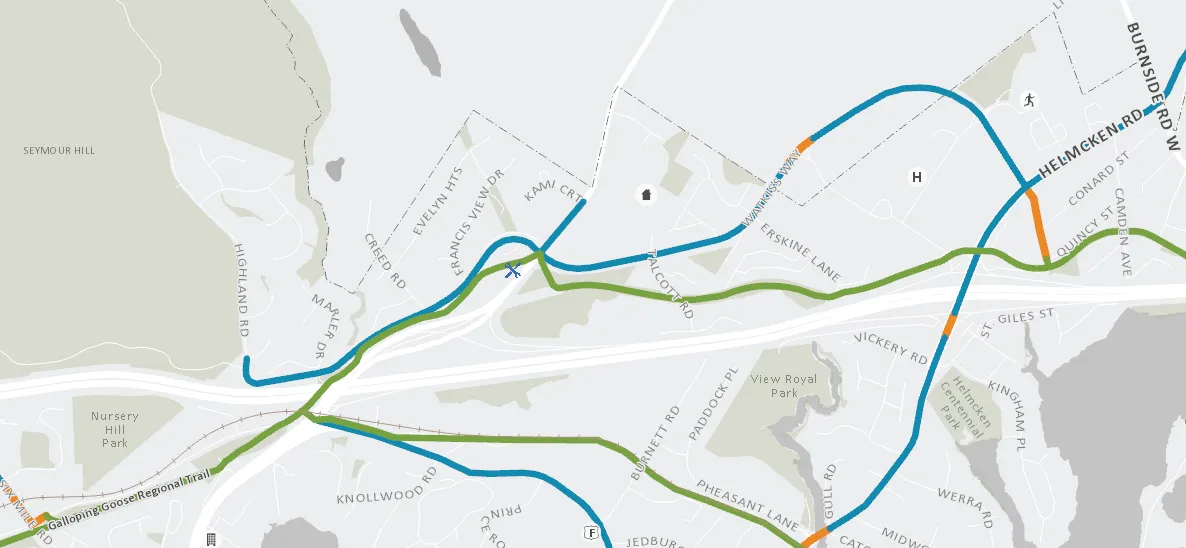
The site currently has good cycling facilities in its immediate vicinity. Island Highway, Helmcken Road, and Watkiss Way have on-street bike lanes. Watkiss Way connects to Galloping Goose Regional Trail via Erskine Lane, and at Watkiss Way / Burnside Road W, and the Galloping Goose has a connection to the E&N Rail Trail at Island Highway. Shared streets are available on Chancellor Avenue. These facilities provide access to a variety of commercial and employment destinations in the area, as well as the Galloping Goose Regional Trail and the E&N Rail Trail, which provide connections for cyclists across the Greater Victoria Area as a whole. The area cycling network is illustrated in Figure 4.
Figure 4: Existing Cycling Network
2.4.2 Evolving Cycling Network
Via the Active Transportation Network Plan The Town of View Royal has plans to install unidirectional bike lanes on both sides of Chancellor Avenue to improve the connection to the Galloping Goose Regional Trail and Eagle Creek Village. Helmcken Road (Watkiss Way to Burnside Rd) will have protected bike lanes installed on both sides to allow for a better connection to Eagle Creek Village, and Watkiss Way will have protected bike lanes installed from Helmcken Road to the roundabout.
The design of the cycling facilities on the Erskine Lane are expected to be upgraded, likely into a multi-use path.
2.5 Pedestrian Environment
2.5.1 Existing Pedestrian Network
Pedestrian infrastructure around the site is good but incomplete. Watkiss Way has a disjointed sidewalk network. In the more developed sections of Watkiss Way (e.g., by Helmcken Road and Hospital Access) there is sidewalk on both sides of the street. Erskine Lane and Stoneridge Drive have no sidewalks on either side of the street.
The site benefits from proximity to two off-street multi-use pathways (i.e., Hospital trail & Galloping Goose Trail) that offer connections to all the key amenities in the neighbourhood, such as access to the Watkiss Way transit stops, the Victoria General Hospital and the Eagle Creek Village commercial area. The Hospital trail is a worn gravel pathway, over a CRD utility right-of-way, that can be utilized by pedestrians.
2.5.2 Evolving Pedestrian Network
The Town of View Royal has plans to install sidewalks on the west side of Chancellor Avenue as part of the Active Transportation Network Plan. Helmcken Road (Watkiss Way to Burnside Rd) will have sidewalks installed on both sides of the road, and the roundabout at Watkiss Way / Hospital Access will have the sidewalks widened to improve pedestrian comfort.
The proposed development will add pedestrian improvements on its Erskine Lane and Watkiss Way frontage, which will provide connections to the existing bus stop along with the Hospital trail and Galloping Goose.
2.6 Area Travel Characteristics
2.6.1 Existing Area Travel Characteristics
The 2017 CRD Household Travel Survey provides information on area travel characteristics for southern Vancouver Island. Table 1 outlines the mode share for the area.
Table 1 – Existing Mode Share
| Mode | AM Peak | PM Peak |
|---|---|---|
| Auto Driver | 55% | 54% |
| Auto Passenger | 12% | 14% |
| Transit | 12% | 12% |
| Bicycle | 9% | 8% |
| Walk | 10% | 10% |
| Other | 1% | 1% |
Notes:
- Based on 2017 CRD Household Travel Survey data for District 13 – Town of View Royal, Esquimalt Nation, Songhees First Nation
- Travel mode split calculation based on overall number of trips to, from, and within district.
3.0 DEVELOPMENT PROPOSAL
The proposed development will consist of 336 dwelling units in four mid-rise buildings (6 stories). Table 2 outlines the development programme and transportation-related elements of the proposed site plan. The architectural site plan is provided in Appendix A.
Table 2 - Development Proposal
| Site Element | Details |
|---|---|
| Residential Units | 336 units |
| Vehicular Parking Supply | 454 spaces |
| Vehicular Access | Residential access to above ground and parkade parking is provided from Erskine Lane. |
| Pedestrian Access | Pedestrian access to the residential lobby is provided through the parking lot of each building which is accessed from Erskine Lane. |
3.1 Site Access
The site has 3 accesses on Erskine Lane. Pedestrians and cyclists have the option to use the connection to Galloping Goose Trail at the south end of Erskine Lane to walk/bike to the site. There is a trail passing through the site that connects Erskine Lane to the Victoria General Hospital.
3.1.1 Corner Clearance
The access closest to Watkiss Way is 55m south of Watkiss Way, exceeding the TAC’s minimum corner clearance of 15m for local roads from a stop-controlled major intersection. Therefore, the location of the driveway access is appropriate. The spacing between the driveways exceeds 5m and therefore is also appropriate.
3.1.2 Sight Distance
The sight distance at all the proposed accesses on Erskine Lane were reviewed to ensure sufficient sight distance is available for motorists turning into and out of the site. Erskine Lane has a posted 30 km/h speed limit.
Sight distances are met for all three accesses.
The access located north of the Hospital trail (Access 1), the measured sight distance to the right (north) is 50m which does not meet the required intersection sight distance (65m) for left turns from stop for 30 km/h. However, there is no reason for vehicles to turn left out of the site as a left turn would take drivers to a dead-end. If a rare vehicle turns left the approaching vehicle on Erskine Lane has sufficient sight distance to stop or slow for a turning vehicle. A summary of sight distances for Access 1 for buildings A & B at 30 km/h is provided in Table 3. Sight distances are met for the accesses located south of the hospital trail.
Table 3 – Sight Distances at Access 1 (30 km/h)
| Movement | Measured Sight Distance | Required Intersection Sight Distance | Sight Distance Met? |
|---|---|---|---|
| Left Turn from Stop | 100m (looking left) 50m (looking right) |
65m (looking left) 65m (looking right) |
Yes No (NA) |
| Right Turn from Stop | 100m (looking left) | 55m (looking left) | Yes |
| Through Traffic (on Erskine Lane) |
50m+ (southbound) 50m+ (northbound) |
35m (SSD for 30 km/h) 50m (SSD for 40 km/h) |
Yes Yes |
4.0 TRAFFIC VOLUMES
4.1 Traffic Analysis Scenarios and Design Periods
Traffic operations analyses have been undertaken for the weekday morning and afternoon peak hours under the following conditions:
- Existing traffic – traffic activity under current conditions (site is expected to open this year)
- Post-development traffic – traffic activity levels into the future with the site redeveloped and projected site generated traffic added to the road network.
Traffic operations are discussed in the following sections for these scenarios:
- Existing conditions
- 9 Erskine Lane Built Out (2023) post-development conditions
- Horizon Year (2033) post-development conditions
4.2 Corridor Growth Rate
Annual growth rates for traffic along the study area roads were determined by comparing historical traffic volumes along Watkiss Way and Helmcken Road. Based on CRD traffic count data, between 2008 and 2014 the average daily traffic along Watkiss Way grew less than 1% annually, while volumes on Helmcken Road grew 0.2% annually between 2014 and 2019.
There is limited opportunity for additional development on the Watkiss Way corridor, especially given that the lands in the District of Saanich along Watkiss Way are currently in the Agricultural Land Reserve and are unlikely to be developed. The Helmcken Road corridor is currently at or near capacity, with traffic often backed up to the Wilkinson / Interurban intersection; therefore, limited traffic growth (in a one-hour time period) is expected on Helmcken Road. Based on the above, a 0.5% growth rate was used for Helmcken Road, and a 1% growth rate was used on the remaining roads in the study area.
4.3 Concurrent Development Traffic Volumes
Allowances were made to account for new traffic generated by other development proposals in proximity to the proposed site that are either under construction, approved, being reviewed, or in which an application is expected to be submitted to the Town in the near future. There are three (3) residential background developments in the area that have been considered with a total of 221 residential units between them. The last concurrent development is the BC Transit HandyDart facility on the southeast corner of the Burnside Road / Watkiss Way intersection.
Trip generation and traffic assignments for the background developments are based on information contained in the traffic impact assessments for site prepared by WATT, while the HandyDart trip assignment is based on the WSP HandyDart Operations and Maintenance Facility Traffic Impact Study update memo (dated June 2, 2020).
A summary of the considered background developments is provided in Table 4. These volumes are added to the existing traffic in the preceding analysis scenarios.
Table 4 – Concurrent Developments
| Development Address | Development Statistics | Report Source | Trip Generation / Distribution Source |
|---|---|---|---|
| 5 Erskine Lane | 99 Residential Units | WATT Consulting Group | TIA |
| 7 Erskine Lane | 79 Residential Units | WATT Consulting Group | TIA |
| 10 Erskine Lane | 43 Residential Units | WATT Consulting Group | TIA |
| BC Transit HandyDart | 62 two-way AM trips 21 two-way PM trips |
WSP Canada Group Limited | Memo |
4.4 Existing Traffic - Intersection Analysis
Traffic data was taken from previously conducted TIA’s at 10 Erskine Lane, 9 Erskine Lane (previous TIA), and 7 Erskine Lane. The Helmcken Road, Burnside Road, and Hospital Access volumes were adjusted to 2023 using an annual growth rate of 0.5% on Helmcken Road and 1% on all other roads (see 4.2 Corridor Growth Rate). Base existing turning movement volumes were established for intersections within the study area for the weekday morning and afternoon peak periods. Traffic count information adopted as the basis for the traffic operations analysis is summarized in Table 5.
Table 5 – Existing Traffic Count Information
| Intersection | Date of Count | Source |
|---|---|---|
| Watkiss Way / Erskine Lane / Stoneridge Drive | Sept. 8, 2021 | WATT |
| Watkiss Way / Burnside Road W | Nov. 14, 2018 | WATT |
| Watkiss Way / Hospital Access | Nov. 13, 2018 | WATT |
| Watkiss Way / Helmcken Road / Chancellor Avenue | January 20, 2020 | WATT |
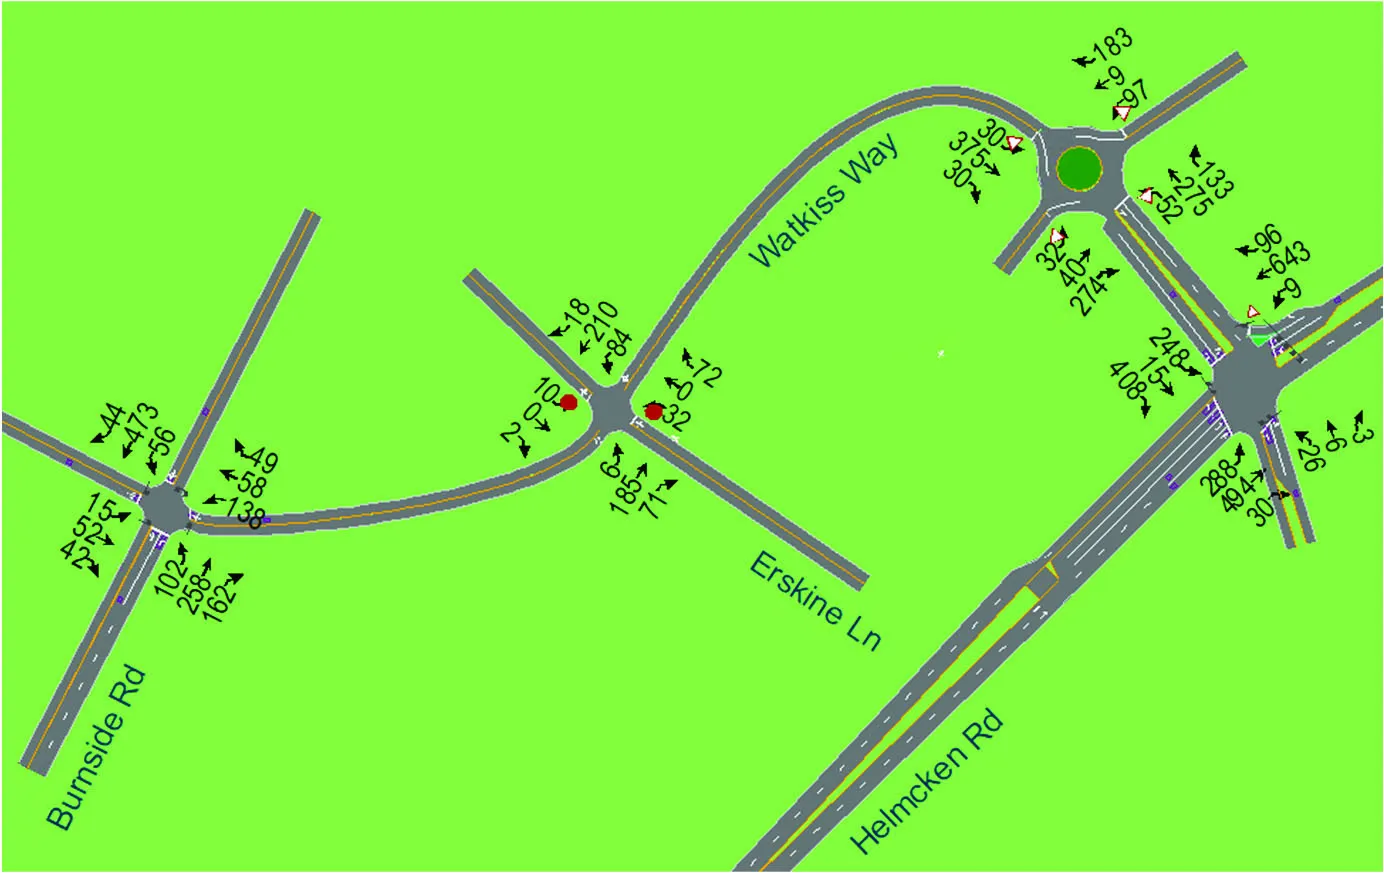
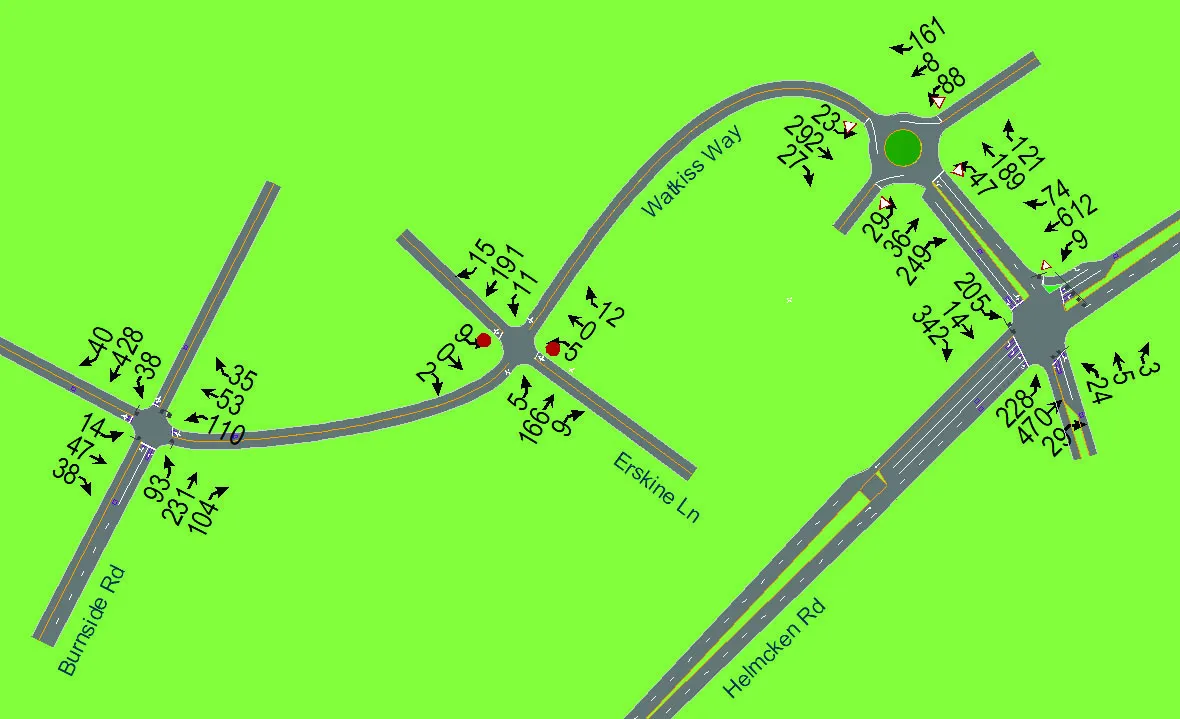
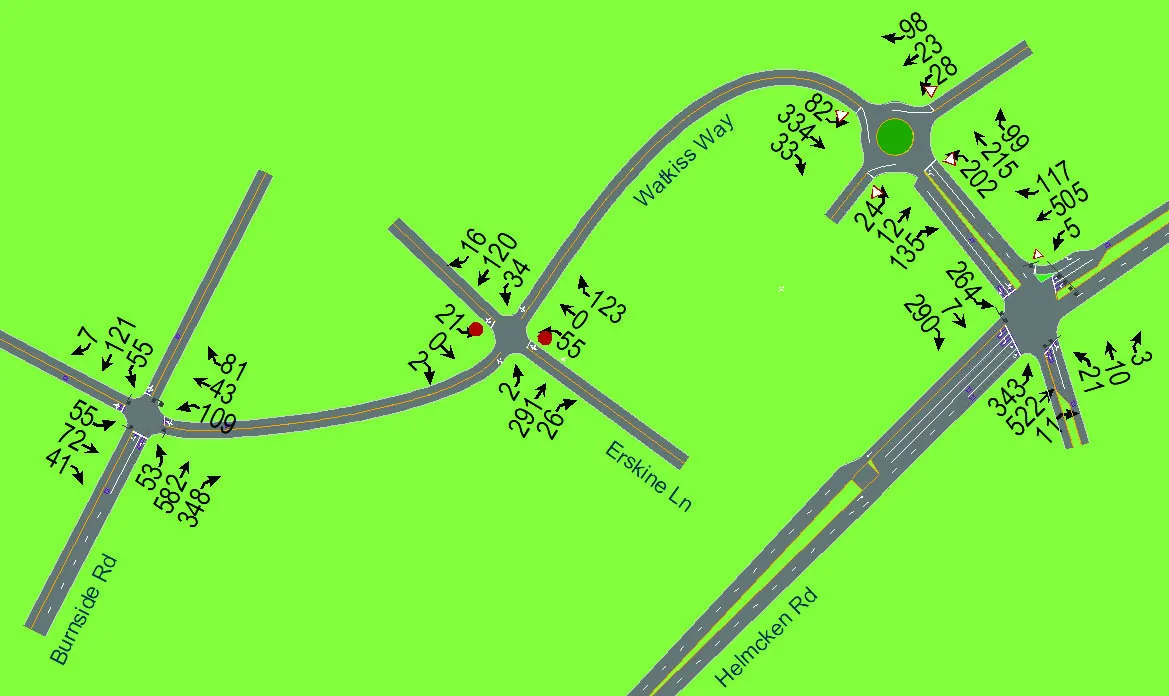
The existing area traffic volumes for the weekday morning and afternoon peak hours are illustrated in Figure 5 and Figure 6.
Figure 5 - Existing Traffic Volumes - AM
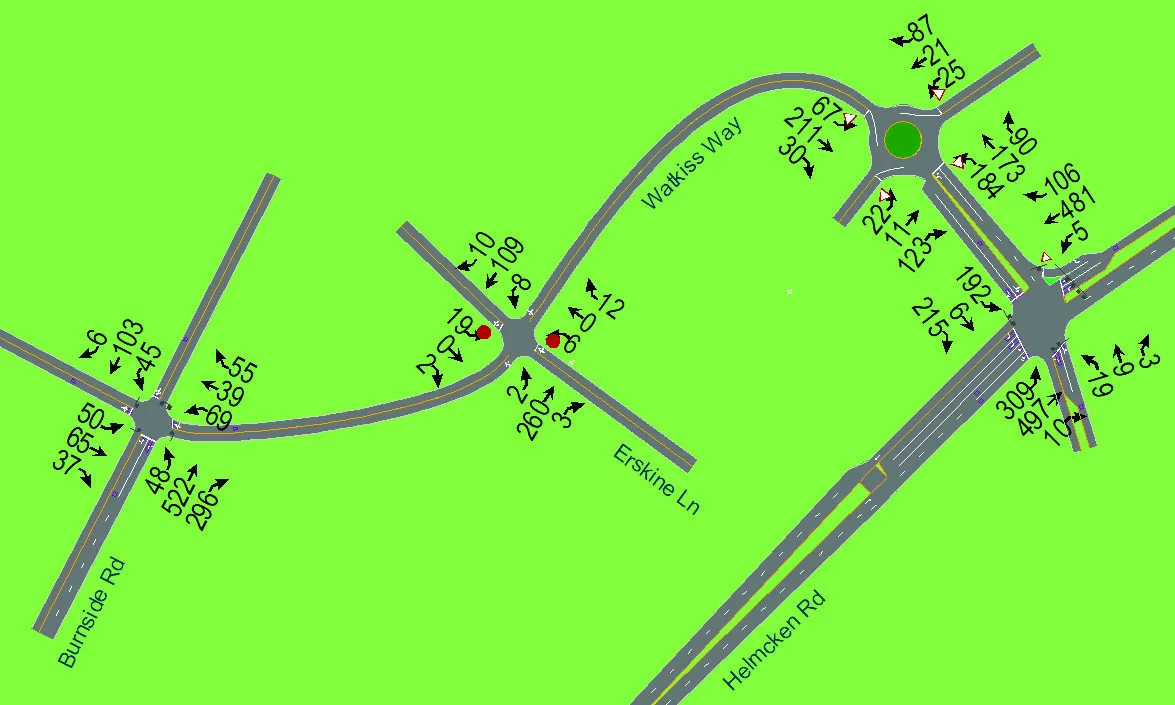
Figure 6 - Existing Traffic Volumes - PM
4.5 New Site Traffic Volumes
4.5.1 New Site Trip Generation
The proposed site includes 336 multi-family residential units. Vehicular trip generation rates for the proposed development are based on the Institute of Transportation Engineers (ITE) Trip Generation Manual (11th Edition). The trip generation forecast is summarized in Table 6.
Table 6 – Vehicle Trip Generation Rates
| ITE Trip Generation Manual 11th Edition Rates | ||||||
|---|---|---|---|---|---|---|
| Land Use | AM | PM | ||||
| In | Out | 2-Way | In | Out | 2-Way | |
| Multifamily Housing (Mid-Rise) (Not Close to Rail Transit) (LU 221)[1] | 0.09 | 0.28 | 0.37 | 0.24 | 0.15 | 0.39 |
| Vehicular Trip Generation | ||||||
| Land Use | AM | PM | ||||
| In | Out | 2-Way | In | Out | 2-Way | |
| Residential (336 units) | 29 | 95 | 124 | 80 | 51 | 131 |
Notes: 1. Trip rates are per dwelling unit
The proposed development is forecast to generate 255 two-way trips in both the weekday morning and afternoon peak hours.
4.5.2 Trip Distribution and Assignment
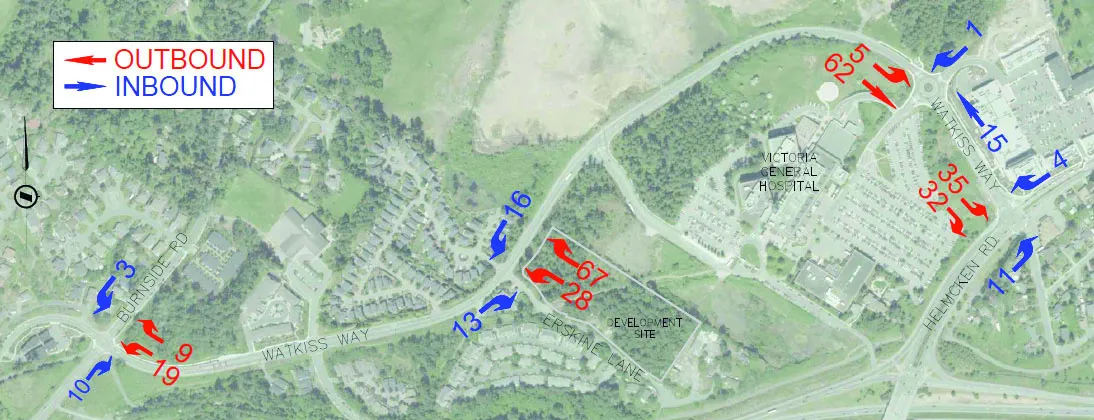
As Erskine Lane dead ends south of the proposed site, all site traffic will use the intersection of Watkiss Way / Erskine Lane. The site trips were assigned based on the existing traffic distributions and consideration of nearby origin / destinations. The distribution of inbound and outbound traffic adopted for the proposed development is outlined in Table 7.
Table 7 – Site Traffic Distribution
| 9 Erskine Lane | |||
|---|---|---|---|
| Inbound | Total Trips (%) | ||
| Street | Direction | AM | PM |
| Helmcken Road | North | 12 | 12 |
| South | 38 | 38 | |
| Burnside Road | North | 10 | 10 |
| South | 35 | 35 | |
| Eagle Creek Village Access | North | 5 | 5 |
| Outbound | Total Trips (%) | ||
| Street | Direction | AM | PM |
| Helmcken Road | North | 34 | 25 |
| South | 31 | 40 | |
| Burnside Road | North | 10 | 10 |
| South | 20 | 20 | |
| Eagle Creek Village Access | North | 5 | 5 |
The site traffic volumes assigned to the area road network are illustrated in Figure 7 and Figure 8.
Figure 7 - AM Trip Assignment – 9 Erskine Lane
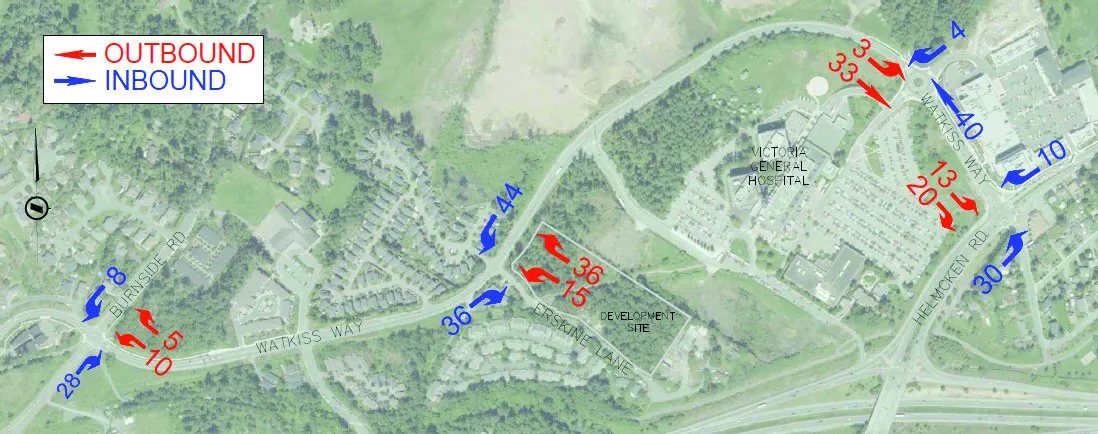
Figure 8 - PM Trip Assignment – 9 Erskine Lane
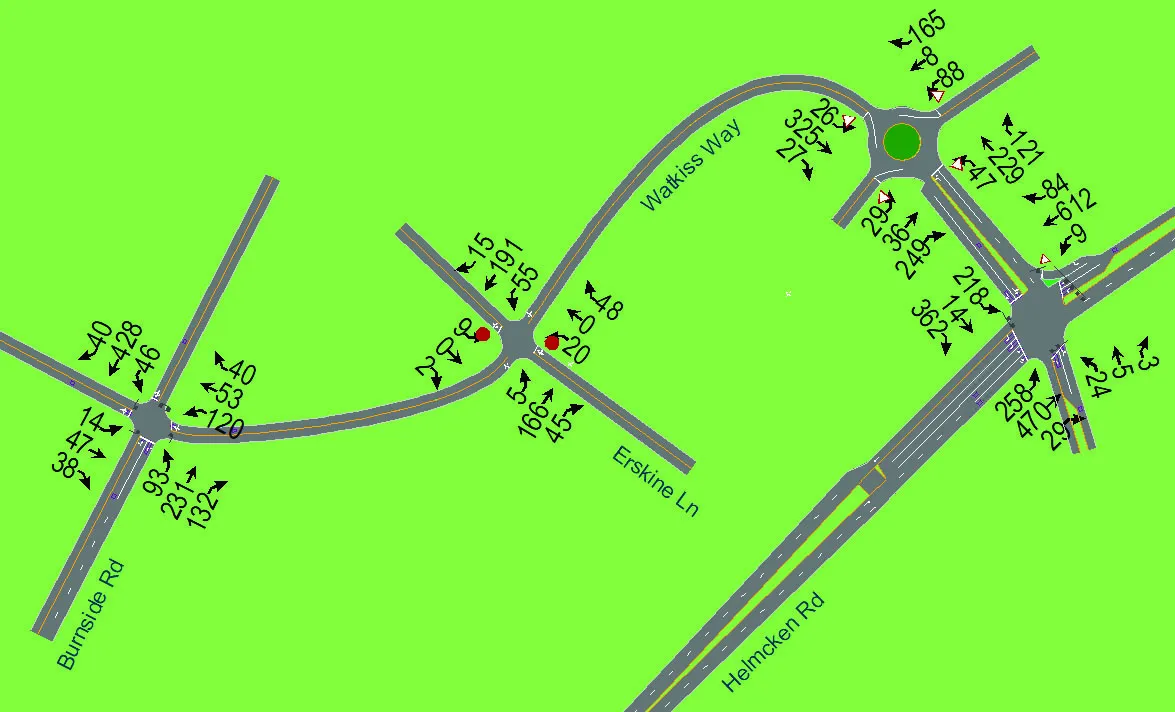
4.6 2023 Post-Development Traffic Volumes
Post-development volumes include the existing 2023 traffic (including the concurrent developments and corridor growth), and the site trips for 9 Erskine Lane. The existing and 9 Erskine Lane traffic volumes are illustrated in Figure 9 and Figure 10.
Figure 9 - Existing and 9 Erskine Lane Traffic Volumes – AM
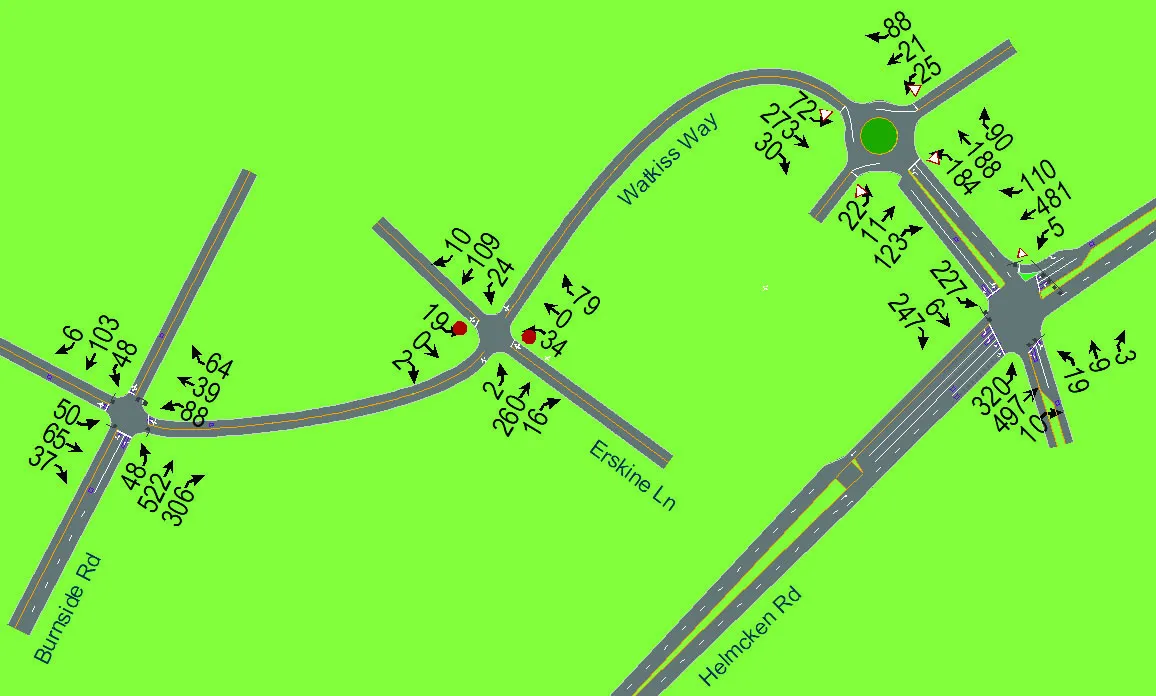
Figure 10 - Existing and 9 Erskine Lane Traffic Volumes – PM
4.7 Background Horizon Year 2033 Traffic Volumes
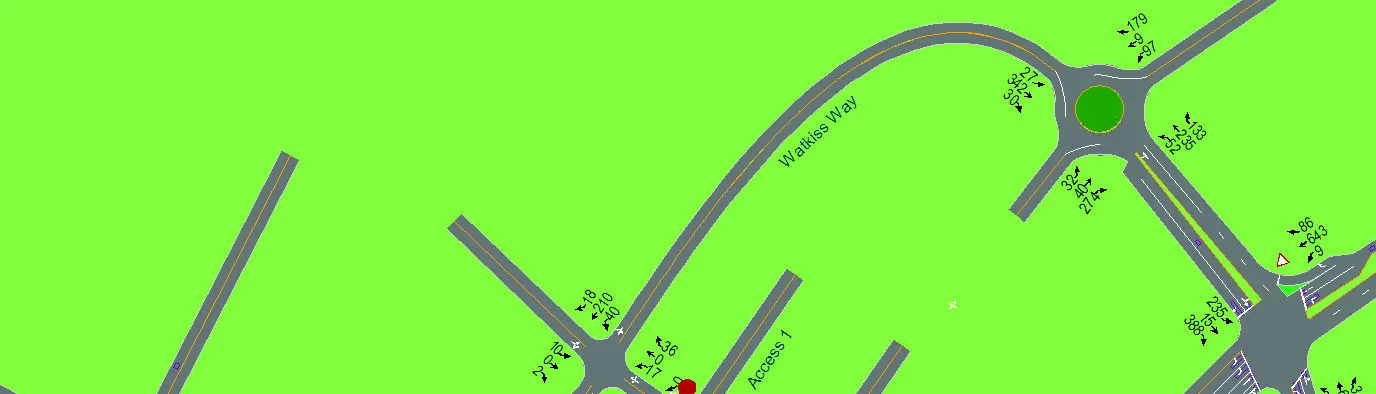
Background horizon year 2033 traffic volumes are the sum of the existing traffic volumes, concurrent developments, and corridor growth. Background horizon year 2033 traffic volumes are illustrated in Figure 11 and Figure 12.
Figure 11 – Background 2033 Traffic Volumes – AM
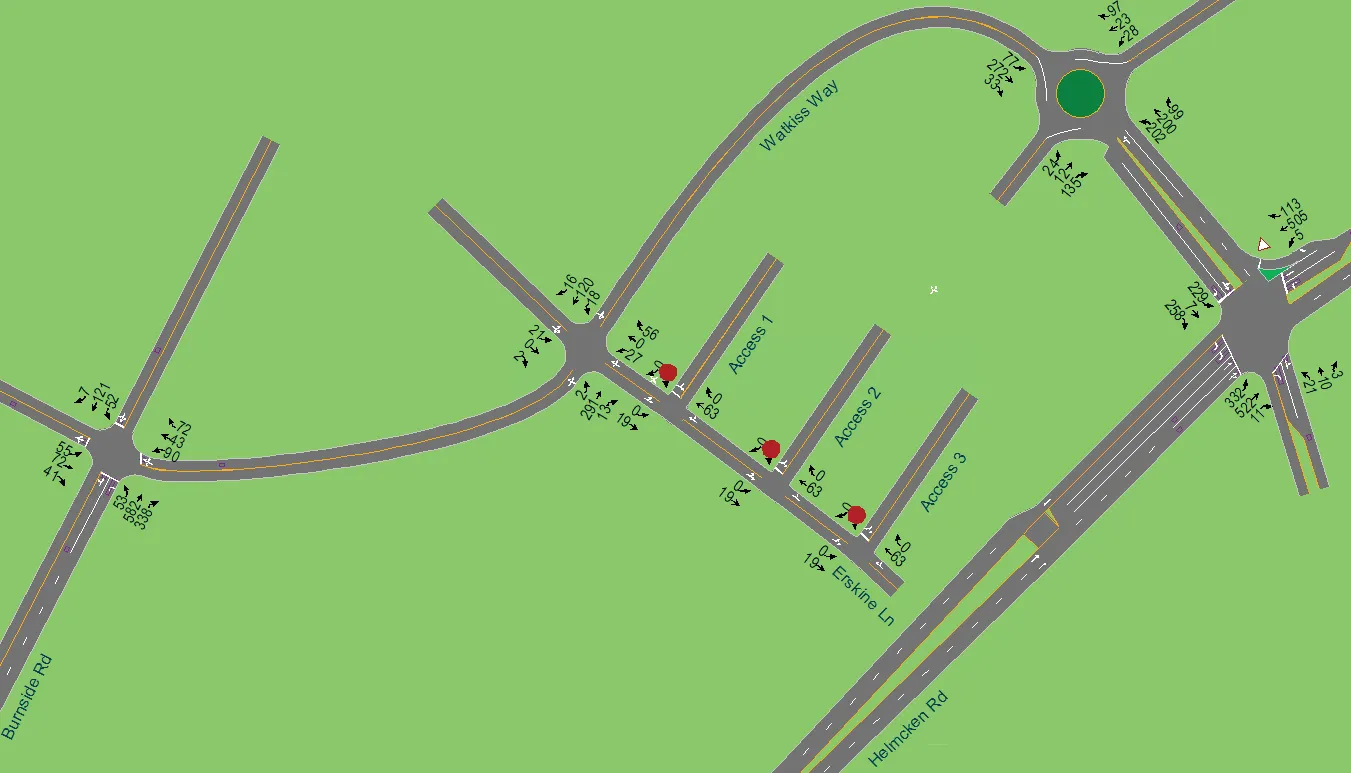
Figure 12 – Background 2033 Traffic Volumes – PM
4.8 Full Build Out Post-Development Horizon Year 2033 Traffic Volumes
In order to determine the long-term impact of the proposed development, the 10-year full build out conditions were analyzed. Horizon year 2033 traffic volumes are the sum of the existing traffic volumes, corridor growth, concurrent developments, and the new site traffic volumes. Horizon year 2033 traffic volumes are illustrated in Figure 13 and Figure 14.
Figure 13 - Horizon Year 2033 Traffic Volumes - AM
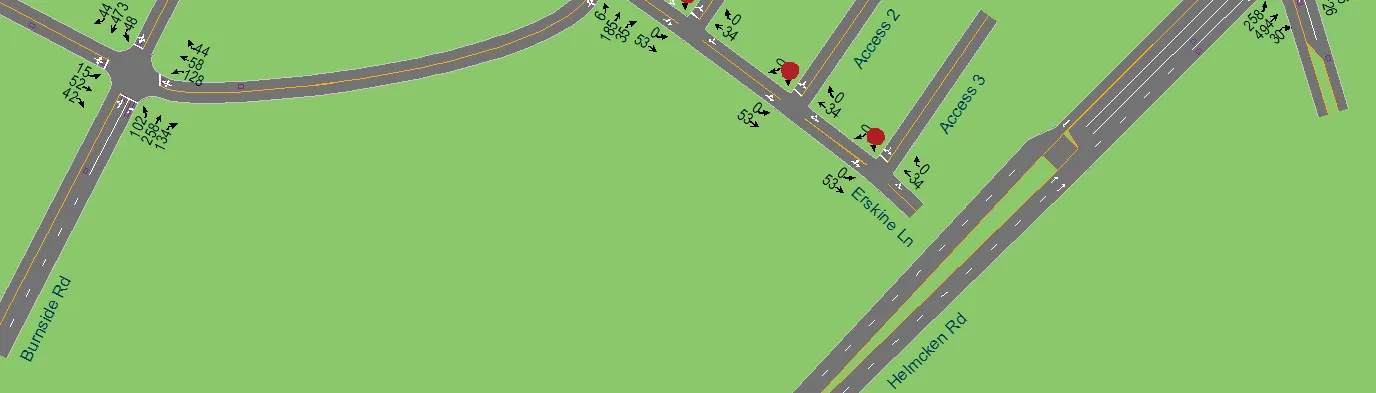
Figure 14 - Horizon Year 2033 Traffic Volumes - PM
5.0 TRANSPORTATION DEMAND MANAGEMENT
Transportation Demand Management (TDM) is the application of strategies and policies to influence the travel choice of an individual, most commonly to reduce single-occupant vehicle travel. TDM measures typically aim to encourage sustainable travel, enhance travel options, and decrease parking demand. The following outlines the TDM measures planned by the developer.
5.1 Electric Bicycles
Electric Bikes (E-bikes) are an emerging transportation phenomenon that are gaining popularity worldwide. With supportive cycling infrastructure in place, E-bikes have the potential to substitute or completely replace almost all trips taken by combustion engine vehicles which can help to address congestion issues and mitigate parking challenges in urban areas. Two barriers facing prospective E-bike users is the lack of secure parking which is critical for minimizing E-bike theft and cost.
The developer is providing two electrical bicycles to be shared by the complex. Access to electrical bicycles allows residents to experience an e-bicycle without having to outlay the costs which can be high. E-bicycles also support longer commuter trips as well as increase the ability to carry heavier grocery items or other goods.
5.2 Secure Bicycle Parking
Research has reported that bicycle parking supply is a determinant of cycling for current and potential cyclists. A lack of bicycle parking and/or inadequate bicycle parking discourages cycling. Higher quality bicycle parking facilities are associated with more bicycle use. Further, more convenient bicycle parking is also associated with more cycling. Convenience includes easy access to bicycles (e.g., short distances between bicycle parking and actual trip origins or destinations).1 Secure bicycle parking could especially benefit the residents of this development, with direct access to the Galloping Goose trail.
1 Heinen, E & R. Buehler. (2019). Bicycle parking: a systematic review of scientific literature on parking behaviour, parking preferences, and their influence on cycling and travel behaviour, Transport Reviews, DOI: 10.1080/01441647.2019.1590477
5.3 Carpooling
An informal rideshare program could be implemented on site that will allow residents to identify if they require a ride or if they can provide a ride. This will be particularly useful for those residents who work in proximity to each other and have similar shifts. An informal program could be implemented internally, with a sign-up sheet in the lobby, or residents can be encouraged to sign up for carpool.ca.
5.4 Carshare
Carsharing is a form of car rental service for the sharing of vehicles for varying lengths of time. Carshares are usually co-operative and require users to register as a member to use vehicles and pay associated fees. An external carshare program could be considered for the site for those residents who may occasionally need access to a vehicle but may not be able to pay the costs associated with vehicle ownership. External carshare programs such as Modo, would not be reserved exclusively for residents at the site, but shared with other Modo members in the area. Although, Modo is not currently operating in View Royal, the developer could facilitate a conversation with Modo Carshare Corporation (the current managing corporation of the carshare program in Victoria) and the Town of View Royal to encourage the program to be expanded to the area. Given the significant population growth in the area (e.g., 5 Erskine Lane, 7 Erskine Lane, 10 Erskine), there may be a growing user base that would benefit from carsharing.
Research has shown that carsharing programs have a significant impact on reducing vehicle ownership, thereby reducing site trips, and lowering parking demand. Currently, there are no Modo vehicles near the site, but the developer is planning to provide two carshare vehicles. At this time, it has not been confirmed if these are going to be shared vehicles for the development or part of Modo.
5.5 TDM Impact on Traffic
This study is based on standard ITE Trip Generation rates and does not account for the potential reduction in vehicle trips due to the planned TDM. The planned TDM along with the proximity / easy access to the Galloping Goose, multiple transit routes heading in all directions, and the Eagle Creek commercial amenities is expected to reduce vehicle trips by at least 10% in the trips generated by this development. This equates to a reduction of 16 vehicles during the peak hours and 55 vehicles per day. Traffic volumes for the study were not adjusted to reflect this, therefore the results of the traffic analysis should be considered minorly conservative.
6.0 TRAFFIC OPERATIONS ANALYSIS
6.1 Methodology
Analysis of the traffic conditions at the intersections within the study area were undertaken using Synchro 11 software (for signalized and stop-controlled intersections).
The delays and type of traffic control are used to determine the LOS. The LOS is broken down into six letter grades with LOS A being excellent operations and LOS F being unstable / failure operations. LOS C is generally considered to be an acceptable LOS by most municipalities. LOS D is generally considered to be on the threshold between acceptable and unacceptable operations. A description of LOS and Synchro is provided in Appendix B. The Synchro reports are provided in Appendix C.
6.2 Input and Calibration Parameters
Heavy Vehicle Assumptions
Heavy and medium truck percentages incorporated into the analysis were based on intersection turning movement counts. Where not available, a default value of 2 percent heavy vehicles was assumed.
Peak Hour Factor
Peak hour factors for each intersection were calculated from the existing traffic count information. Where these values were unavailable, a default peak hour factor of 0.92 was adopted for all movements.
SimTraffic Used for Performance Delay/Vehicle
HCM 6th Edition does not support calculations for combined through/left turn movements, which includes two of the intersections in this study that have that laning. In order for all results to use a consistent methodology SimTraffic results were used to determine performance delay at the study intersections.
6.3 Existing Traffic Operations - 2023
Existing conditions were analyzed based on the collected volumes and existing roadway network. A summary of the traffic analysis results for the current condition of the intersections in the study area is provided in Table 8.
Table 8 – Existing Traffic Operations - 2023
| Key Movement | AM | PM | ||||||
|---|---|---|---|---|---|---|---|---|
| LOS | Delay (s) | 95th % Queue (m) | v/c | LOS | Delay (s) | 95th % Queue (m) | v/c | |
| Watkiss Way / Erskine Lane / Stoneridge Drive (stop-controlled) | ||||||||
| EB | A | 3.6 | 2 | 0.00 | A | 3.5 | 5 | 0.00 |
| WB | A | 3.5 | 6 | 0.01 | A | 2.6 | 5 | 0.01 |
| NB | A | 5.8 | 11 | 0.03 | A | 6.0 | 12 | 0.03 |
| SB | A | 5.6 | 10 | 0.04 | A | 5.6 | 7 | 0.02 |
| Watkiss Way / Burnside Road W | ||||||||
| EB | B | 13.2 | 27 | 0.41 | B | 10.2 | 19 | 022 |
| WB | B | 13.4 | 26 | 0.44 | B | 12.6 | 33 | 0.52 |
| NBTL | A | 10.0 | 64 | 0.54 | B | 17.0 | 50 | 0.40 |
| NBR | A | 3.9 | 30 | 0.29 | A | 2.2 | 16 | 0.11 |
| SB | B | 18.8 | 32 | 0.18 | B | 12.1 | 54 | 0.51 |
| Watkiss Way / Hospital Access / Mall Access | ||||||||
| EB | A | 5.3 | 23 | 0.26 | A | 4.9 | 22 | 0.29 |
| WBTL | A | 6.2 | 36 | 0.30 | A | 5.2 | 26 | 0.21 |
| WBR | A | 3.1 | 2 | 0.30 | A | 2.9 | 2 | 0.21 |
| NB | A | 3.2 | 14 | 0.03 | A | 4.3 | 25 | 0.08 |
| SB | A | 3.8 | 10 | 0.05 | A | 3.8 | 19 | 0.10 |
| Watkiss Way / Helmcken Road / Chancellor Avenue | ||||||||
| EBLT | C | 26.9 | 51 | 0.56 | C | 26.1 | 70 | 0.60 |
| EBR | B | 11.8 | 42 | 0.38 | B | 17.2 | 66 | 0.58 |
| WBL | C | 26.4 | 7 | 0.07 | C | 32.8 | 9 | 0.09 |
| WBTR | C | 26.1 | 4 | 0.02 | B | 12.6 | 2 | 0.02 |
| NBL | F | 95.1 | 97 | 0.64 | D | 46.0 | 46 | 0.57 |
| NBTR | B | 12.4 | 108 | 0.27 | B | 13.1 | 67 | 0.26 |
| SBL | D | 42.1 | 11 | 0.03 | E | 63.1 | 14 | 0.06 |
| SBTR | C | 23.8 | 102 | 0.76 | C | 32.3 | 109 | 0.85 |
Note: ## - Exceeds storage/acceptable limits
The intersections of Watkiss Way / Erskine Lane / Stoneridge Drive, Watkiss Way / Burnside Road W, and Watkiss Way / Hospital Access / Mall Access in both the AM and PM peak hour currently perform at an acceptable Level of Service (LOS), operating at LOS B or better with delays of 19 seconds or less. The 95th percentile queues are acceptable on all movements and the volume to capacity ratio (v/c) ratios for all approaches is 0.54 or less for all movements.
The intersection of Watkiss Way / Helmcken Road / Chancellor Avenue generally functions with an acceptable LOS, except for the northbound left movement in the AM peak hour which operates at a LOS F with a delay of 95 seconds, and the southbound left movement in the PM peak hour, which operates at a LOS E with a delay of 63 seconds. The northbound left movement is a minor movement for the intersection representing approximately 1% of the intersection’s total volume; high delay values on this one movement is not an indication of general poor intersection performance. The 95th percentile queues are acceptable on all movements and the v/c ratios for all approaches is 0.76 or less for all movements.
6.4 2023 Traffic Operations with 9 Erskine Lane Full Build Out
6.4.1 2023 Traffic Operations
A summary of the traffic analysis results for the intersections and site accesses in the study area after 9 Erskine Lane is fully built out are provided in Table 9 and Table 10.
Table 9 – 2023 Post Development Peak Hour Results
| Key Movement | AM | PM | ||||||
|---|---|---|---|---|---|---|---|---|
| LOS | Delay (s) | 95th % Queue (m) | v/c | LOS | Delay (s) | 95th % Queue (m) | v/c | |
| Watkiss Way / Erskine Lane / Stoneridge Drive (stop-controlled) | ||||||||
| EB | A | 3.9 | 1 | 0.00 | A | 3.3 | 4 | 0.00 |
| WB | A | 3.7 | 9 | 0.02 | A | 4.0 | 13 | 0.05 |
| NB | A | 6.9 | 16 | 0.20 | A | 6.4 | 13 | 0.12 |
| SB | A | 5.5 | 10 | 0.06 | A | 6.1 | 8 | 0.22 |
| Watkiss Way / Burnside Road W | ||||||||
| EB | B | 12.1 | 27 | 0.40 | B | 10.4 | 21 | 022 |
| WB | B | 13.4 | 30 | 0.50 | B | 11.8 | 32 | 0.57 |
| NBTL | A | 9.6 | 55 | 0.54 | B | 17.7 | 50 | 0.45 |
| NBR | A | 3.9 | 28 | 0.30 | A | 2.7 | 19 | 0.16 |
| SB | C | 20.3 | 31 | 0.18 | B | 12.7 | 65 | 0.59 |
| Watkiss Way / Hospital Access / Mall Access | ||||||||
| EB | A | 5.7 | 27 | 0.32 | A | 5.7 | 32 | 0.33 |
| WBTL | A | 5.9 | 36 | 0.31 | A | 5.8 | 31 | 0.25 |
| WBR | A | 3.1 | 0 | 0.31 | A | 3.0 | 1 | 0.25 |
| NB | A | 3.2 | 13 | 0.03 | A | 4.1 | 26 | 0.08 |
| SB | A | 4.4 | 13 | 0.05 | A | 4.3 | 23 | 0.10 |
| Watkiss Way / Helmcken Road / Chancellor Avenue | ||||||||
| EBLT | C | 24.6 | 57 | 0.60 | C | 27.7 | 74 | 0.62 |
| EBR | B | 12.4 | 50 | 0.39 | B | 18.6 | 67 | 0.60 |
| WBL | C | 27.6 | 8 | 0.07 | C | 30.1 | 10 | 0.09 |
| WBTR | C | 22.4 | 4 | 0.02 | C | 20.5 | 2 | 0.02 |
| NBL | F | 132.6 | 106 | 0.70 | E | 57.4 | 58 | 0.64 |
| NBTR | B | 16.2 | 128 | 0.28 | B | 12.9 | 72 | 0.27 |
| SBL | E | 55.4 | 8 | 0.03 | E | 68.8 | 11 | 0.07 |
| SBTR | C | 24.3 | 99 | 0.77 | C | 35.0 | 109 | 0.86 |
Note: ## - Exceeds storage/acceptable limits
Table 10 – 2023 Post Development Peak Hour Results – Site Accesses
| Key Movement | AM | PM | ||||||
|---|---|---|---|---|---|---|---|---|
| LOS | Delay (s) | 95th % Queue (m) | v/c | LOS | Delay (s) | 95th % Queue (m) | v/c | |
| Erskine Lane / Access 1 | ||||||||
| WBLR | A | 4.8 | 14 | 0.05 | A | 2.1 | 14 | 0.03 |
| NBTR | A | 1.5 | 0 | 0.03 | A | 0.6 | 0 | 0.02 |
| SBTL | A | 1.5 | 4 | 0.01 | A | 0.8 | 3 | 0.03 |
| Erskine Lane / Access 2 | ||||||||
| WBLR | A | 4.7 | 12 | 0.02 | A | 2.2 | 10 | 0.01 |
| NBTR | A | 1.9 | 0 | 0.01 | A | 0.2 | 0 | 0.01 |
| SBTL | A | 2.4 | 1 | 0.01 | A | 1.4 | 1 | 0.01 |
| Erskine Lane / Access 3 | ||||||||
| WBLR | A | 4.8 | 12 | 0.02 | A | 2.1 | 10 | 0.01 |
| NBTR | A | 0 | 0 | 0.00 | A | 0 | 0 | 0.00 |
| SBTL | A | 2.2 | 0 | 0.00 | A | 1.3 | 0 | 0.01 |
The addition of site traffic post development has small impacts on the network in both the AM and PM peak hours. The intersections of Watkiss Way / Erskine Lane / Stoneridge Drive, sees almost no change with the addition of site traffic, remaining at LOS A for all movements.
Watkiss Way / Burnside Road W, and Watkiss Way / Hospital Access / Mall Access in both the AM and PM peak hour sees a maximum change in delay of 2 seconds or less and maintains LOS C or better on all movements.
The poorly performing movements at Watkiss Way / Helmcken Road / Chancellor Avenue continue to operate poorly in both the AM and PM peak hours. The northbound left movement drops form LOS D to LOS E in the PM peak hour with a delay of 58 seconds, and the southbound left movement drops from LOS d to LOS Ein the AM peak with a delay of 69 seconds.
The 95th percentile queues remain acceptable on all approaches, The v/c ratios for all approaches are 0.77 or less for all movements.
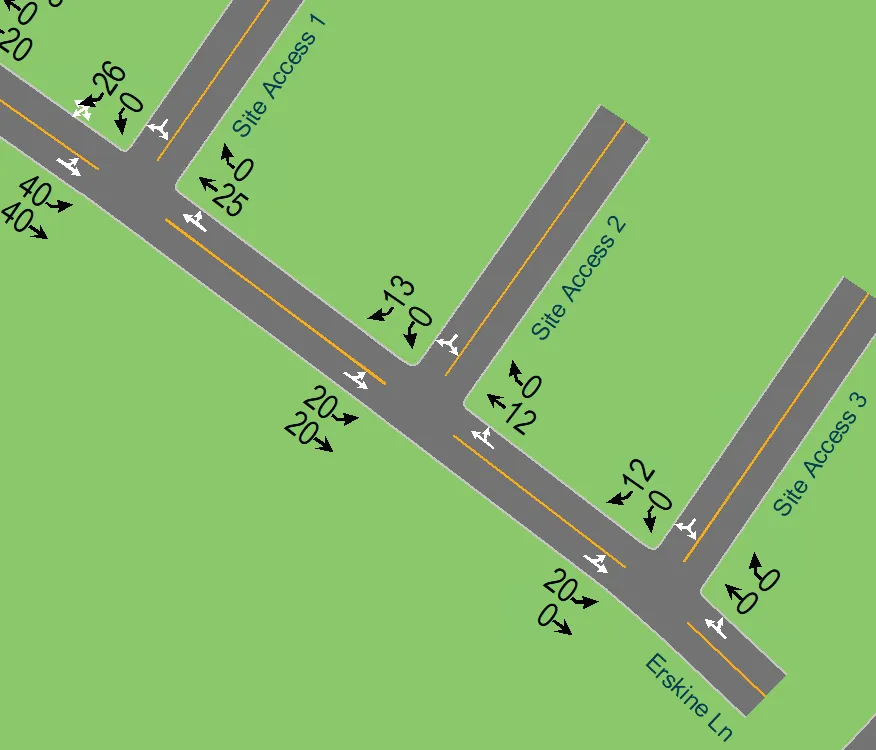
All site accesses operate at LOS A with delays of 5 seconds or less and no queue issues. The v/c ratio for all movements is 0.05 or less. Figure 15 and Figure 16 show the traffic volumes for the AM and PM peak hours in 2023.
Figure 15 – 2023 AM Site Accesses
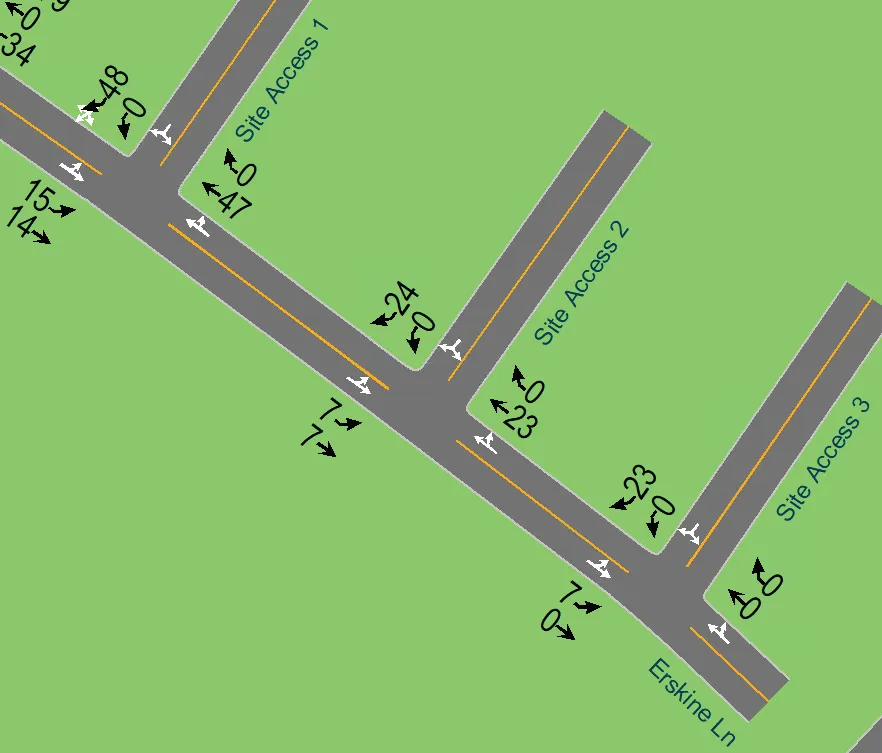
Figure 16 – 2023 PM Site Accesses
6.4.2 Watkiss Way / Erskine Lane / Stoneridge Drive Traffic Operations Change
Even though the Watkiss Way / Erskine Lane / Stoneridge Drive intersection operates at LOS A, WATT was asked to review performance implications for changes in traffic control. A summary of the traffic analysis results with traffic operation changes to either a roundabout or a traffic signal (assumes no dedicated turn lanes) is provided in Table 11.
Table 11 – Traffic Signal vs. Roundabout - 2023
| Key Movement | AM | PM | ||||||
|---|---|---|---|---|---|---|---|---|
| LOS | Delay (s) | 95th % Queue (m) | v/c | LOS | Delay (s) | 95th % Queue (m) | v/c | |
| Watkiss Way / Erskine Lane / Stoneridge Drive - Roundabout | ||||||||
| EB | A | 3.9 | 7 | 0.23 | A | 3.7 | 9 | 0.18 |
| WB | A | 3.5 | 4 | 0.12 | A | 3.8 | 6 | 0.21 |
| NB | A | 2.9 | 11 | 0.13 | A | 2.6 | 7 | 0.07 |
| SB | A | 2.7 | 4 | 0.02 | A | 2.7 | 4 | 0.01 |
| Watkiss Way / Erskine Lane / Stoneridge Drive – Traffic Signal | ||||||||
| EB | B | 14.5 | 44 | 0.58 | B | 16.4 | 31 | 0.44 |
| WB | B | 16.4 | 28 | 0.32 | B | 15.0 | 40 | 0.59 |
| NB | A | 6.2 | 18 | 0.14 | A | 7.1 | 13 | 0.09 |
| SB | A | 5.9 | 8 | 0.03 | A | 4.1 | 5 | 0.01 |
| Difference: Traffic Signal - Roundabout | ||||||||
| EB | B>A | +10.6 | +37 | +0.35 | B-->A | +12.7 | +22 | +0.26 |
| WB | B>A | +12.9 | +24 | +0.2 | B-->A | +11.2 | +34 | +0.38 |
| NB | A=A | +3.3 | +7 | +0.01 | A=A | +4.5 | +6 | +0.02 |
| SB | A=A | +3.2 | +4 | +0.01 | A=A | +1.4 | +1 | 0 |
Results show that the two devices perform with similar levels of LOS and delay, with the signal having a slightly higher delay value for the Watkiss Way movements. Queues remain comparable, with the signal having a slightly longer queues.
The intersection performs with little delay or queueing issue regardless of the control type as the results indicate, this is true of stop-controlled, signalized, or roundabout options.
6.5 Horizon Year Traffic Operations - 2033
6.5.1 Background Traffic Operations 2033
A summary of the background 2033 traffic analysis results for the intersections in the study area is provided in Table 12.
Table 12 – Background Traffic Operations - 2033
| Key Movement | AM | PM | ||||||
|---|---|---|---|---|---|---|---|---|
| LOS | Delay (s) | 95th % Queue (m) | v/c | LOS | Delay (s) | 95th % Queue (m) | v/c | |
| Watkiss Way / Erskine Lane / Stoneridge Drive (stop-controlled) | ||||||||
| EB | A | 3.1 | 3 | 0.00 | A | 2.8 | 3 | 0.01 |
| WB | A | 3.6 | 8 | 0.02 | A | 3.6 | 10 | 0.03 |
| NB | A | 6.4 | 17 | 0.16 | A | 5.7 | 15 | 0.01 |
| SB | A | 5.7 | 10 | 0.06 | A | 5.8 | 9 | 0.03 |
| Watkiss Way / Burnside Road W | ||||||||
| EB | B | 13.1 | 28 | 0.46 | B | 12.2 | 23 | 0.25 |
| WB | B | 15.3 | 30 | 0.56 | B | 14.2 | 36 | 0.61 |
| NBTL | B | 12.4 | 72 | 0.68 | C | 21.5 | 61 | 0.49 |
| NBR | A | 4.5 | 40 | 0.36 | A | 2.8 | 19 | 0.16 |
| SB | C | 31.9 | 40 | 0.24 | B | 14.2 | 75 | 0.63 |
| Watkiss Way / Hospital Access / Mall Access | ||||||||
| EB | A | 5.6 | 27 | 0.33 | A | 6.9 | 36 | 0.35 |
| WBTL | A | 6.3 | 38 | 0.34 | A | 6.3 | 34 | 0.26 |
| WBR | A | 3.0 | 3 | 0.34 | A | 3.0 | 4 | 0.26 |
| NB | A | 2.9 | 17 | 0.04 | A | 5.0 | 31 | 0.09 |
| SB | A | 4.3 | 14 | 0.06 | A | 5.2 | 26 | 0.12 |
| Watkiss Way / Helmcken Road / Chancellor Avenue | ||||||||
| EBLT | C | 25.5 | 62 | 0.61 | C | 28.8 | 85 | 0.64 |
| EBR | B | 14.9 | 54 | 0.41 | C | 21.8 | 73 | 0.64 |
| WBL | C | 25.6 | 8 | 0.07 | D | 38.9 | 11 | 0.10 |
| WBTR | C | 21.1 | 2 | 0.02 | C | 28.2 | 2 | 0.02 |
| NBL | F | 158.2 | 106 | 0.74 | F | 83.3 | 78 | 0.68 |
| NBTR | B | 18.7 | 129 | 0.29 | B | 16.8 | 90 | 0.28 |
| SBL | D | 54.2 | 11 | 0.03 | F | 88.7 | 16 | 0.07 |
| SBTR | C | 28.4 | 109 | 0.79 | D | 46.6 | 100 | 0.89 |
Note: ## - Exceeds storage/acceptable limits
The intersection of Watkiss Way / Erskine Lane / Stoneridge Drive operates at LOS A under stop-control with nod delay or queueing issues.
The Watkiss Way / Burnside Road W, and Watkiss Way / Hospital Access / Mall Access intersections in both the AM and PM peak hour area currently perform at an acceptable Level of Service (LOS), operating at LOS C or better with delays of 32 seconds or less. The 95th percentile queues are acceptable on all movements and the Volume to Capacity ratio (v/c) ratios for all approaches is 0.68 or less for all movements.
The intersection of Watkiss Way / Helmcken Road / Chancellor Avenue generally functions with an acceptable LOS, except for the northbound left movement, which operates at a LOS F with a delay of 158 seconds in the AM peak hour and at LOS F with a delay of 83 seconds in the PM peak hour, and the southbound left movement in the PM peak hour, which operates at a LOS F with a delay of 89 seconds. The 95th percentile queues are acceptable on all movements and the Volume to Capacity ratio (v/c) ratios for all approaches is 0.89 or less for all movements.
Document Images
(1)