9 Erskine Lane Traffic Impact Assessment - Sections 6.5.2 to 9.0
A portion of a traffic impact assessment report evaluating intersection performance and levels of service for the year 2033 post-development.
6.5.2 Full Build Out Traffic Operations 2033
A summary of the 2033 traffic analysis results for the intersections and site accesses in the study area after full build out, corridor growth, and site traffic is provided in Table 13 and Table 14.
Table 13 - 2033 Post Development Full Build Out
| Key Movement | AM LOS | AM Delay (s) | AM 95th % Queue (m) | AM v/c | PM LOS | PM Delay (s) | PM 95th % Queue (m) | PM v/c |
|---|---|---|---|---|---|---|---|---|
| Watkiss Way / Erskine Lane / Stoneridge Drive (stop-controlled) | ||||||||
| EB | A | 3.4 | 2 | 0.00 | A | 3.5 | 6 | 0.01 |
| WB | A | 4.1 | 12 | 0.03 | A | 4.1 | 16 | 0.07 |
| NB | A | 8.4 | 20 | 0.34 | A | 9.2 | 17 | 0.21 |
| SB | A | 6.9 | 10 | 0.09 | A | 7.9 | 9 | 0.04 |
| Watkiss Way / Burnside Road W | ||||||||
| EB | B | 14.0 | 29 | 0.43 | B | 12.2 | 23 | 0.24 |
| WB | B | 16.5 | 40 | 0.60 | B | 13.6 | 33 | 0.64 |
| NBTL | B | 13.2 | 77 | 0.70 | C | 23.0 | 70 | 0.49 |
| NBR | A | 4.6 | 39 | 0.37 | A | 2.7 | 26 | 0.19 |
| SB | C | 32.3 | 46 | 0.26 | B | 18.6 | 90 | 0.65 |
| Watkiss Way / Hospital Access / Mall Access | ||||||||
| EB | A | 6.0 | 31 | 0.39 | A | 6.7 | 34 | 0.38 |
| WBTL | A | 6.3 | 39 | 0.35 | A | 6.5 | 37 | 0.29 |
| WBR | A | 3.2 | 14 | 0.35 | A | 3.1 | 5 | 0.29 |
| NB | A | 3.6 | 18 | 0.04 | A | 5.6 | 31 | 0.09 |
| SB | A | 4.3 | 14 | 0.06 | A | 4.4 | 21 | 0.12 |
| Watkiss Way / Helmcken Road / Chancellor Avenue | ||||||||
| EBLT | C | 28.7 | 65 | 0.65 | C | 29.9 | 87 | 0.66 |
| EBR | B | 14.3 | 58 | 0.43 | C | 22.2 | 75 | 0.66 |
| WBL | C | 27.9 | 8 | 0.08 | D | 39.5 | 9 | 0.10 |
| WBTR | C | 20.9 | 4 | 0.02 | B | 20.0 | 3 | 0.02 |
| NBL | F | 168.0 | 106 | 0.81 | F | 165.5 | 103 | 0.76 |
| NBTR | B | 18.9 | 128 | 0.30 | B | 19.8 | 124 | 0.28 |
| SBL | E | 66.2 | 6 | 0.04 | F | 86.2 | 10 | 0.07 |
| SBTR | C | 27.0 | 105 | 0.80 | D | 47.4 | 98 | 0.89 |
Note: ## - Exceeds storage/acceptable limits
Table 14 – Full Build Out 2033 Traffic Operations – Site Accesses
| Key Movement | AM LOS | AM Delay (s) | AM 95th % Queue (m) | AM v/c | PM LOS | PM Delay (s) | PM 95th % Queue (m) | PM v/c |
|---|---|---|---|---|---|---|---|---|
| Erskine Lane / Access 1 | ||||||||
| WBLR | A | 5.5 | 15 | 0.06 | A | 4.9 | 15 | 0.05 |
| NBTR | A | 1.4 | 0 | 0.07 | A | 1.3 | 0 | 0.04 |
| SBTL | A | 1.5 | 7 | 0.01 | A | 1.6 | 7 | 0.03 |
| Erskine Lane / Access 2 | ||||||||
| WBLR | A | 5.0 | 10 | 0.03 | A | 4.6 | 10 | 0.01 |
| NBTR | A | 0.9 | 0 | 0.05 | A | 1.1 | 0 | 0.03 |
| SBTL | A | 2.9 | 0 | 0.01 | A | 2.6 | 0 | 0.01 |
| Erskine Lane / Access 3 | ||||||||
| WBLR | A | 4.7 | 10 | 0.03 | A | 4.5 | 10 | 0.01 |
| NBTR | A | 0.8 | 1 | 0.04 | A | 0.9 | 1 | 0.02 |
| SBTL | A | 2.5 | 1 | 0.01 | A | 2.6 | 1 | 0.01 |
In the 2033 horizon year the impacts on the network in both the AM and PM peak hours are moderate. The intersections of Watkiss Way / Erskine Lane / Stoneridge Drive, Watkiss Way / Burnside Road W, and Watkiss Way / Hospital Access / Mall Access in both the AM and PM peak hour sees a maximum change in delay of 5 seconds or less and maintains LOS C or better on all movements. The 95th percentile queues change by 15 metres or less on all movements (i.e., approximately two car lengths) and remain acceptable.
The previously failed movements at Watkiss Way / Helmcken Road / Chancellor Avenue continue to fail in both the AM and PM peak hours with the northbound left movement experiencing an additional 10 seconds of delay in the AM peak hour and 83 seconds of additional delay in the PM peak hour, and the southbound left movement experiencing the same delay in the PM peak hour. The southbound left movement now also fails in the AM peak hour reaching LOS E with a delay of 66 seconds.
The 95th percentile queues remain acceptable on all approaches with an increase of 34 metres or less (i.e., five car lengths) from background conditions. The v/c ratios for all approaches are 0.89 or less for all movements.
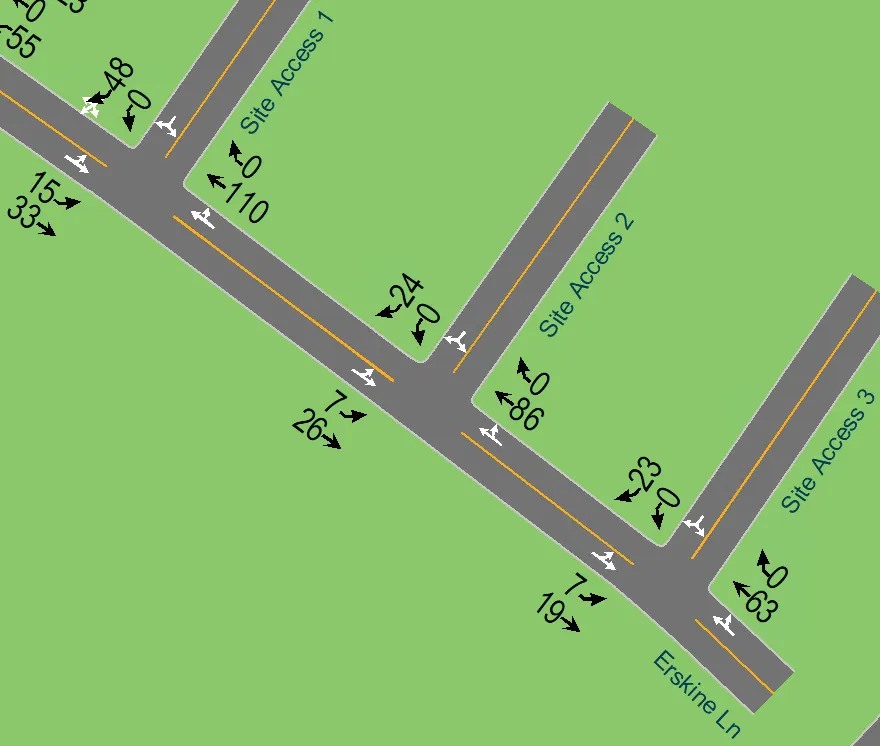
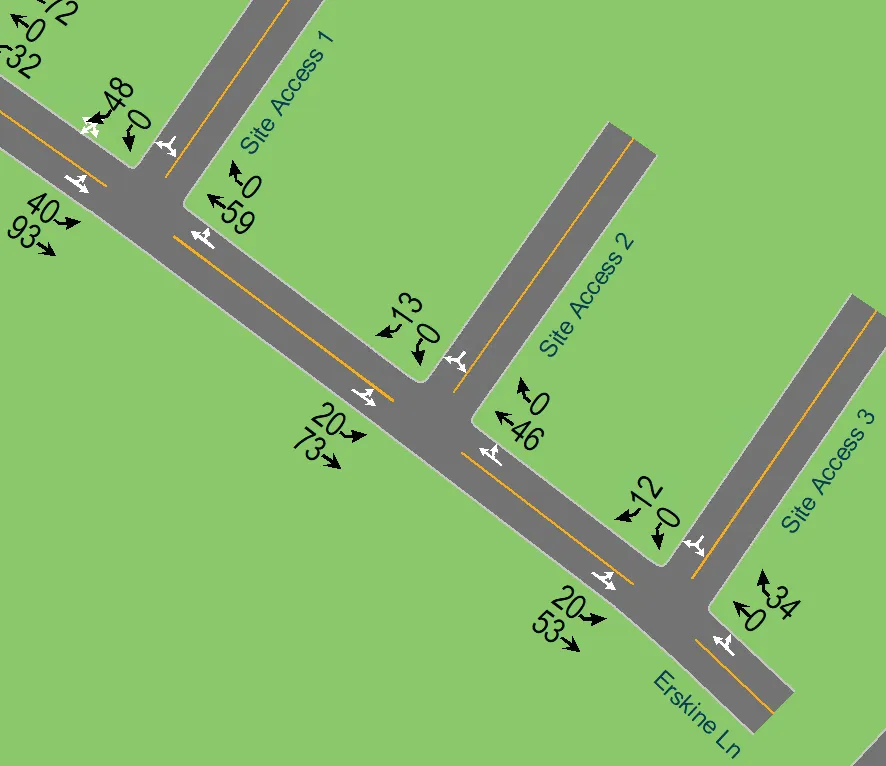
All site accesses continue to operate well at LOS A with delays of 6 seconds or less, less than 1 second increase from 2023, and 95th percentile queues of 15 metres of less (i.e., approximately 2 car lengths), less than 1 metre increase from 2023. The v/c ratio for all movements is 0.07 or less. Figure 17 and Figure 18 show the traffic volumes for the site accesses in the AM and PM peak hours in 2033.
6.5.3 Watkiss Way / Erskine Lane / Stoneridge Drive Traffic Operations Change
Traffic control changes for the future scenario were modeled as they were in the 2023 scenario. A summary of the traffic analysis results in 2033 for the Watkiss Way / Erskine Lane / Stoneridge Drive intersection with traffic operation changes to either a roundabout or a traffic signal (assumes no dedicated turn lanes) is provided in Table 15.
Table 15 – Traffic Signal vs. Roundabout - 2033
| Key Movement | AM LOS | AM Delay (s) | AM 95th % Queue (m) | AM v/c | PM LOS | PM Delay (s) | PM 95th % Queue (m) | PM v/c |
|---|---|---|---|---|---|---|---|---|
| Watkiss Way / Erskine Lane / Stoneridge Drive - Roundabout | ||||||||
| EB | A | 4.1 | 11 | 0.26 | A | 4.0 | 14 | 0.22 |
| WB | A | 3.6 | 7 | 0.14 | A | 4.0 | 7 | 0.25 |
| NB | A | 3.2 | 13 | 0.20 | A | 2.8 | 10 | 0.10 |
| SB | A | 2.8 | 6 | 0.02 | A | 2.7 | 4 | 0.01 |
| Watkiss Way / Erskine Lane / Stoneridge Drive – Traffic Signal | ||||||||
| EB | B | 14.1 | 45 | 0.62 | B | 11.5 | 37 | 0.47 |
| WB | B | 18.5 | 29 | 0.36 | B | 15.1 | 43 | 0.66 |
| NB | A | 6.7 | 23 | 0.23 | A | 9.1 | 16 | 0.14 |
| SB | A | 7.1 | 9 | 0.03 | A | 6.0 | 6 | 0.02 |
| Difference: Traffic Signal - Roundabout | ||||||||
| EB | B>A | +10 | +34 | +0.36 | B>A | +7.5 | +23 | +0.25 |
| WB | B>A | +14.9 | +22 | +0.22 | B>A | +11.1 | +36 | +0.41 |
| NB | A=A | +3.5 | +10 | +0.03 | A=A | +6.3 | +6 | +0.04 |
| SB | A=A | +4.3 | +3 | +0.01 | A=A | +3.3 | +2 | +0.01 |
Note: ## - Exceeds storage/acceptable limits
Comparing a change in traffic operation for the intersection of Watkiss Way / Erskine Lane / Stoneridge Drive in 2033 shows that both a traffic signal and a roundabout continue to work as a solution to improve traffic operations. A traffic signal still operates at LOS B or better with a delay of 19 seconds or less, and a roundabout continues to operate at LOS A with a delay of 4 seconds or less.
A traffic signal has a larger delay of 15 seconds or less over a roundabout in the AM and PM peak hours in 2033. The 95th percentile queues increase by 36 metres or less (i.e., approximately 5 car lengths) and the v/c ratio increases by 0.41 or less on any movement. These results demonstrate that either option will serve traffic acceptably, and the inclusion of left turn lanes on Watkiss Way would improve the signal performance results.
As with the 2023 results the intersection performs well under all traffic control types, including under stop-control.
7.0 LEFT TURN LANES
A left-turn lane warrant analysis was conducted at Watkiss Way/Erskine Lane using the MoTI tables for unsignalized intersections. Results can be seen in Table 16.
The results show that no left turn lane is warranted in either 2023 or 2033. The “*Yes*” results in the 2033 Westbound – PM is very marginal, barely meeting the requirements.
Despite these results WATT recommends that the turn lanes be installed on Watkiss Way; they provide improved safety as it separates left turn and through traffic and provides the opportunity for dedicated left turn phasing in a signalized future (if warranted).
Table 16 – MOTI Left Turn Warrant Analysis for Unsignalized Intersections
| Movement and Time | Approaching Vehicle Volume | Opposing Vehicle Volume | No. of Left Turns | % of Left Turns | Warranted? |
|---|---|---|---|---|---|
| 2023 | |||||
| Eastbound - AM | 278 | 143 | 2 | 1% | No |
| Westbound - AM | 143 | 278 | 24 | 17% | No |
| Eastbound - PM | 216 | 261 | 5 | 2% | No |
| Westbound - PM | 261 | 216 | 55 | 21% | No |
| 2033 | |||||
| Eastbound - AM | 319 | 170 | 2 | 1% | No |
| Westbound - AM | 170 | 319 | 34 | 20% | No |
| Eastbound - PM | 262 | 312 | 6 | 2% | No |
| Westbound - PM | 312 | 262 | 84 | 27% | *Yes* |
8.0 CONCLUSIONS
The development will not significantly impact the traffic operations at the three Town intersections. All movements will operate at LOS C or better in the long-term in both the background and post development conditions.
At the Watkiss Way / Helmcken Road intersection, the addition of the development does impact the levels of service; however, the effect is minimal as most of the failing movements were failing in background. The biggest effect in both the 2023 and 2033 analysis is to the northbound left movement (least critical movement) in the PM peak hour and the southbound left movement in the AM peak hour. MOTI and the Town of View Royal should look at improving traffic signal timing to mitigate this issue.
The proposed TDM program (two car share vehicles, two shared e-bikes, and secure bicycle parking) along with the proximity to the Galloping Goose, transit, and amenities at Eagle Creek Village will help encourage residents to shift their trips to other modes of transportation and reduce vehicular traffic.
The proposed site access meet TAC guidelines for corner clearance and sightlines.
A sidewalk should be provided along the Erskine Lane development frontage to provide a better connection to the Hospital trail, and Galloping Goose Trail. Additional bicycle improvements are under negotiation with the Town at this time, however a high-quality AAA connection to the Galloping Goose Trail (i.e. a multi-use path or equivalent) should be strongly considered.
Traffic calming is not required on Erskine Lane due to the short length of the street and the lack of connectivity to other streets. Traffic calming on Erskine Lane would not reduce traffic (as all traffic would be due to land uses on the street) and there is limited ability to speed due to the length.
9.0 RECOMMENDATIONS
Watt makes the following recommendations to the developer of this site:
- The developer will provide a sidewalk along the Erskine Lane and Watkiss Way development frontages.
- The developer provides a high-standard cycling connection to the Galloping Goose Trail along the Erskine Lane frontage.
- The developer to explore implementation of TDM strategies [car share vehicles (2) and electric bicycle share (2)] to reduce vehicle traffic and encourage active modes.
- The developer to contribute towards the traffic control scheme of the Erskine Lane / Watkiss Way intersection. Including left turn lanes.