Presentation: WHY SHOULD VIEW ROYAL SUE BIG OIL?
Presentation slides supporting the delegation from West Coast Environmental Law regarding climate litigation.
WHY SHOULD VIEW ROYAL SUE BIG OIL?
(WITH OTHER COMMUNITIES)
6 June 2023 Andrew Gage, West Coast Environmental Law
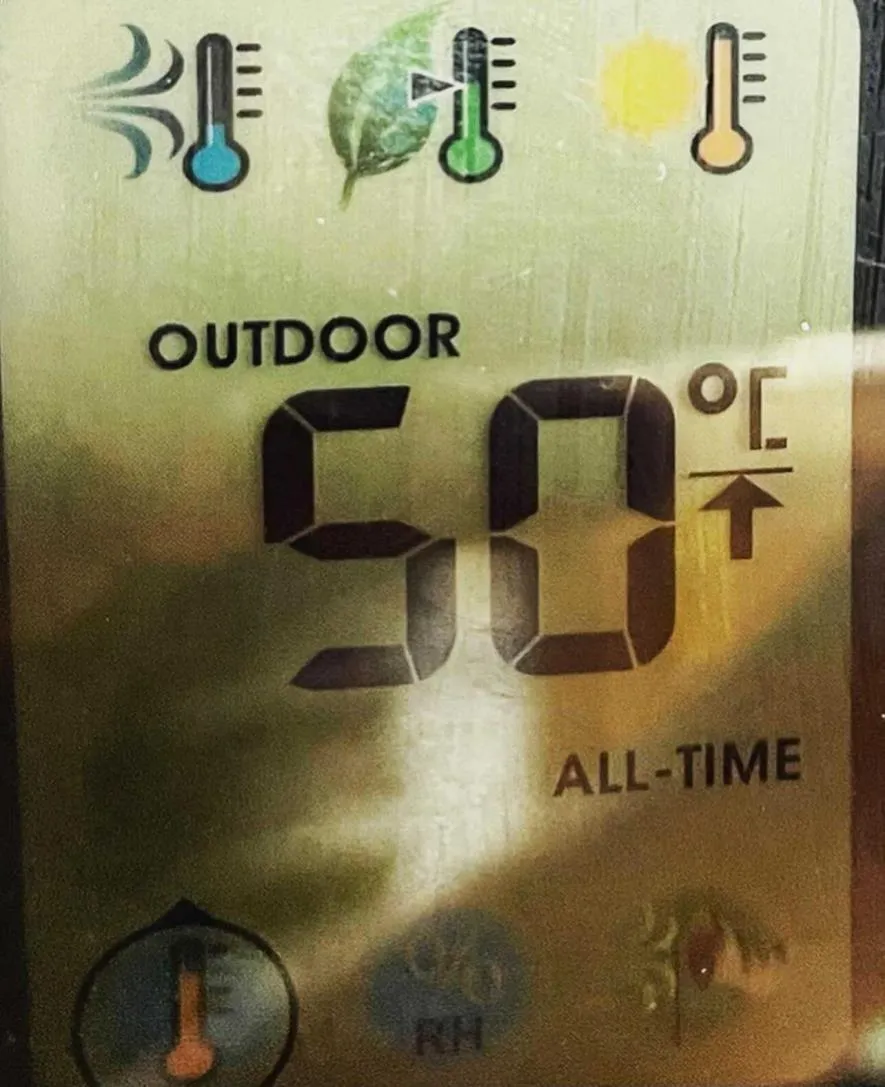
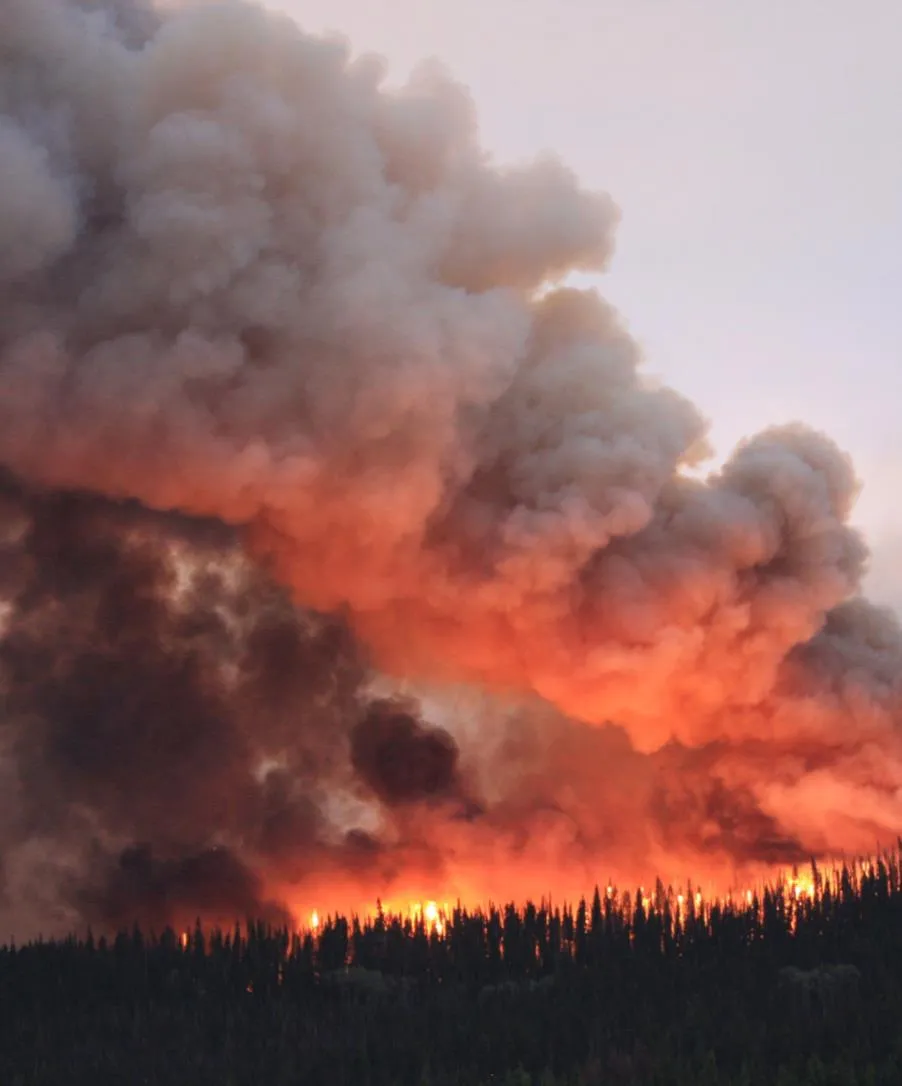
Photos: Julia Kidder (Ashcroft), Tracy Calogheros (Iowna Island), Province of BC (Abbotsford)
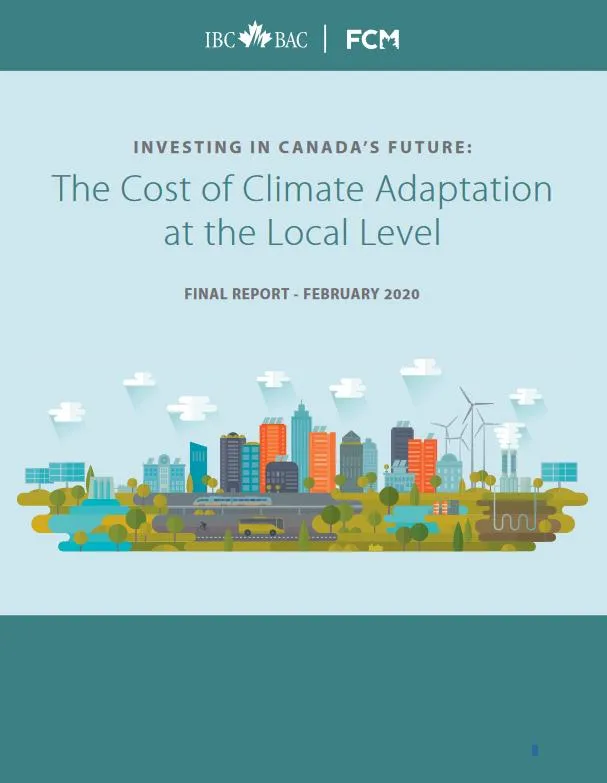
INVESTING IN CANADA’S FUTURE:
The Cost of Climate Adaptation at the Local Level
FINAL REPORT - FEBRUARY 2020
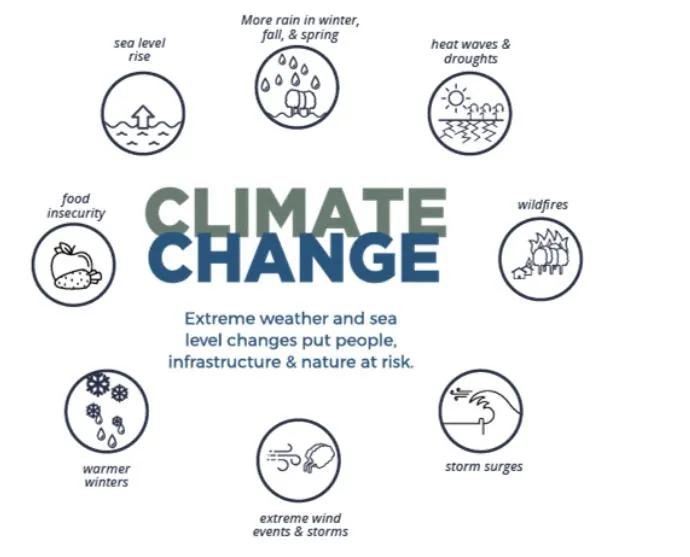
CLIMATE CHANGE
Extreme weather and sea level changes put people, infrastructure & nature at risk.
- sea level rise
- More rain in winter, fall, & spring
- heat waves & droughts
- wildfires
- storm surges
- extreme wind events & storms
- warmer winters
- food insecurity
TOWN OF VIEW ROYAL
45 View Royal Avenue, Victoria, BC, Canada V9B 1A6
January 26, 2018
Royal Dutch Shell plc Attn: CEO PO Box 162 2501 AN The Hague The Netherlands
Dear Sirs/Mesdames:
Re: View Royal’s Climate Costs and Royal Dutch Shell plc’s Fair Share
We write as the Mayor and Council of the Town of View Royal, on southern Vancouver Island, Canada, to ask about your company’s willingness to take responsibility for climate costs associated with the use of your product.
Our Official Community Plan, adopted in September 2011, recognizes that the impacts of climate change must be a “key determinant” in our community’s planning:
Consider the impacts of climate change as a key determinant in community planning and land use management decisions.

“As a coastal community we are concerned about rising sea-levels. Our community is bordered on two sides by tidal waters (Esquimalt Lagoon and the Gorge Waterway), and we have low-lying land on both sides. Increased winter precipitation is impacting our roads and stormwater management, while summer drought over the past several years has affected our residents. Planning for and addressing these impacts brings real costs for us as a municipality. Costs like these will only rise as global temperatures increase.”
“Your industry has known for decades that your products would compromise the global health of the atmosphere and would create risks to communities around the world. … [Y]ou have continued marketing your products, and have not aggressively moved to a different, more sustainable business model. Just as other industries take cradle-to-grave responsibility for their products, we believe it is only fair that you commit to pay a share of the costs resulting from climate change being borne by View Royal and other communities like ours.”
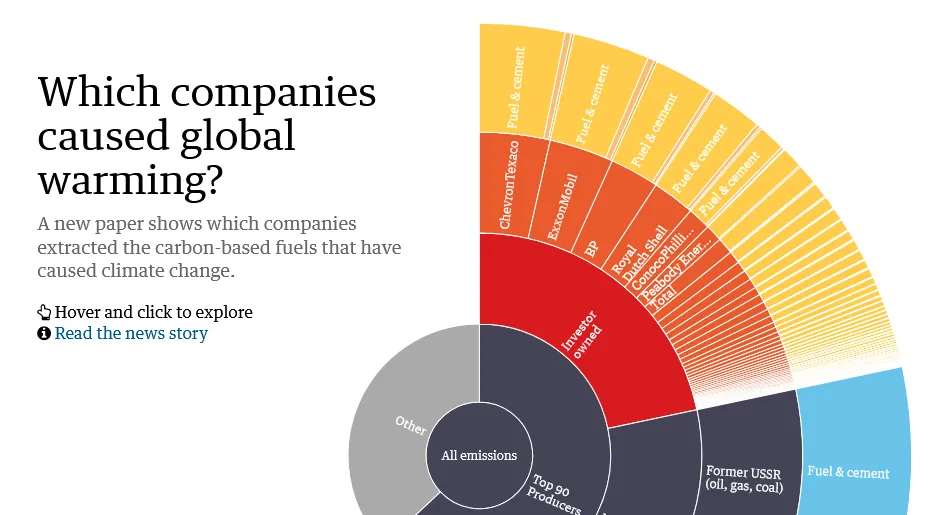
Why Fossil Fuel companies?
Which companies caused global warming?
A new paper shows which companies extracted the carbon-based fuels that have caused climate change.
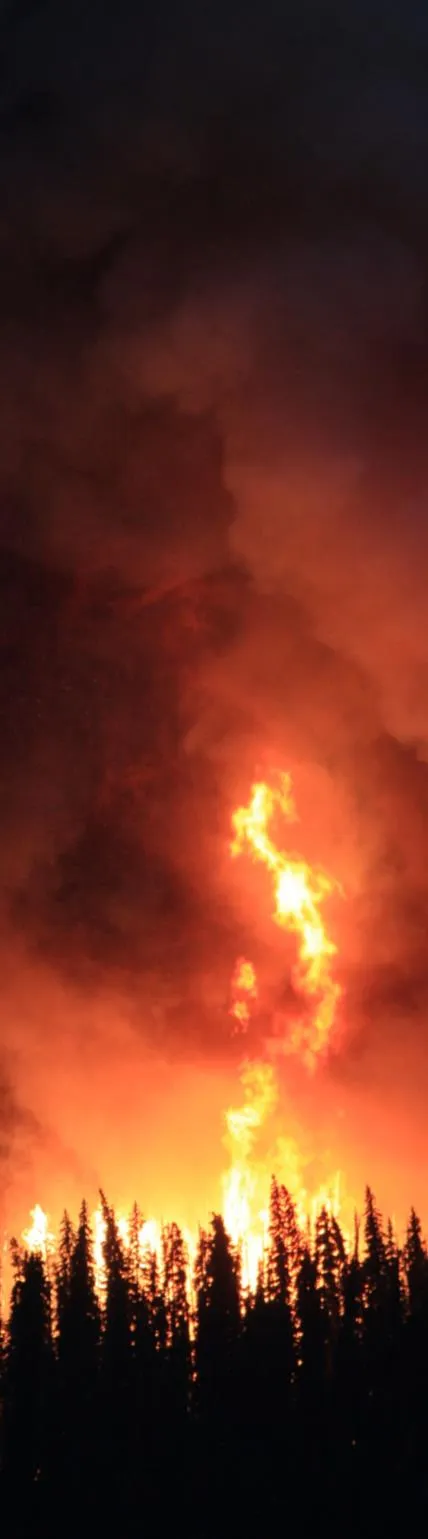
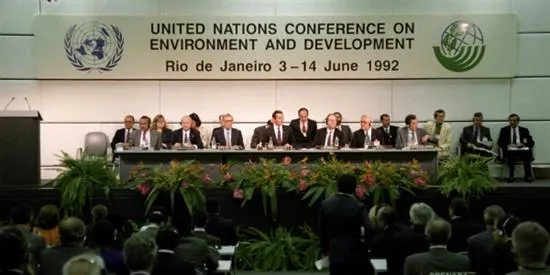
Image from The Guardian, 2013
“stabilization of greenhouse gas concentrations in the atmosphere at a level that would prevent dangerous anthropogenic interference with the climate system.”
Photo by UN Photos