TOWN OF VIEW ROYAL FINANCIAL INFORMATION - Fiscal Year Ended December 31, 2016
The audited financial section of the 2016 Annual Report, containing consolidated financial statements, schedules of remuneration, and statistical data.
TOWN OF VIEW ROYAL
FINANCIAL INFORMATION
Fiscal Year Ended December 31, 2016
Financial Information
Table of Contents
- Statement of Financial Information Approval: 36
- Consolidated Financial Statements: 37
- Managements Responsibility for the Consolidated Financial Statements: 38
- Independent Auditors’ Report: 39
- Consolidated Statement of Financial Position: 40
- Consolidated Statement of Operations: 41
- Consolidated Statement of Change in Net Financial Assets: 42
- Consolidated Statement of Cash Flows: 43
- Notes to the Consolidated Financial Statements: 44
- Schedule of Payments for Goods and Services: 67
- Statement of Remuneration and Expenses: 69
- Statement of Guarantee and Indemnity Agreements: 70
- Statement of Severance Agreements: 71
- Statement of Permissive Tax Exemptions: 72
- Statement of Development Cost Charges: 73
- 5 Year Assessment and Property Tax Information: 74
- Long Term Debt and Capital Lease Obligations: 76
- Principal Taxpayers: 77
Statement of Financial Information Approval
For the year ended December 31, 2016
The undersigned, as authorized by the Financial Information Regulation, Schedule 1, subsection 9(2), approves all the statements and schedules included in this Statement of Financial Information, produced under the Financial Information Act.
Prepared pursuant to the Financial Information Regulation, Schedule 1, subsection 9
Consolidated Financial Statements of
TOWN OF VIEW ROYAL
Year ended December 31, 2016
MANAGEMENT’S RESPONSIBILITY FOR THE CONSOLIDATED FINANCIAL STATEMENTS
The accompanying consolidated financial statements of the Town of View Royal (the "Town") are the responsibility of Town’s management and have been prepared in compliance with legislation, and in accordance with Canadian public sector accounting standards for local governments as recommended by the Public Sector Accounting Board of Chartered Professional Accountants Canada. A summary of the significant accounting policies are described in the notes to the consolidated financial statements. The preparation of financial statements necessarily involves the use of estimates based on management’s judgment, particularly when transactions affecting the current accounting period cannot be finalized with certainty until future periods.
The Town’s management maintains a system of internal controls designed to provide reasonable assurance that assets are safeguarded, transactions are properly authorized and recorded in compliance with legislative and regulatory requirements, and reliable financial information is available on a timely basis for preparation of the consolidated financial statements. These systems are monitored and evaluated by management.
Mayor and Council meet with management and the external auditors to review the consolidated financial statements and discuss any significant financial reporting or internal control matters prior to their approval of the consolidated financial statements.
The consolidated financial statements have been audited by Grant Thornton LLP, independent external auditors appointed by the Town. The accompanying Independent Auditors’ Report outlines their responsibilities, the scope of their examination and their opinion on the Town’s consolidated financial statements. Their opinion is based upon an examination conducted in accordance with Canadian generally accepted auditing standards, performing such tests and other procedures as they consider necessary to obtain reasonable assurance that the consolidated financial statements are free of material misstatement and present fairly the financial position and results of the Town in accordance with Canadian public sector accounting standards.
INDEPENDENT AUDITORS’ REPORT
To the Mayor and Councillors of THE TOWN OF VIEW ROYAL
Report on Consolidated Financial Statements
We have audited the accompanying consolidated financial statements of the Town of View Royal, which comprise the consolidated statement of financial position as at December 31, 2016, the consolidated statement of operations, change in net financial assets and cash flows for the year then ended, and a summary of significant accounting policies and other explanatory information.
Management’s Responsibility for the Consolidated Financial Statements
Management is responsible for the preparation and fair presentation of these consolidated financial statements in accordance with Canadian public sector accounting standards and for such internal control as management determines is necessary to enable the preparation of consolidated financial statements that are free from material misstatement, whether due to fraud or error.
Auditors’ Responsibility
Our responsibility is to express an opinion on these consolidated financial statements based on our audit. We conducted our audit in accordance with Canadian generally accepted auditing standards. These standards require that we comply with ethical requirements and plan and perform the audit to obtain reasonable assurance about whether the consolidated financial statements are free of material misstatement, whether due to fraud or error.
An audit involves performing procedures to obtain audit evidence about the amounts and disclosures in the consolidated financial statements. The procedures selected depend on the auditor’s judgment, including the assessment of the risks of material misstatement of the consolidated financial statements, whether due to fraud or error. In making those risk assessments, the auditor considers internal control relevant to the entity’s preparation and fair presentation of the consolidated financial statements in order to design audit procedures that are appropriate in the circumstances, but not for the purpose of expressing an opinion on the effectiveness of the entity’s internal control. An audit also includes evaluating the appropriateness of accounting policies used and the reasonableness of accounting estimates made by management, as well as evaluation of the overall presentation of the consolidated financial statements.
We believe that the audit evidence we have obtained is sufficient and appropriate to provide a basis for our audit opinion.
Opinion
In our opinion, the consolidated financial statements present fairly, in all material respects, the consolidated financial position of The Town of View Royal as at December 31, 2016, and its consolidated results of operations, its consolidated changes in net financial assets and its consolidated cash flows for the year then ended in accordance with Canadian public sector accounting standards.
Other Matter
The financial statements of the Town of View Royal for the year ended December 31, 2015, were audited by Hayes Stewart Little & Co. The partners and staff of Hayes Stewart Little & Co joined Grant Thornton LLP subsequent to October 1, 2016.
Victoria, BC May 2, 2017
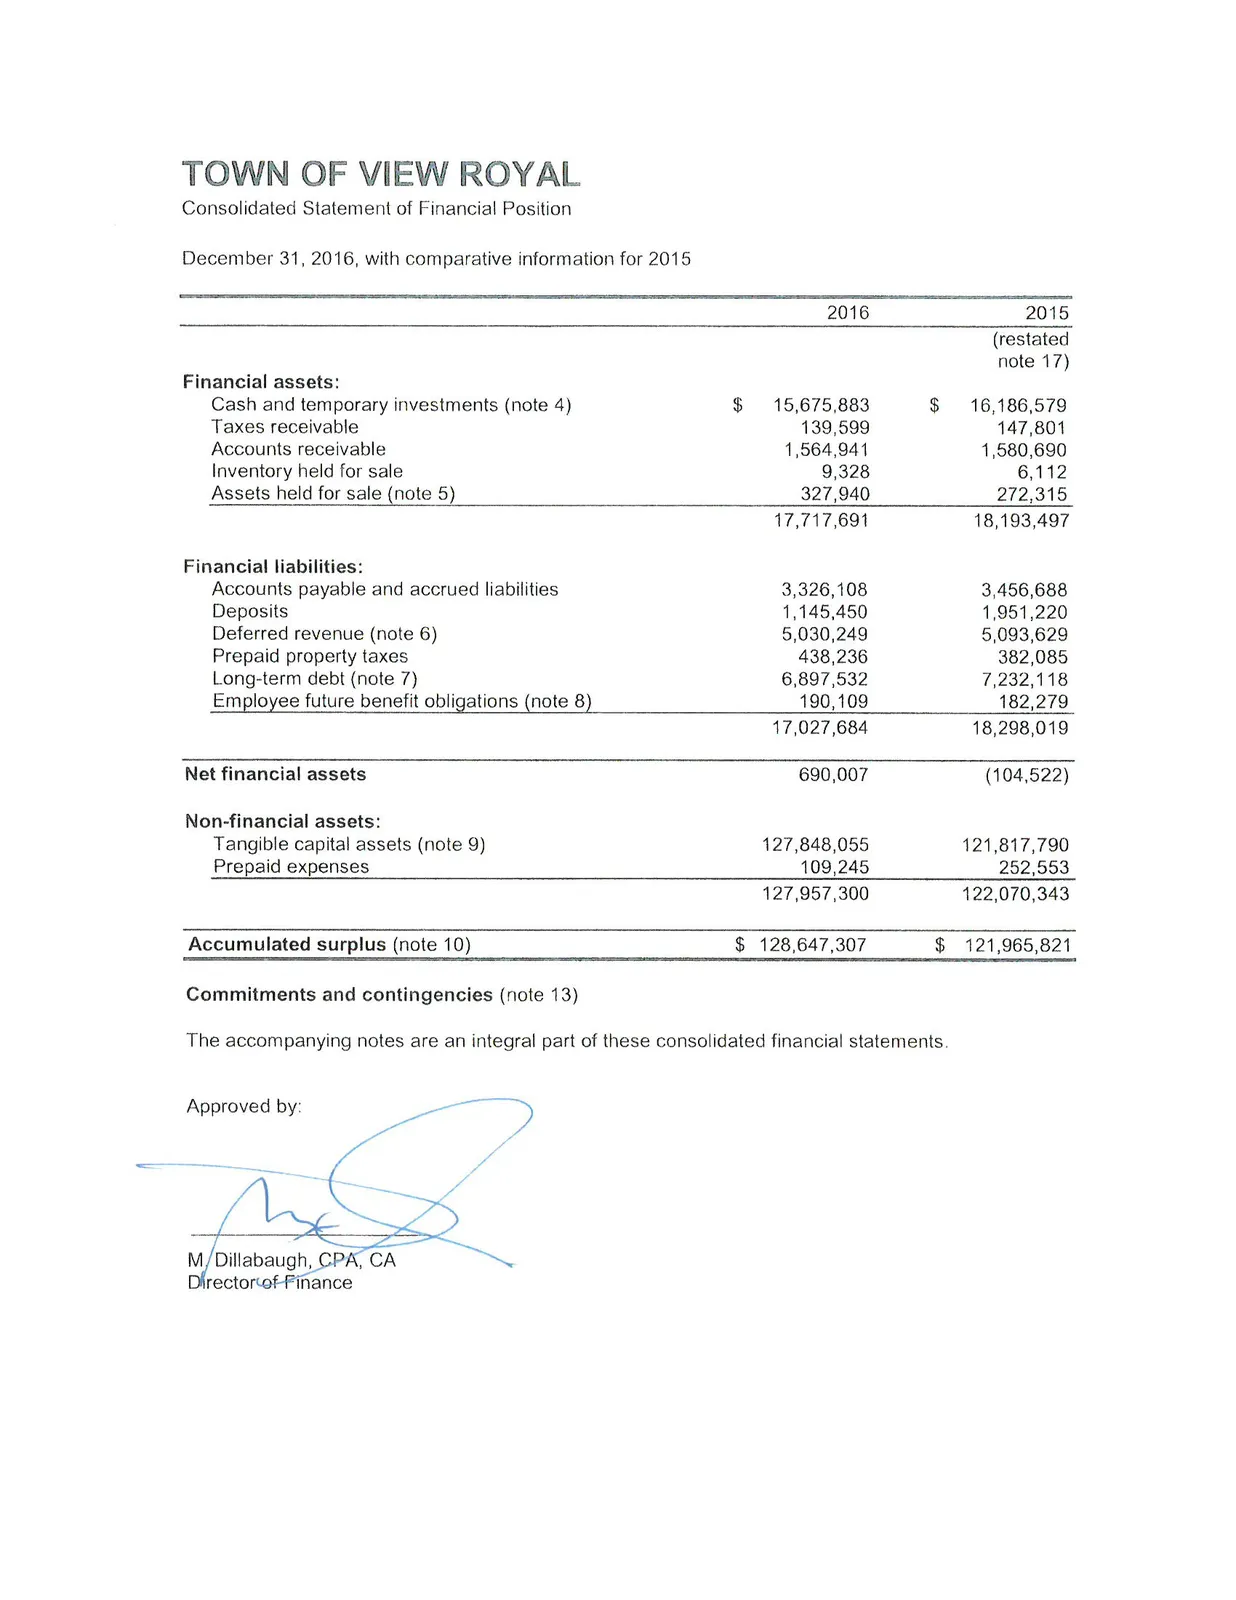
TOWN OF VIEW ROYAL
Consolidated Statement of Financial Position
December 31, 2016, with comparative information for 2015
| 2016 | 2015 | |
|---|---|---|
| (restated note 17) | ||
| Financial assets: | ||
| Cash and temporary investments (note 4) | $ 15,675,883 | $ 16,186,579 |
| Taxes receivable | 139,599 | 147,801 |
| Accounts receivable | 1,564,941 | 1,580,690 |
| Inventory held for sale | 9,328 | 6,112 |
| Assets held for sale (note 5) | 327,940 | 272,315 |
| 17,717,691 | 18,193,497 | |
| Financial liabilities: | ||
| Accounts payable and accrued liabilities | 3,326,108 | 3,456,688 |
| Deposits | 1,145,450 | 1,951,220 |
| Deferred revenue (note 6) | 5,030,249 | 5,093,629 |
| Prepaid property taxes | 438,236 | 382,085 |
| Long-term debt (note 7) | 6,897,532 | 7,232,118 |
| Employee future benefit obligations (note 8) | 190,109 | 182,279 |
| 17,027,684 | 18,298,019 | |
| Net financial assets | 690,007 | (104,522) |
| Non-financial assets: | ||
| Tangible capital assets (note 9) | 127,848,055 | 121,817,790 |
| Prepaid expenses | 109,245 | 252,553 |
| 127,957,300 | 122,070,343 | |
| Accumulated surplus (note 10) | $ 128,647,307 | $ 121,965,821 |
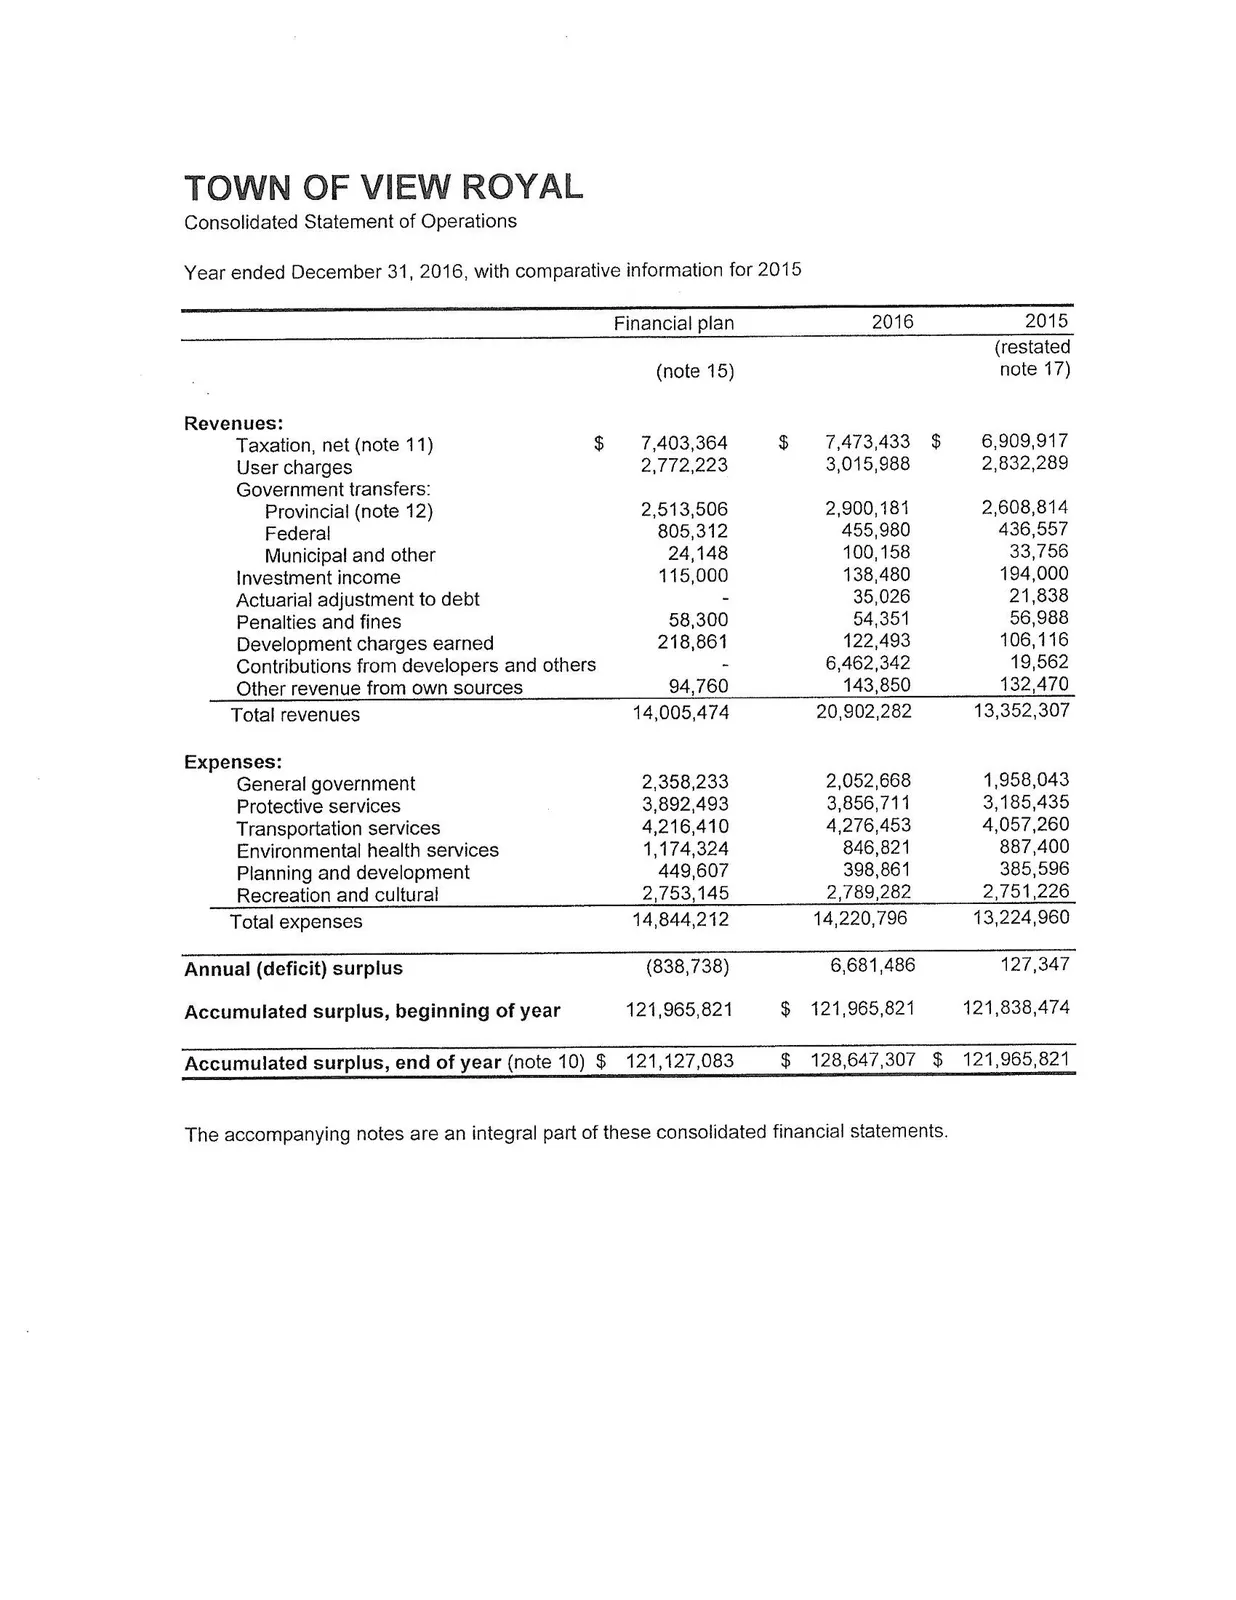
TOWN OF VIEW ROYAL
Consolidated Statement of Operations
Year ended December 31, 2016, with comparative information for 2015
| Financial plan | 2016 | 2015 | |
|---|---|---|---|
| (note 15) | (restated note 17) | ||
| Revenues: | |||
| Taxation, net (note 11) | $ 7,403,364 | $ 7,473,433 | $ 6,909,917 |
| User charges | 2,772,223 | 3,015,988 | 2,832,289 |
| Government transfers: | |||
| Provincial (note 12) | 2,513,506 | 2,900,181 | 2,608,814 |
| Federal | 805,312 | 455,980 | 436,557 |
| Municipal and other | 24,148 | 100,158 | 33,756 |
| Investment income | 115,000 | 138,480 | 194,000 |
| Actuarial adjustment to debt | - | 35,026 | 21,838 |
| Penalties and fines | 58,300 | 54,351 | 56,988 |
| Development charges earned | 218,861 | 122,493 | 106,116 |
| Contributions from developers and others | - | 6,462,342 | 19,562 |
| Other revenue from own sources | 94,760 | 143,850 | 132,470 |
| Total revenues | 14,005,474 | 20,902,282 | 13,352,307 |
| Expenses: | |||
| General government | 2,358,233 | 2,052,668 | 1,958,043 |
| Protective services | 3,892,493 | 3,856,711 | 3,185,435 |
| Transportation services | 4,216,410 | 4,276,453 | 4,057,260 |
| Environmental health services | 1,174,324 | 846,821 | 887,400 |
| Planning and development | 449,607 | 398,861 | 385,596 |
| Recreation and cultural | 2,753,145 | 2,789,282 | 2,751,226 |
| Total expenses | 14,844,212 | 14,220,796 | 13,224,960 |
| Annual (deficit) surplus | (838,738) | 6,681,486 | 127,347 |
| Accumulated surplus, beginning of year | 121,965,821 | $ 121,965,821 | 121,838,474 |
| Accumulated surplus, end of year (note 10) | $ 121,127,083 | $ 128,647,307 | $ 121,965,821 |
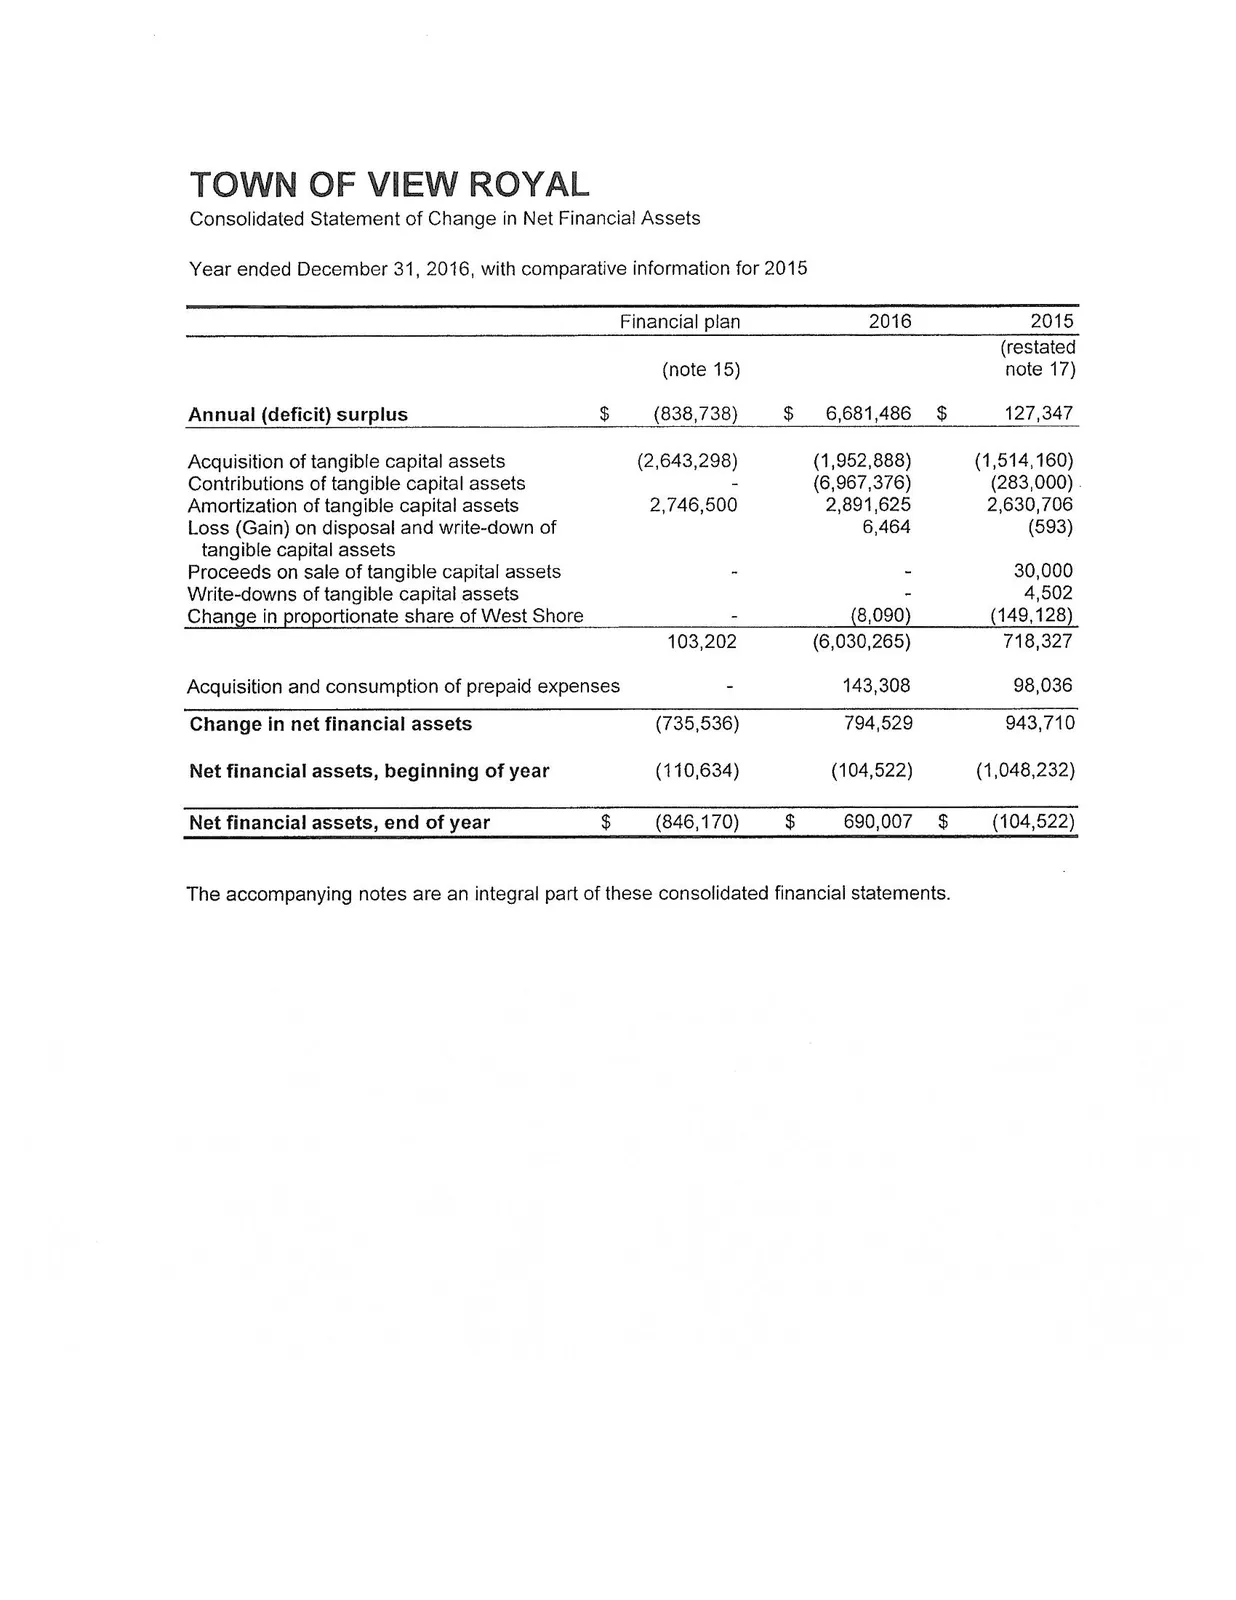
TOWN OF VIEW ROYAL
Consolidated Statement of Change in Net Financial Assets
Year ended December 31, 2016, with comparative information for 2015
| Financial plan | 2016 | 2015 | |
|---|---|---|---|
| (note 15) | (restated note 17) | ||
| Annual (deficit) surplus | $ (838,738) | $ 6,681,486 | $ 127,347 |
| Acquisition of tangible capital assets | (2,643,298) | (1,952,888) | (1,514,160) |
| Contributions of tangible capital assets | - | (6,967,376) | (283,000) |
| Amortization of tangible capital assets | 2,746,500 | 2,891,625 | 2,630,706 |
| Loss (Gain) on disposal and write-down of tangible capital assets | - | 6,464 | (593) |
| Proceeds on sale of tangible capital assets | - | - | 30,000 |
| Write-downs of tangible capital assets | - | - | 4,502 |
| Change in proportionate share of West Shore | - | (8,090) | (149,128) |
| 103,202 | (6,030,265) | 718,327 | |
| Acquisition and consumption of prepaid expenses | - | 143,308 | 98,036 |
| Change in net financial assets | (735,536) | 794,529 | 943,710 |
| Net financial assets, beginning of year | (110,634) | (104,522) | (1,048,232) |
| Net financial assets, end of year | $ (846,170) | $ 690,007 | $ (104,522) |
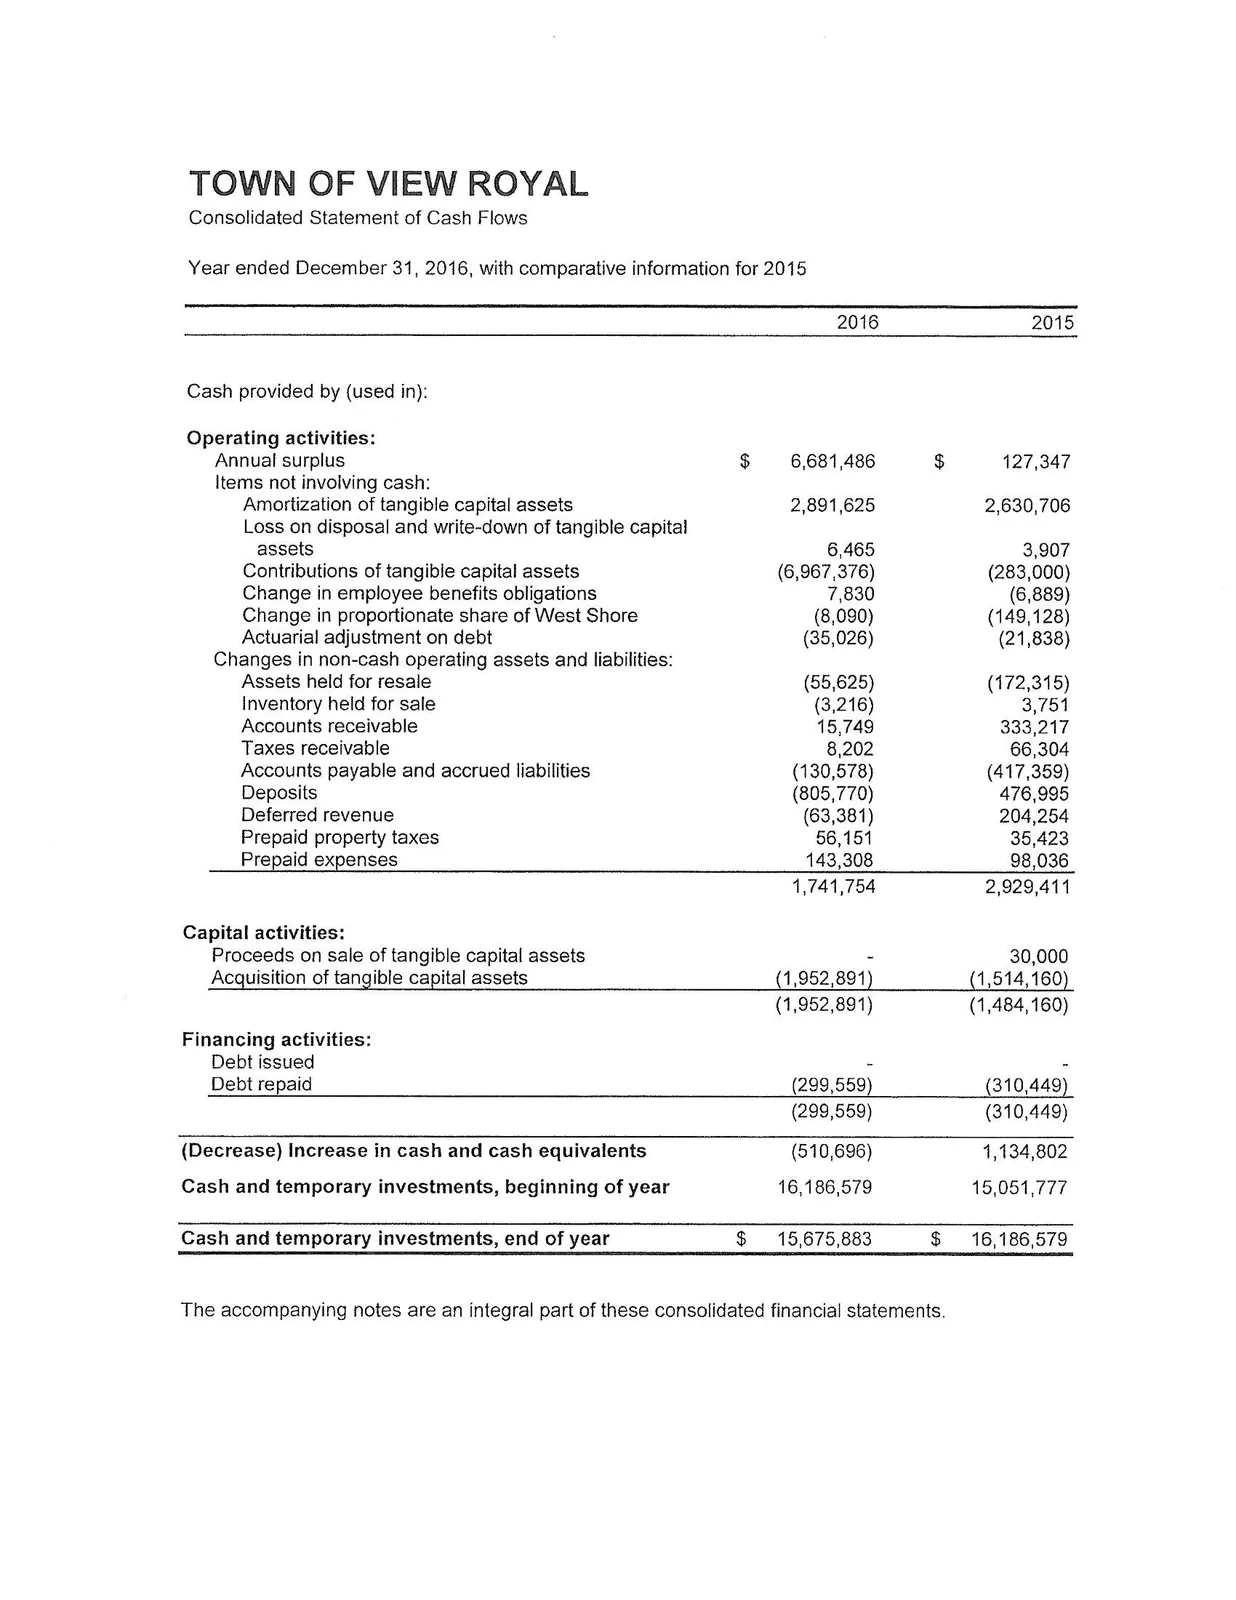
TOWN OF VIEW ROYAL
Consolidated Statement of Cash Flows
Year ended December 31, 2016, with comparative information for 2015
| 2016 | 2015 | |
|---|---|---|
| Cash provided by (used in): | ||
| Operating activities: | ||
| Annual surplus | $ 6,681,486 | $ 127,347 |
| Items not involving cash: | ||
| Amortization of tangible capital assets | 2,891,625 | 2,630,706 |
| Loss on disposal and write-down of tangible capital assets | 6,465 | 3,907 |
| Contributions of tangible capital assets | (6,967,376) | (283,000) |
| Change in employee benefits obligations | 7,830 | (6,889) |
| Change in proportionate share of West Shore | (8,090) | (149,128) |
| Actuarial adjustment on debt | (35,026) | (21,838) |
| Changes in non-cash operating assets and liabilities: | ||
| Assets held for resale | (55,625) | (172,315) |
| Inventory held for sale | (3,216) | 3,751 |
| Accounts receivable | 15,749 | 333,217 |
| Taxes receivable | 8,202 | 66,304 |
| Accounts payable and accrued liabilities | (130,578) | (417,359) |
| Deposits | (805,770) | 476,995 |
| Deferred revenue | (63,381) | 204,254 |
| Prepaid property taxes | 56,151 | 35,423 |
| Prepaid expenses | 143,308 | 98,036 |
| 1,741,754 | 2,929,411 | |
| Capital activities: | ||
| Proceeds on sale of tangible capital assets | - | 30,000 |
| Acquisition of tangible capital assets | (1,952,891) | (1,514,160) |
| (1,952,891) | (1,484,160) | |
| Financing activities: | ||
| Debt issued | - | - |
| Debt repaid | (299,559) | (310,449) |
| (299,559) | (310,449) | |
| (Decrease) Increase in cash and cash equivalents | (510,696) | 1,134,802 |
| Cash and temporary investments, beginning of year | 16,186,579 | 15,051,777 |
| Cash and temporary investments, end of year | $ 15,675,883 | $ 16,186,579 |
TOWN OF VIEW ROYAL
Notes to Consolidated Financial Statements
Year ended December 31, 2016
Town of View Royal (the "Town") is a municipality in the Province of British Columbia and operates under the provisions of the Local Government Act and the Community Charter of British Columbia. The Town's principal activities include the provision of local government services to residents of the incorporated area.
1. Significant accounting policies:
The consolidated financial statements of the Town are prepared by management in accordance with Canadian public sector accounting principles for governments as recommended by the Public Sector Accounting Board ("PSAB") of the Chartered Professional Accountants Canada. Significant accounting policies adopted by the Town are as follows:
(a) Reporting entity: The consolidated financial statements reflect the combination of all the assets, liabilities, revenues, expenses, and changes in fund balances and in financial position of the Town. The consolidated financial statements of the Town include the Town's proportionate interest in West Shore Parks and Recreation Society ("West Shore"), an organization jointly controlled by the Town. The Town does not administer any trust activities on behalf of external parties other than the disbursement of casino revenues to other municipal partners as described in note 12.
(b) Basis of accounting: The Town follows the accrual method of accounting for revenues and expenses. Revenues are normally recognized in the year in which they are earned and measurable. Expenses are recognized as they are incurred and measurable as a result of receipt of goods or services and/or the creation of a legal obligation to pay. Expenses paid in the current period and attributable to a future period are recorded as prepaid.
(c) Revenue recognition: (i) Taxation revenues are recognized at the time of issuing the property tax notices for the fiscal year. (ii) Sale of services and user fee revenues are recognized when the service or product is rendered by the Town and the amounts are received or become receivable. (iii) Grant revenues are recognized when the funding becomes receivable. (iv) Revenue unearned in the current period is recorded as deferred revenue.
(d) Deferred revenue: Deferred revenue includes grants, contributions and other amounts received from third parties pursuant to legislation, regulation and agreement which may only be used in certain programs, in the completion of specific work, or for the purchase of tangible capital assets. In addition, certain user charges and fees are collected for which the related services have yet to be performed. Revenue is recognized in the period when the related expenses are incurred, services performed, or the tangible capital assets are acquired.
Development cost charges are amounts which are restricted by government legislation or agreement with external parties. When qualifying expenses are incurred development cost charges are recognized as revenue in amounts which equal the associated expenses.
(e) Cash and temporary investments: Cash and temporary investments include investments in the Municipal Finance Authority of British Columbia ("MFA") Money Market, Intermediate, and Short-Term Bond that are recorded at cost plus earnings reinvested in the funds, which at December 31, 2016 would approximate market value. These temporary investments consist of cash on deposit in the MFA investment funds that are highly liquid, readily convertible to cash, and are subject to an insignificant risk of change in value.
Investment income is reported as revenue in the period earned. When required by the funding government or related Act, investment income earned on deferred revenue is added to the investment and forms part of the deferred revenue balance.
(f) Deposits: Receipts restricted by third parties are deferred and reported as deposits and are refundable under certain circumstances. Deposits that are prepayments are recognized as revenue when qualifying expenditures are incurred.
(g) Long-term debt: Long-term debt is recorded net of related actuarial adjustments and principal repayments.
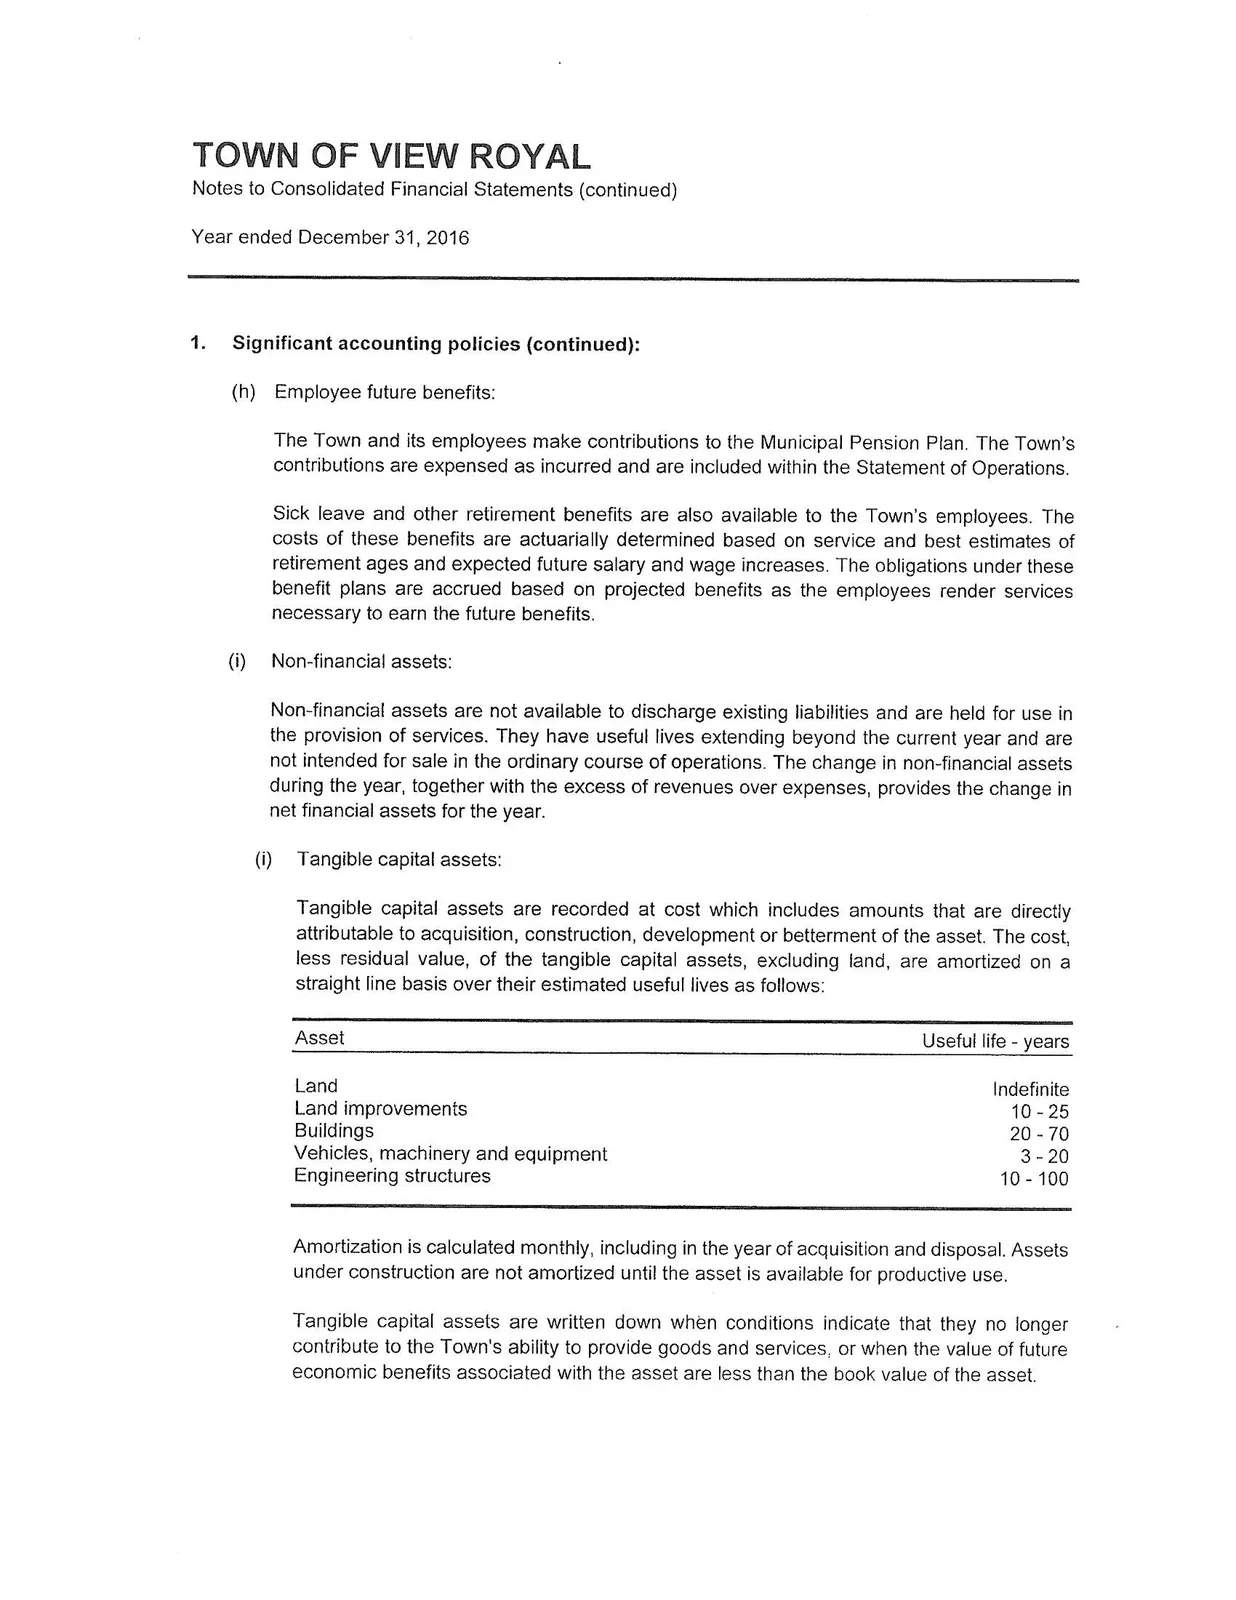
(h) Employee future benefits: The Town and its employees make contributions to the Municipal Pension Plan. The Town’s contributions are expensed as incurred and are included within the Statement of Operations.
Sick leave and other retirement benefits are also available to the Town's employees. The costs of these benefits are actuarially determined based on service and best estimates of retirement ages and expected future salary and wage increases. The obligations under these benefit plans are accrued based on projected benefits as the employees render services necessary to earn the future benefits.
(i) Non-financial assets: Non-financial assets are not available to discharge existing liabilities and are held for use in the provision of services. They have useful lives extending beyond the current year and are not intended for sale in the ordinary course of operations. The change in non-financial assets during the year, together with the excess of revenues over expenses, provides the change in net financial assets for the year.
(i) Tangible capital assets: Tangible capital assets are recorded at cost which includes amounts that are directly attributable to acquisition, construction, development or betterment of the asset. The cost, less residual value, of the tangible capital assets, excluding land, are amortized on a straight line basis over their estimated useful lives as follows:
| Asset | Useful life - years |
|---|---|
| Land | Indefinite |
| Land improvements | 10 - 25 |
| Buildings | 20 - 70 |
| Vehicles, machinery and equipment | 3 - 20 |
| Engineering structures | 10 - 100 |
Amortization is calculated monthly, including in the year of acquisition and disposal. Assets under construction are not amortized until the asset is available for productive use.
Tangible capital assets are written down when conditions indicate that they no longer contribute to the Town's ability to provide goods and services, or when the value of future economic benefits associated with the asset are less than the book value of the asset.
(ii) Contributions of tangible capital assets: Tangible capital assets received as contributions are recorded at their fair value at the date of receipt and also are recorded as revenue.
(iii) Works of art, and historical treasures: The Town manages and controls various works of art and non-operational historical cultural assets including buildings, artifacts, paintings and sculptures located at Town sites and public display areas. These assets are not recorded as tangible capital assets and are not amortized due to the subjectivity of their value.
(iv) Interest capitalization: The Town does not capitalize interest costs associated with the acquisition or construction of a tangible capital asset.
(v) Leased tangible capital assets: Leases which transfer substantially all of the benefits and risks incidental to ownership of property are accounted for as leased tangible capital assets. All other leases are accounted for as operating leases and the related payments are charged to expenses as incurred.
(vi) Inventory: Inventory is recorded at the lower of cost and replacement cost.
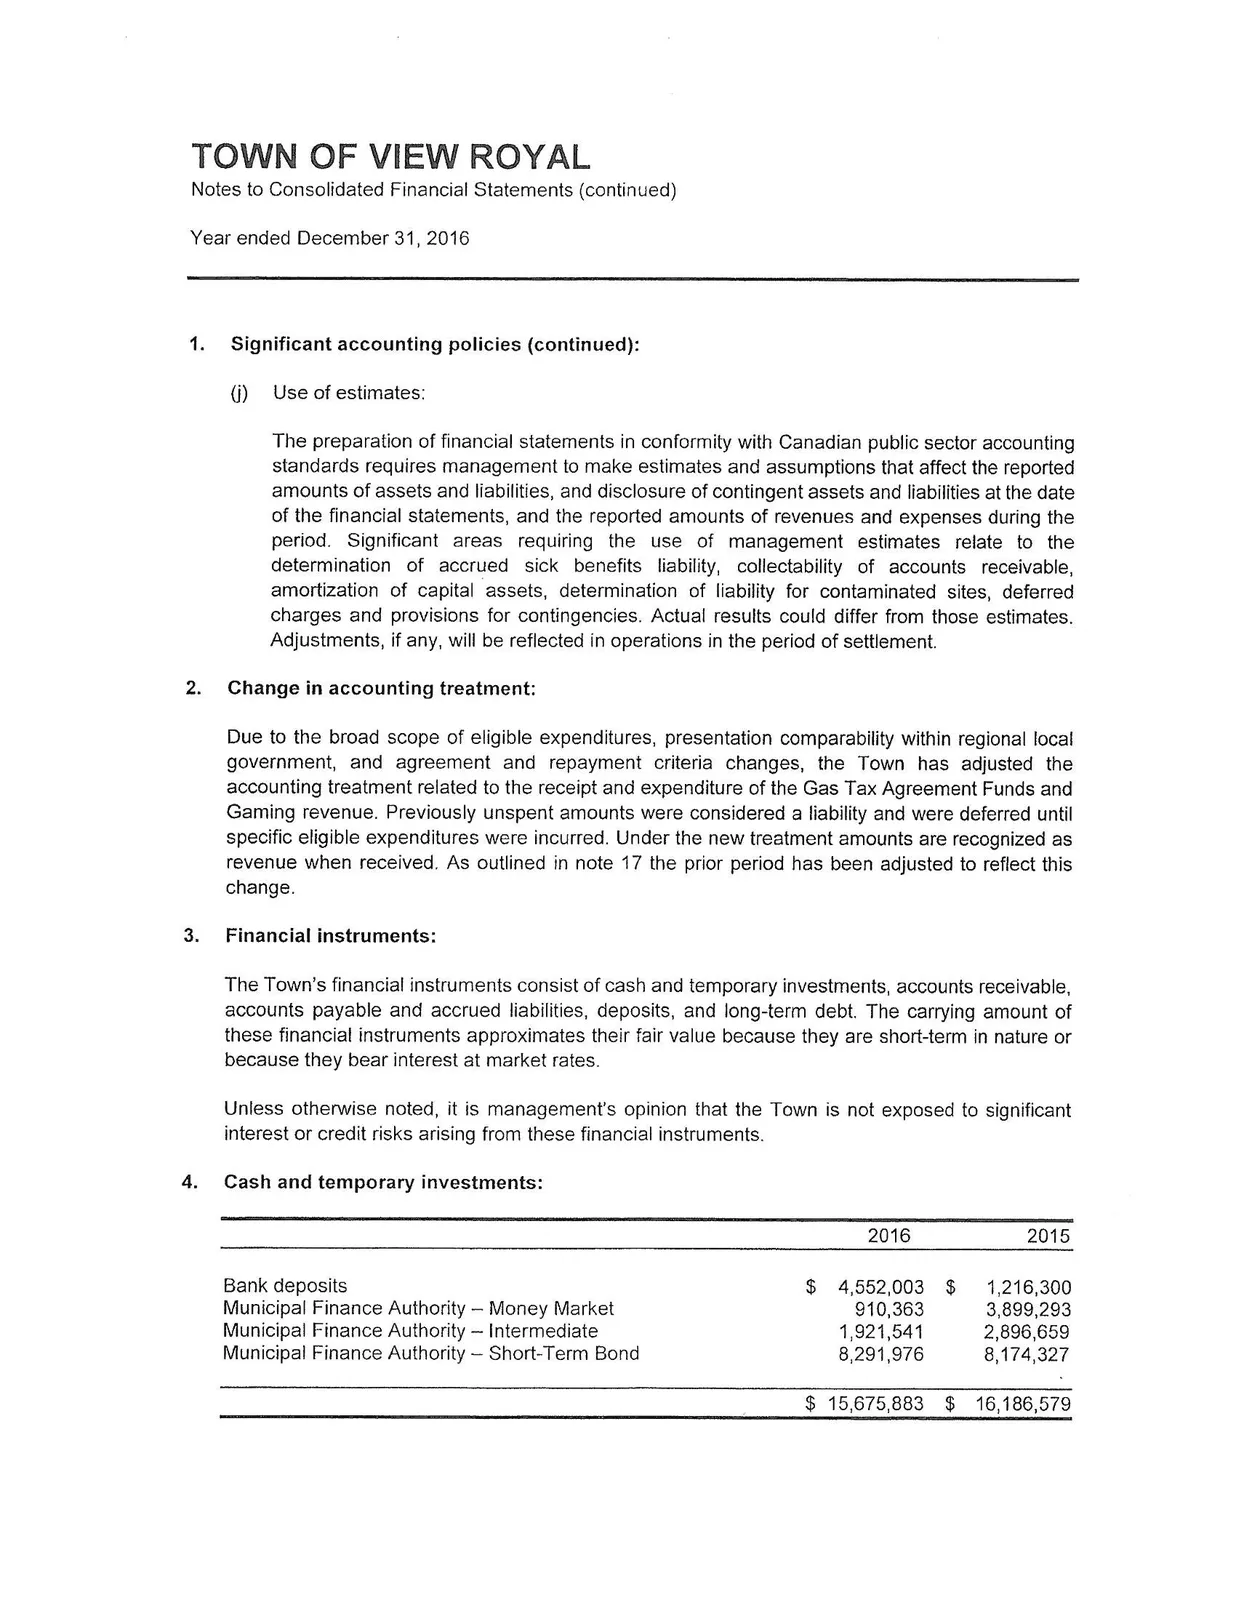
(j) Use of estimates: The preparation of financial statements in conformity with Canadian public sector accounting standards requires management to make estimates and assumptions that affect the reported amounts of assets and liabilities, and disclosure of contingent assets and liabilities at the date of the financial statements, and the reported amounts of revenues and expenses during the period. Significant areas requiring the use of management estimates relate to the determination of accrued sick benefits liability, collectability of accounts receivable, amortization of capital assets, determination of liability for contaminated sites, deferred charges and provisions for contingencies. Actual results could differ from those estimates. Adjustments, if any, will be reflected in operations in the period of settlement.
2. Change in accounting treatment:
Due to the broad scope of eligible expenditures, presentation comparability within regional local government, and agreement and repayment criteria changes, the Town has adjusted the accounting treatment related to the receipt and expenditure of the Gas Tax Agreement Funds and Gaming revenue. Previously unspent amounts were considered a liability and were deferred until specific eligible expenditures were incurred. Under the new treatment amounts are recognized as revenue when received. As outlined in note 17 the prior period has been adjusted to reflect this change.
3. Financial instruments:
The Town's financial instruments consist of cash and temporary investments, accounts receivable, accounts payable and accrued liabilities, deposits, and long-term debt. The carrying amount of these financial instruments approximates their fair value because they are short-term in nature or because they bear interest at market rates.
Unless otherwise noted, it is management's opinion that the Town is not exposed to significant interest or credit risks arising from these financial instruments.
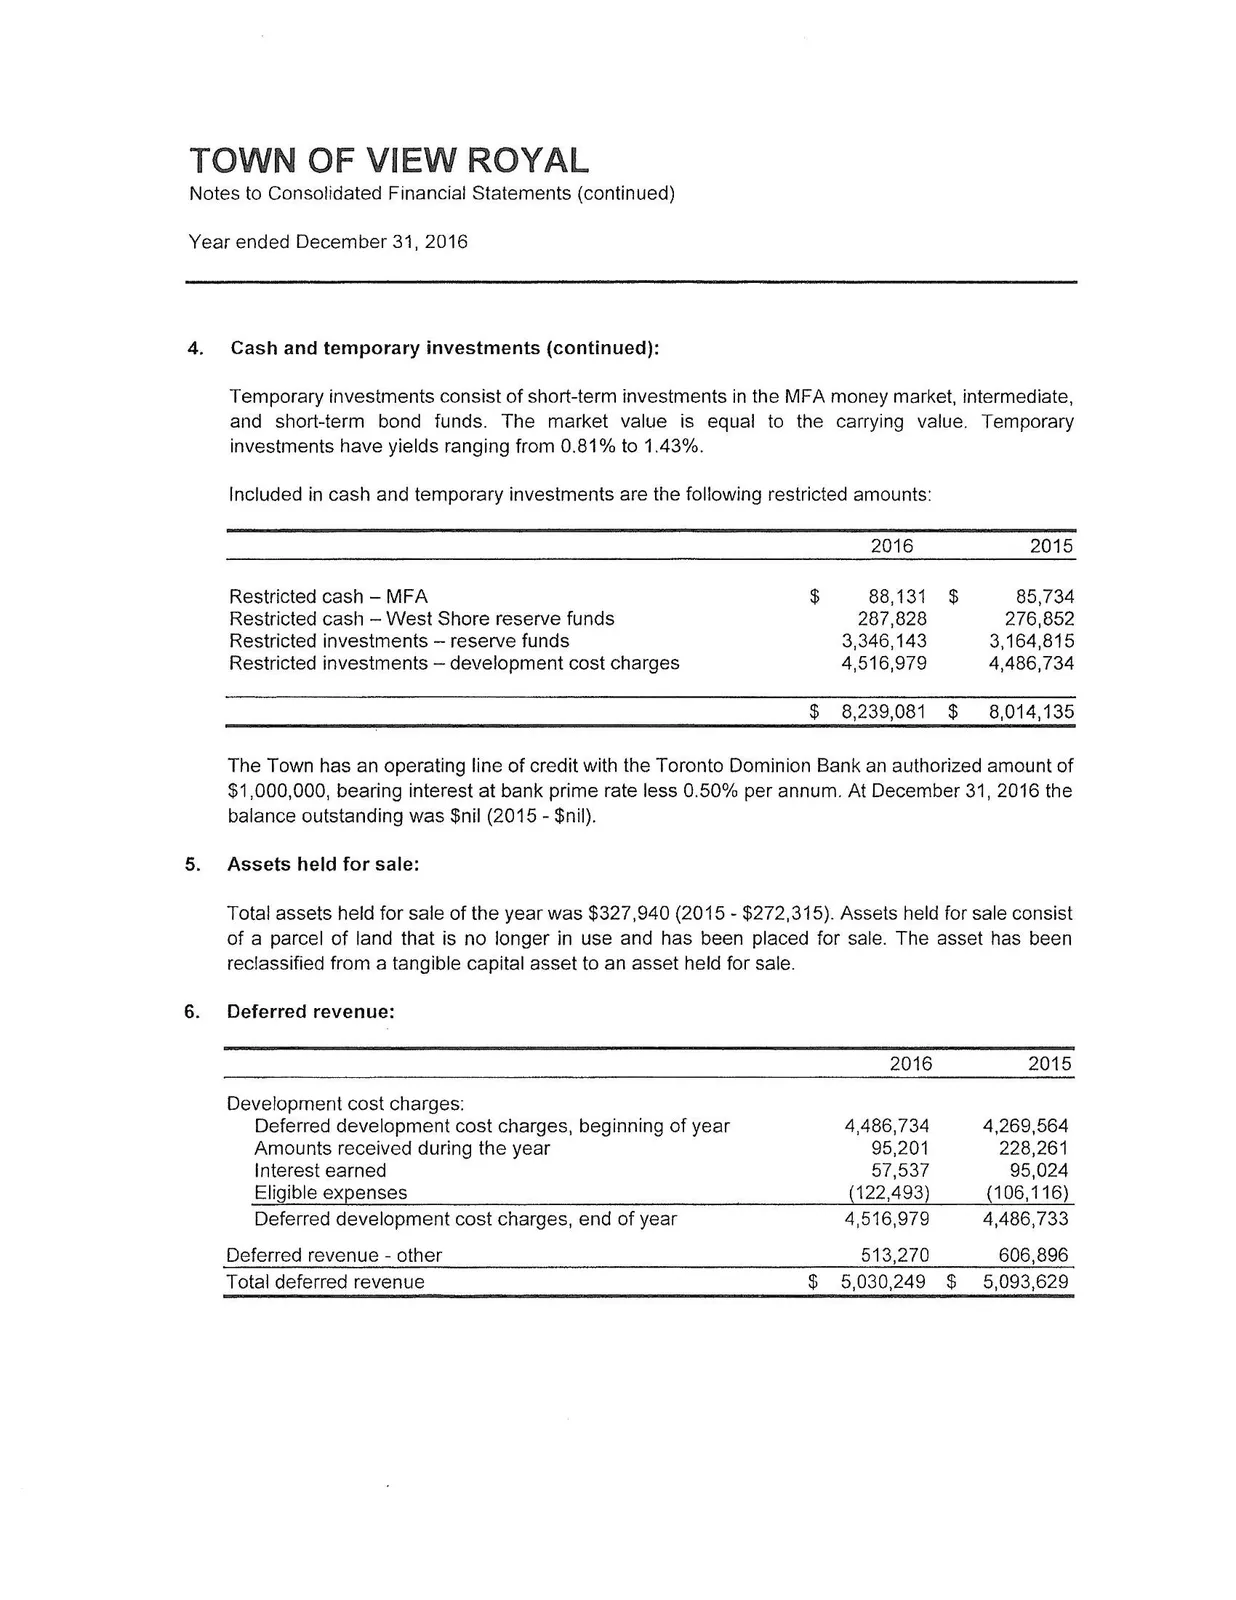
4. Cash and temporary investments:
| 2016 | 2015 | |
|---|---|---|
| Bank deposits | $ 4,552,003 | $ 1,216,300 |
| Municipal Finance Authority – Money Market | 910,363 | 3,899,293 |
| Municipal Finance Authority – Intermediate | 1,921,541 | 2,896,659 |
| Municipal Finance Authority – Short-Term Bond | 8,291,976 | 8,174,327 |
| $ 15,675,883 | $ 16,186,579 |
Temporary investments consist of short-term investments in the MFA money market, intermediate, and short-term bond funds. The market value is equal to the carrying value. Temporary investments have yields ranging from 0.81% to 1.43%.
Included in cash and temporary investments are the following restricted amounts:
| 2016 | 2015 | |
|---|---|---|
| Restricted cash – MFA | $ 88,131 | $ 85,734 |
| Restricted cash – West Shore reserve funds | 287,828 | 276,852 |
| Restricted investments – reserve funds | 3,346,143 | 3,164,815 |
| Restricted investments – development cost charges | 4,516,979 | 4,486,734 |
| $ 8,239,081 | $ 8,014,135 |
The Town has an operating line of credit with the Toronto Dominion Bank an authorized amount of $1,000,000, bearing interest at bank prime rate less 0.50% per annum. At December 31, 2016 the balance outstanding was $nil (2015 - $nil).
5. Assets held for sale:
Total assets held for sale of the year was $327,940 (2015 - $272,315). Assets held for sale consist of a parcel of land that is no longer in use and has been placed for sale. The asset has been reclassified from a tangible capital asset to an asset held for sale.
6. Deferred revenue:
| 2016 | 2015 | |
|---|---|---|
| Development cost charges: | ||
| Deferred development cost charges, beginning of year | 4,486,734 | 4,269,564 |
| Amounts received during the year | 95,201 | 228,261 |
| Interest earned | 57,537 | 95,024 |
| Eligible expenses | (122,493) | (106,116) |
| Deferred development cost charges, end of year | 4,516,979 | 4,486,733 |
| Deferred revenue - other | 513,270 | 606,896 |
| Total deferred revenue | $ 5,030,249 | $ 5,093,629 |
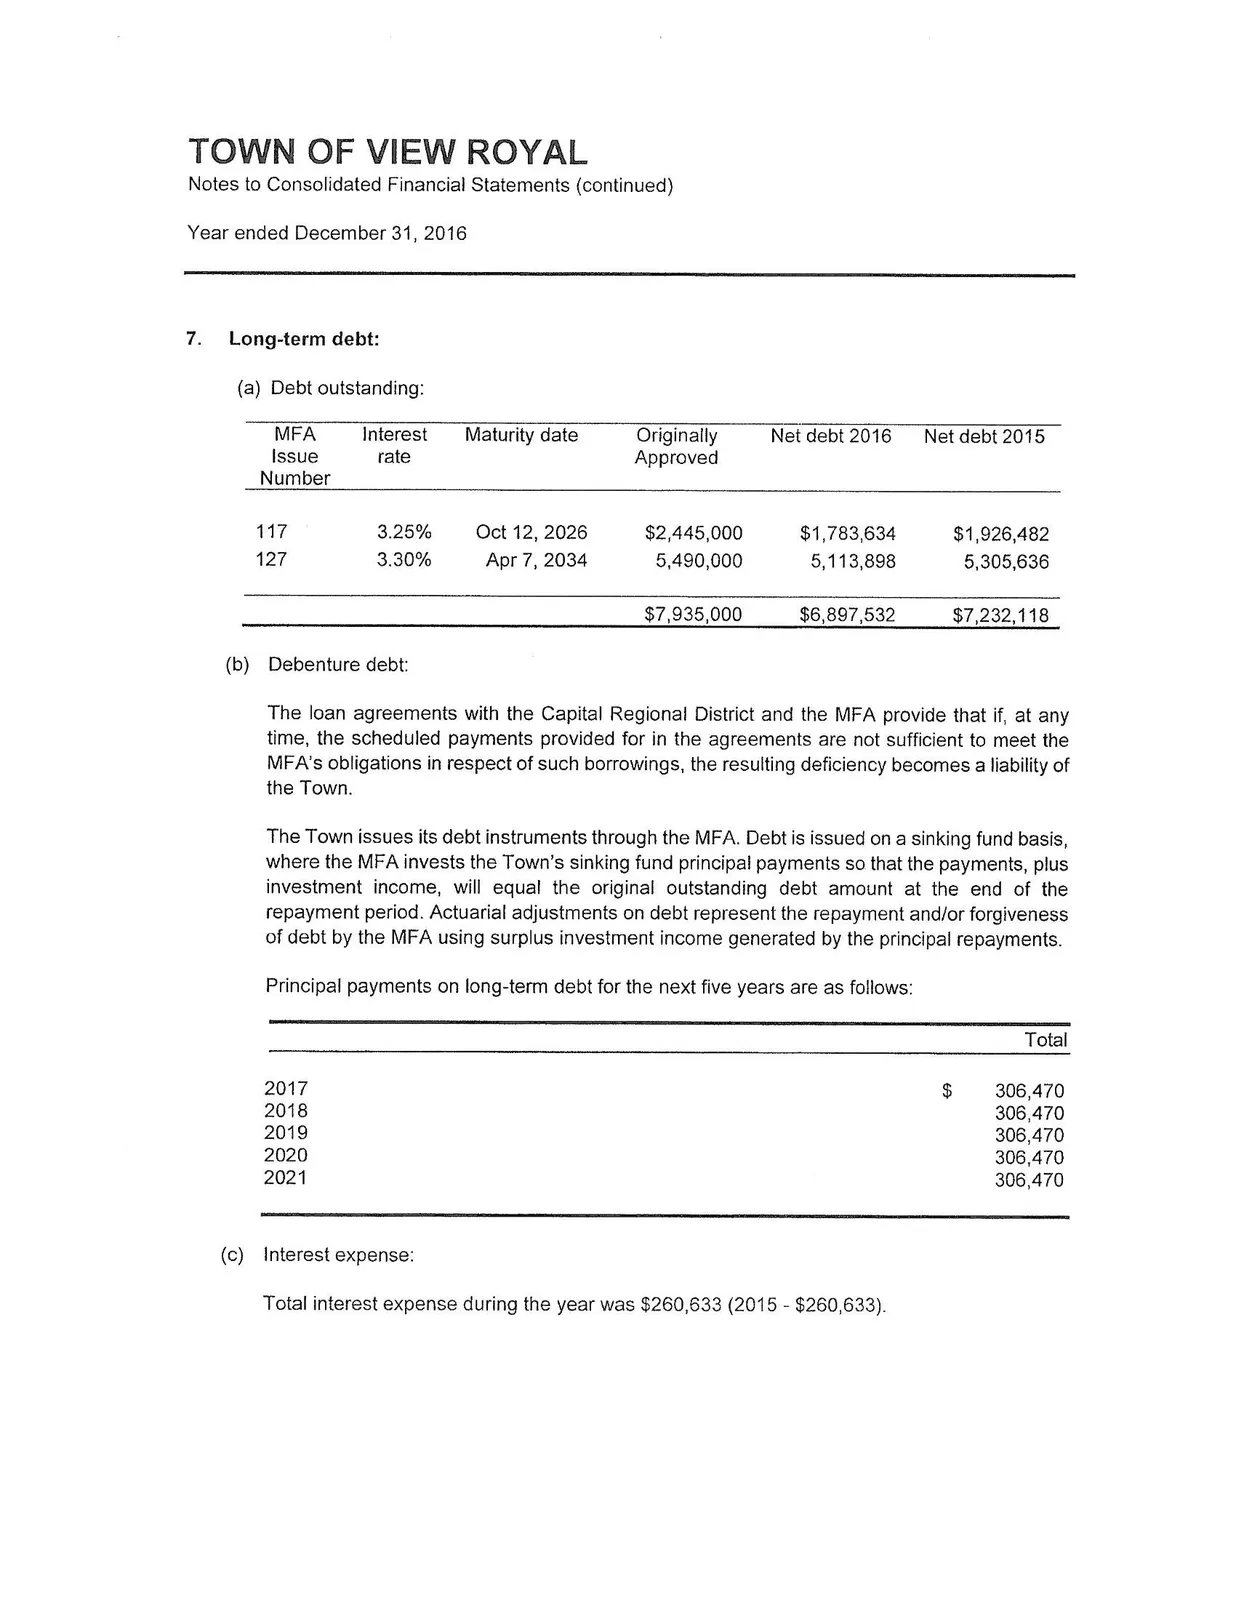
7. Long-term debt:
(a) Debt outstanding:
| MFA Issue Number | Interest rate | Maturity date | Originally Approved | Net debt 2016 | Net debt 2015 |
|---|---|---|---|---|---|
| 117 | 3.25% | Oct 12, 2026 | $2,445,000 | $1,783,634 | $1,926,482 |
| 127 | 3.30% | Apr 7, 2034 | 5,490,000 | 5,113,898 | 5,305,636 |
| $7,935,000 | $6,897,532 | $7,232,118 |
(b) Debenture debt: The loan agreements with the Capital Regional District and the MFA provide that if, at any time, the scheduled payments provided for in the agreements are not sufficient to meet the MFA's obligations in respect of such borrowings, the resulting deficiency becomes a liability of the Town.
The Town issues its debt instruments through the MFA. Debt is issued on a sinking fund basis, where the MFA invests the Town's sinking fund principal payments so that the payments, plus investment income, will equal the original outstanding debt amount at the end of the repayment period. Actuarial adjustments on debt represent the repayment and/or forgiveness of debt by the MFA using surplus investment income generated by the principal repayments.
Principal payments on long-term debt for the next five years are as follows:
| Year | Total |
|---|---|
| 2017 | $ 306,470 |
| 2018 | 306,470 |
| 2019 | 306,470 |
| 2020 | 306,470 |
| 2021 | 306,470 |
(c) Interest expense: Total interest expense during the year was $260,633 (2015 - $260,633).
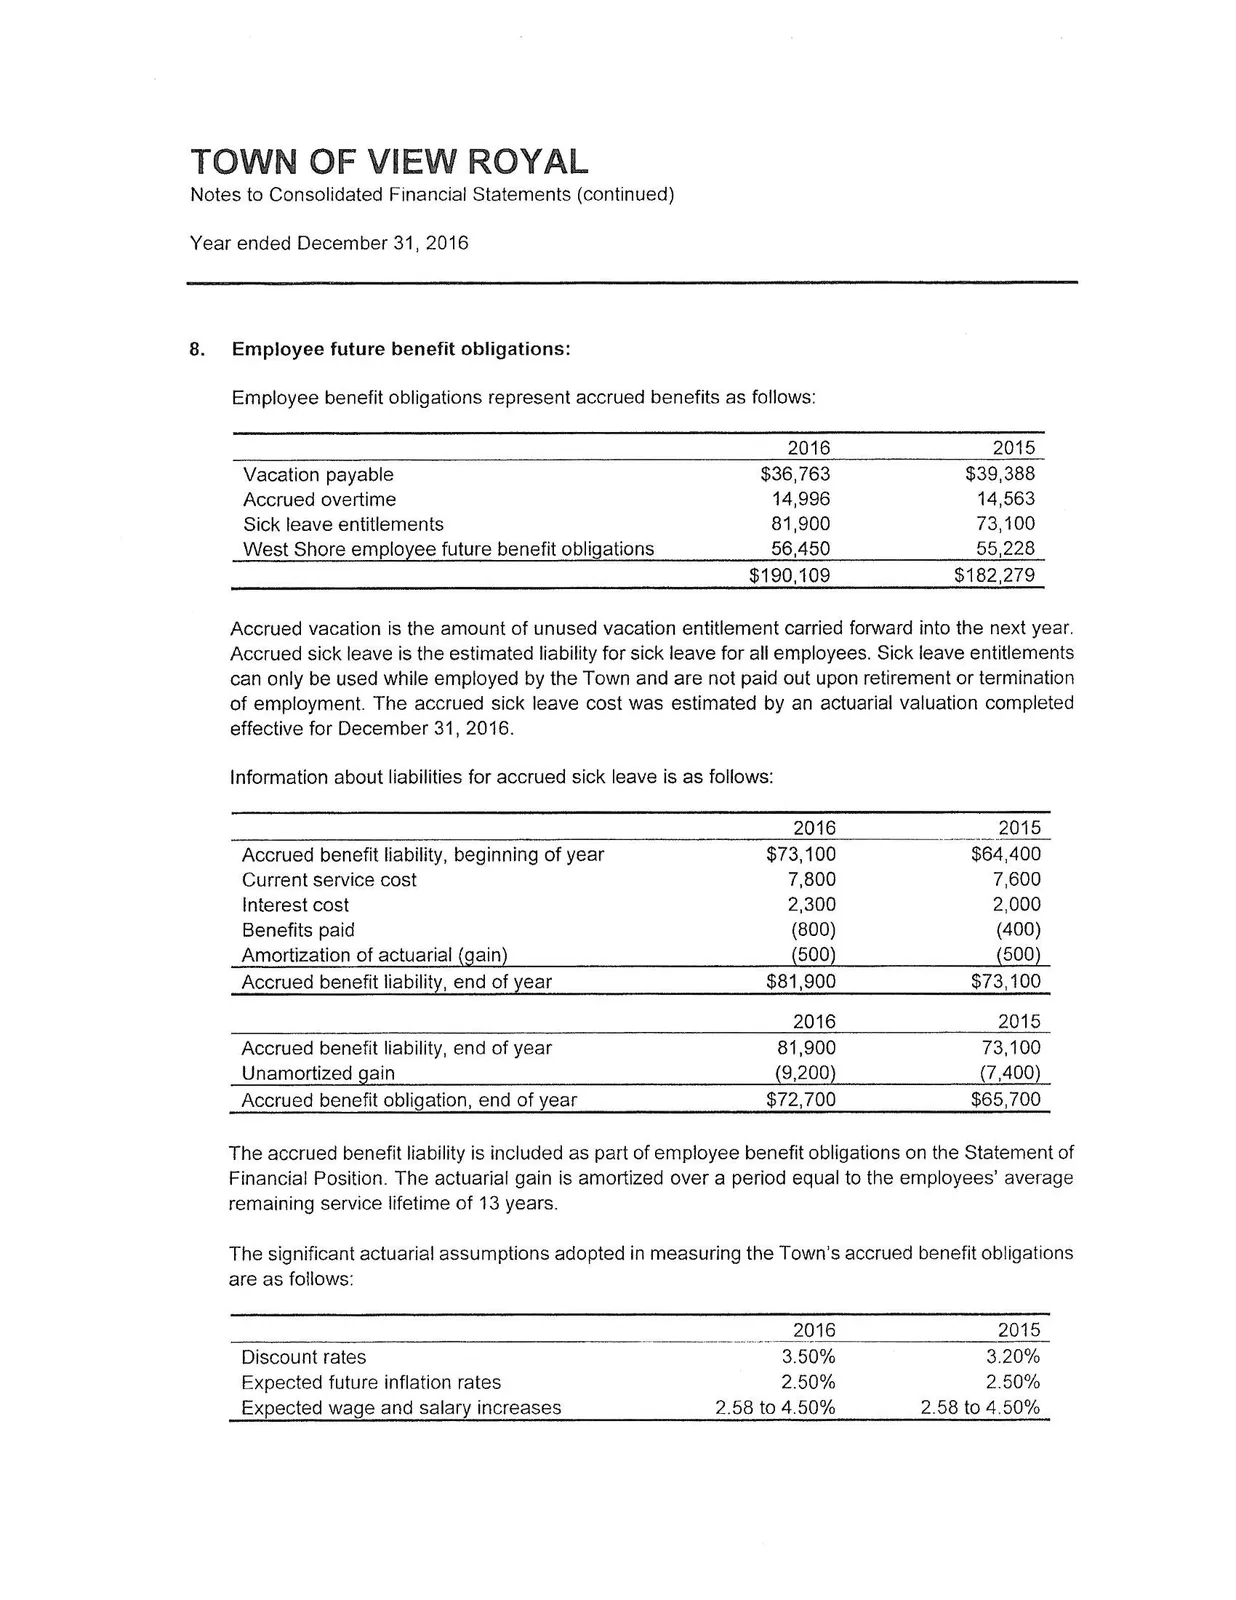
8. Employee future benefit obligations:
Employee benefit obligations represent accrued benefits as follows:
| 2016 | 2015 | |
|---|---|---|
| Vacation payable | $36,763 | $39,388 |
| Accrued overtime | 14,996 | 14,563 |
| Sick leave entitlements | 81,900 | 73,100 |
| West Shore employee future benefit obligations | 56,450 | 55,228 |
| $190,109 | $182,279 |
Accrued vacation is the amount of unused vacation entitlement carried forward into the next year. Accrued sick leave is the estimated liability for sick leave for all employees. Sick leave entitlements can only be used while employed by the Town and are not paid out upon retirement or termination of employment. The accrued sick leave cost was estimated by an actuarial valuation completed effective for December 31, 2016.
Information about liabilities for accrued sick leave is as follows:
| 2016 | 2015 | |
|---|---|---|
| Accrued benefit liability, beginning of year | $73,100 | $64,400 |
| Current service cost | 7,800 | 7,600 |
| Interest cost | 2,300 | 2,000 |
| Benefits paid | (800) | (400) |
| Amortization of actuarial (gain) | (500) | (500) |
| Accrued benefit liability, end of year | $81,900 | $73,100 |
| 2016 | 2015 | |
|---|---|---|
| Accrued benefit liability, end of year | 81,900 | 73,100 |
| Unamortized gain | (9,200) | (7,400) |
| Accrued benefit obligation, end of year | $72,700 | $65,700 |
The accrued benefit liability is included as part of employee benefit obligations on the Statement of Financial Position. The actuarial gain is amortized over a period equal to the employees' average remaining service lifetime of 13 years.
The significant actuarial assumptions adopted in measuring the Town's accrued benefit obligations are as follows:
| 2016 | 2015 | |
|---|---|---|
| Discount rates | 3.50% | 3.20% |
| Expected future inflation rates | 2.50% | 2.50% |
| Expected wage and salary increases | 2.58 to 4.50% | 2.58 to 4.50% |
Municipal Pension Plan: The Town and its employees contribute to the Municipal Pension Plan (the Plan), a jointly trusteed pension plan. The board of trustees, representing plan members and employers, is responsible for administering the Plan, including investment of assets and administration of benefits. The Plan is a multi-employer defined benefit pension plan. Basic pension benefits provided are based on a formula. As at December 31, 2015 the plan has about 189,000 active members and approximately 85,000 retired members. Active members include approximately 37,000 contributors from local government and 31 contributors from the Town.
Every three years, an actuarial valuation is performed to assess the financial position of the plan and adequacy of plan funding. The actuary determines an appropriate combined employer and member contribution rate to fund the plan. The actuary's calculated contribution rate is based on the entry-age normal cost method, which produces the long-term rate of member and employer contributions sufficient to provide benefits for average future entrants to the plan. This rate is then adjusted to the extent there is amortization of any funding deficit.
The most recent actuarial valuation of the Municipal Pension Plan as of December 31, 2015, indicated a $2,224 million funding surplus for basic pension benefits on a going concern basis.
The Town paid $240,117 (2015 - $233,545) for employer contributions while Town employees contributed $207,513 (2015 - $203,733) to the plan in fiscal 2016.
The next valuation will be as at December 31, 2018 with results available in 2019.
Employers participating in the Plan record their pension expense as the amount of employer contributions made during the fiscal year (defined contribution pension plan accounting). This is because the Plan records accrued liabilities and accrued assets for the Plan in aggregate, resulting in no consistent and reliable basis for allocating the obligation, assets and cost to the individual employers participating in the Plan.
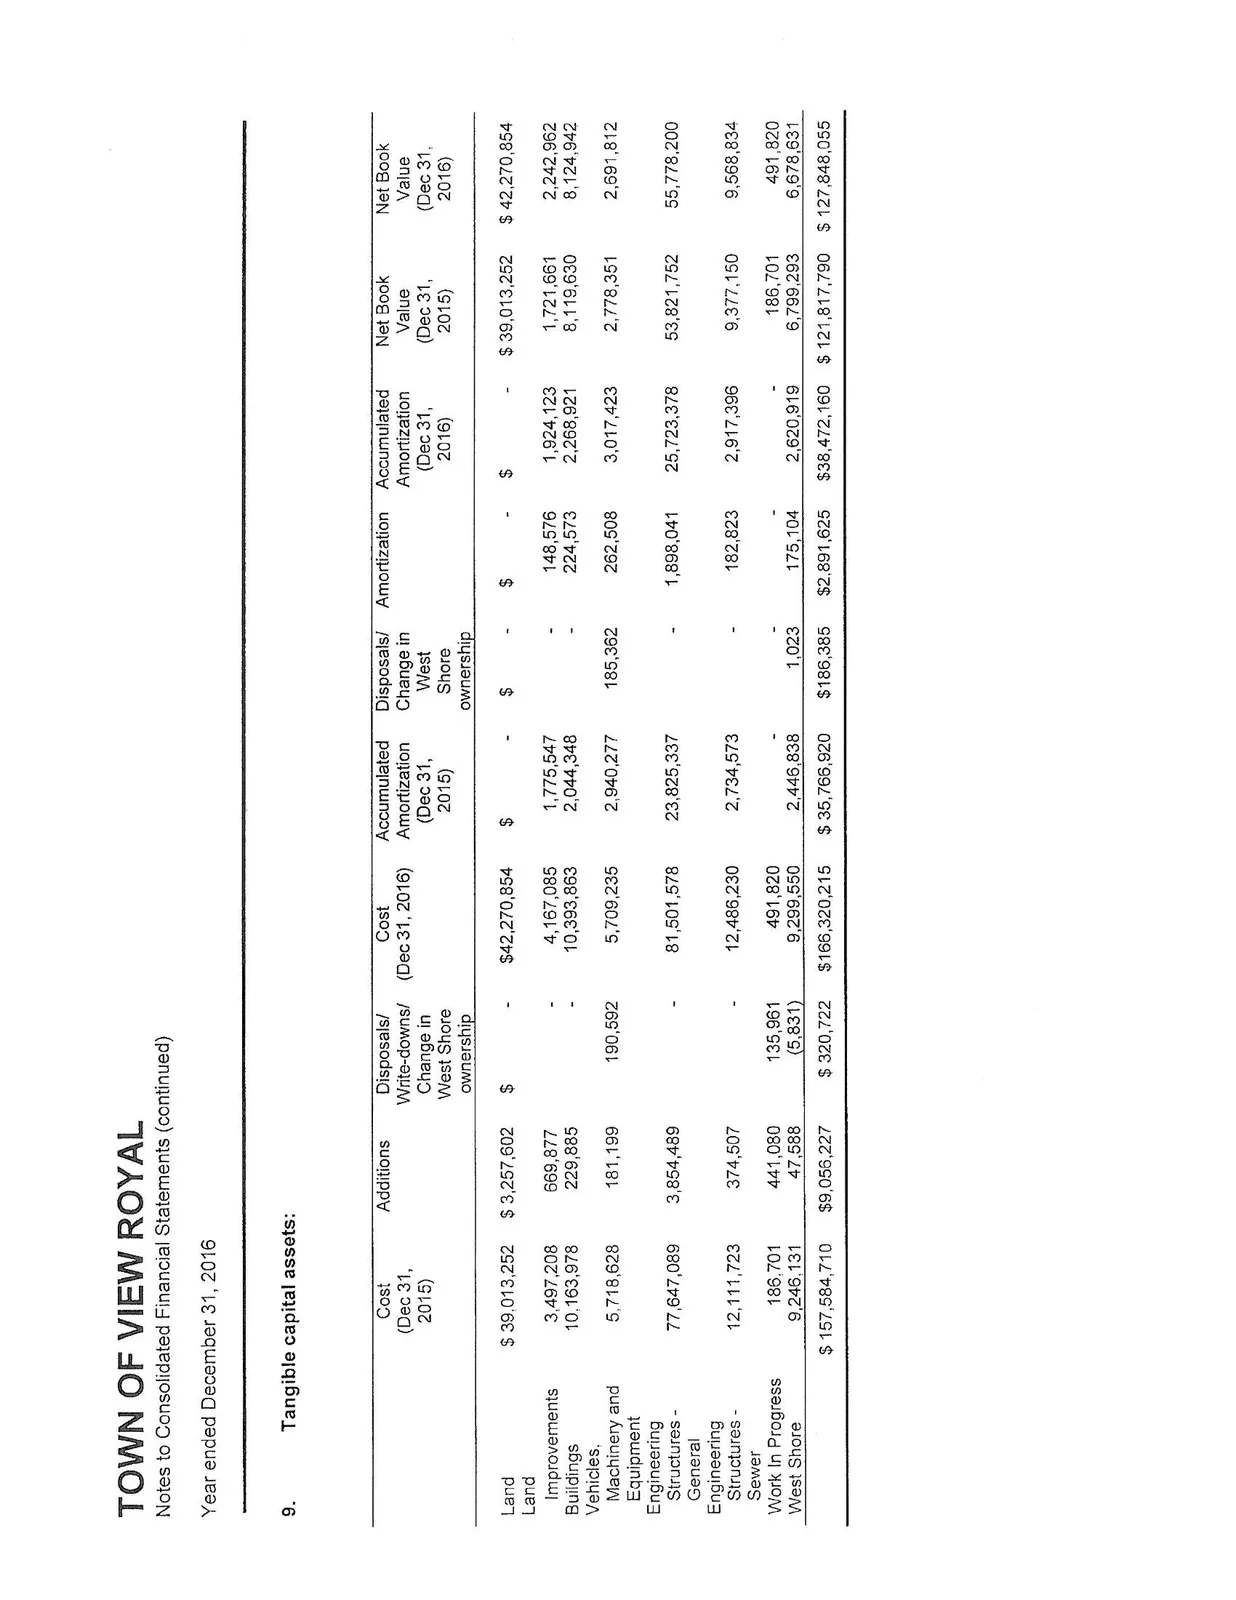
9. Tangible capital assets:
| Cost (Dec 31, 2015) | Additions | Disposals/ Write-downs/ Change in West Shore ownership | Cost (Dec 31, 2016) | Accumulated Amortization (Dec 31, 2015) | Disposals/ Change in West Shore ownership | Amortization | Accumulated Amortization (Dec 31, 2016) | Net Book Value (Dec 31, 2015) | Net Book Value (Dec 31, 2016) | |
|---|---|---|---|---|---|---|---|---|---|---|
| Land | $ 39,013,252 | $ 3,257,602 | $ - | $ 42,270,854 | $ - | $ - | $ - | $ - | $ 39,013,252 | $ 42,270,854 |
| Improvements | 3,497,208 | 669,877 | - | 4,167,085 | 1,775,547 | - | 148,576 | 1,924,123 | 1,721,661 | 2,242,962 |
| Buildings | 10,163,978 | 229,885 | - | 10,393,863 | 2,044,348 | - | 224,573 | 2,268,921 | 8,119,630 | 8,124,942 |
| Vehicles, Machinery and Equipment | 5,718,628 | 181,199 | 190,592 | 5,709,235 | 2,940,277 | 185,362 | 262,508 | 3,017,423 | 2,778,351 | 2,691,812 |
| Engineering Structures - General | 77,647,089 | 3,854,489 | - | 81,501,578 | 23,825,337 | - | 1,898,041 | 25,723,378 | 53,821,752 | 55,778,200 |
| Engineering Structures - Sewer | 12,111,723 | 374,507 | - | 12,486,230 | 2,734,573 | - | 182,823 | 2,917,396 | 9,377,150 | 9,568,834 |
| Work In Progress | 186,701 | 441,080 | 135,961 | 491,820 | - | - | - | - | 186,701 | 491,820 |
| West Shore | 9,246,131 | 47,588 | (5,831) | 9,299,550 | 2,446,838 | 1,023 | 175,104 | 2,620,919 | 6,799,293 | 6,678,631 |
| $ 157,584,710 | $ 9,056,227 | $ 320,722 | $ 166,320,215 | $ 35,766,920 | $ 186,385 | $ 2,891,625 | $ 38,472,160 | $ 121,817,790 | $ 127,848,055 |
(a) Assets under construction and completed assets not yet in service: Assets under construction totaling $491,820 (2015 - $186,701) have not been amortized. Amortization of these assets will commence when the asset is put into service.
(b) Contributed tangible capital assets: Contributed tangible capital assets have been recognized at fair market value at the date of contribution. The value of contributed capital assets received during the year is $6,967,376 (2015 - $283,000).
(c) Tangible capital assets disclosed at nominal values: Where an estimate of fair value could not be made, the tangible capital asset has been recognized at a nominal value.
(d) Write-down of tangible capital assets: The write-down of tangible capital assets during the year was $nil (2015 - $nil).
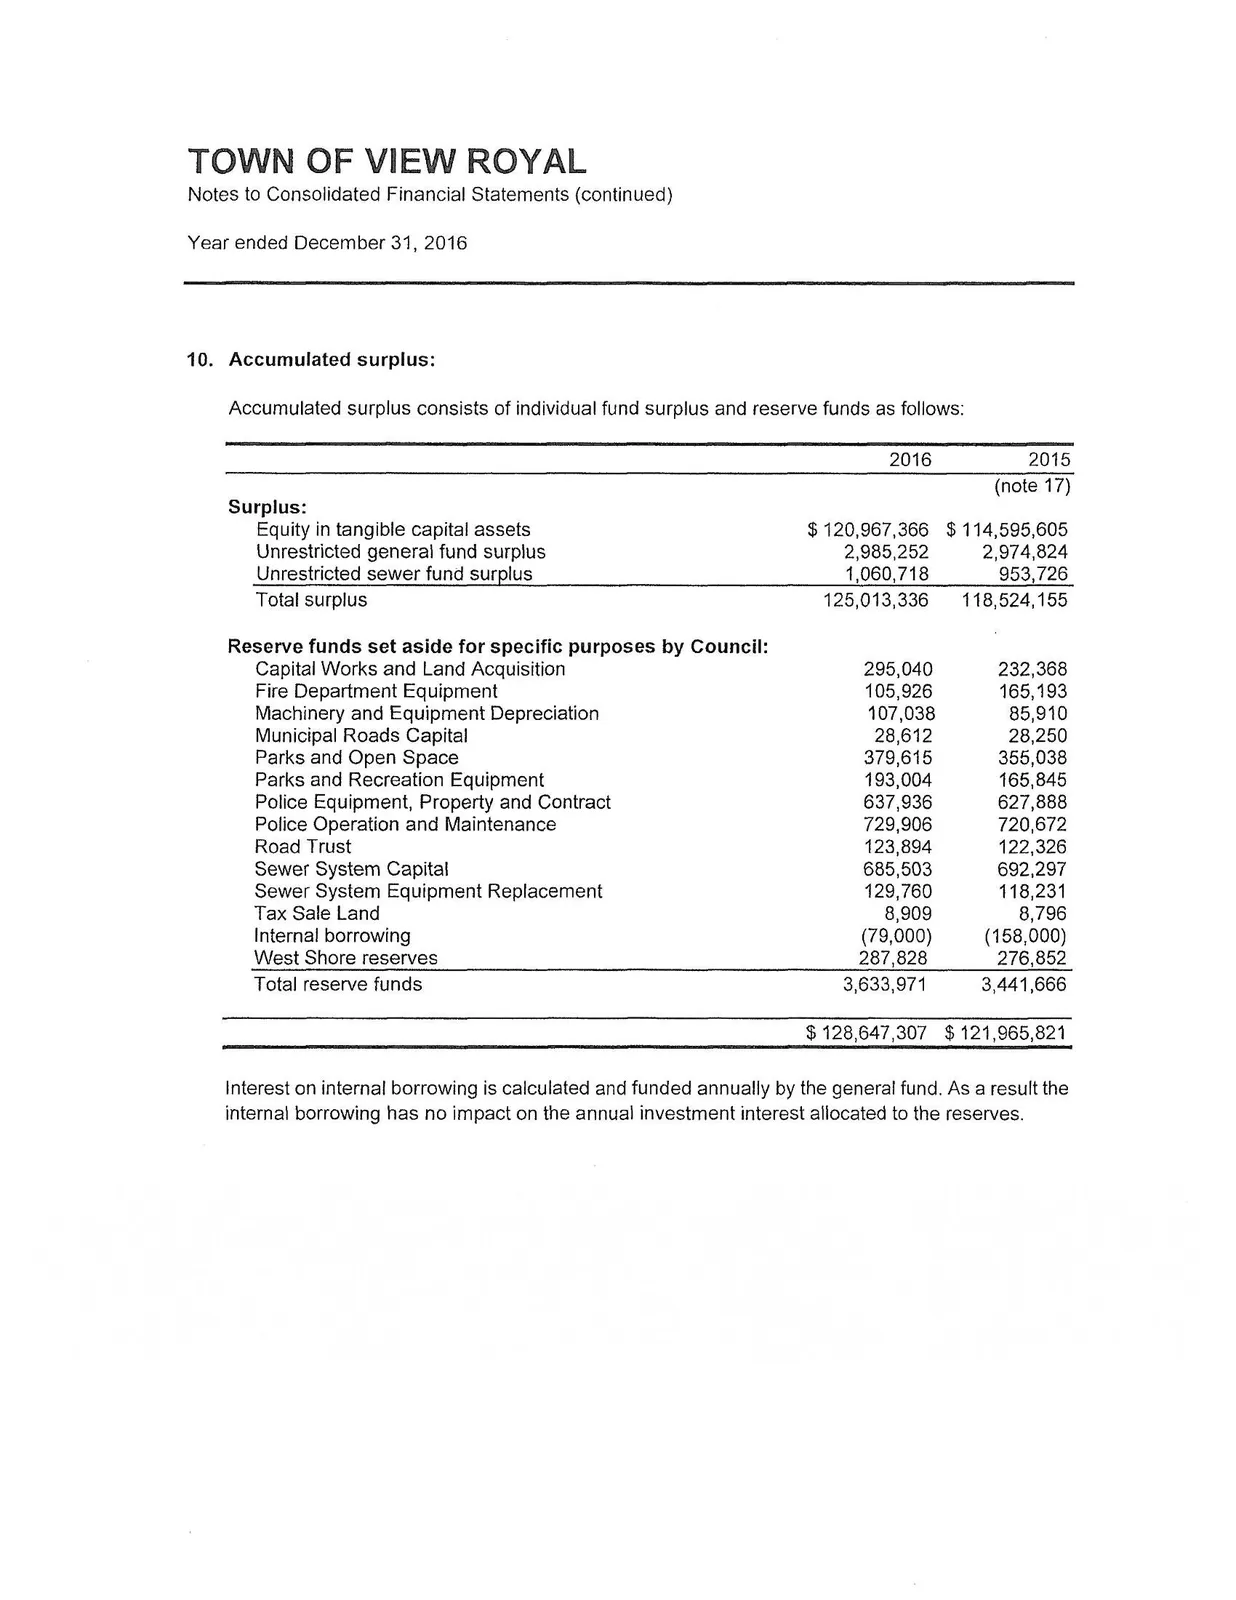
10. Accumulated surplus:
Accumulated surplus consists of individual fund surplus and reserve funds as follows:
| 2016 | 2015 | |
|---|---|---|
| (note 17) | ||
| Surplus: | ||
| Equity in tangible capital assets | $ 120,967,366 | $ 114,595,605 |
| Unrestricted general fund surplus | 2,985,252 | 2,974,824 |
| Unrestricted sewer fund surplus | 1,060,718 | 953,726 |
| Total surplus | 125,013,336 | 118,524,155 |
| Reserve funds set aside for specific purposes by Council: | ||
| Capital Works and Land Acquisition | 295,040 | 232,368 |
| Fire Department Equipment | 105,926 | 165,193 |
| Machinery and Equipment Depreciation | 107,038 | 85,910 |
| Municipal Roads Capital | 28,612 | 28,250 |
| Parks and Open Space | 379,615 | 355,038 |
| Parks and Recreation Equipment | 193,004 | 165,845 |
| Police Equipment, Property and Contract | 637,936 | 627,888 |
| Police Operation and Maintenance | 729,906 | 720,672 |
| Road Trust | 123,894 | 122,326 |
| Sewer System Capital | 685,503 | 692,297 |
| Sewer System Equipment Replacement | 129,760 | 118,231 |
| Tax Sale Land | 8,909 | 8,796 |
| Internal borrowing | (79,000) | (158,000) |
| West Shore reserves | 287,828 | 276,852 |
| Total reserve funds | 3,633,971 | 3,441,666 |
| $ 128,647,307 | $ 121,965,821 |
Interest on internal borrowing is calculated and funded annually by the general fund. As a result the internal borrowing has no impact on the annual investment interest allocated to the reserves.
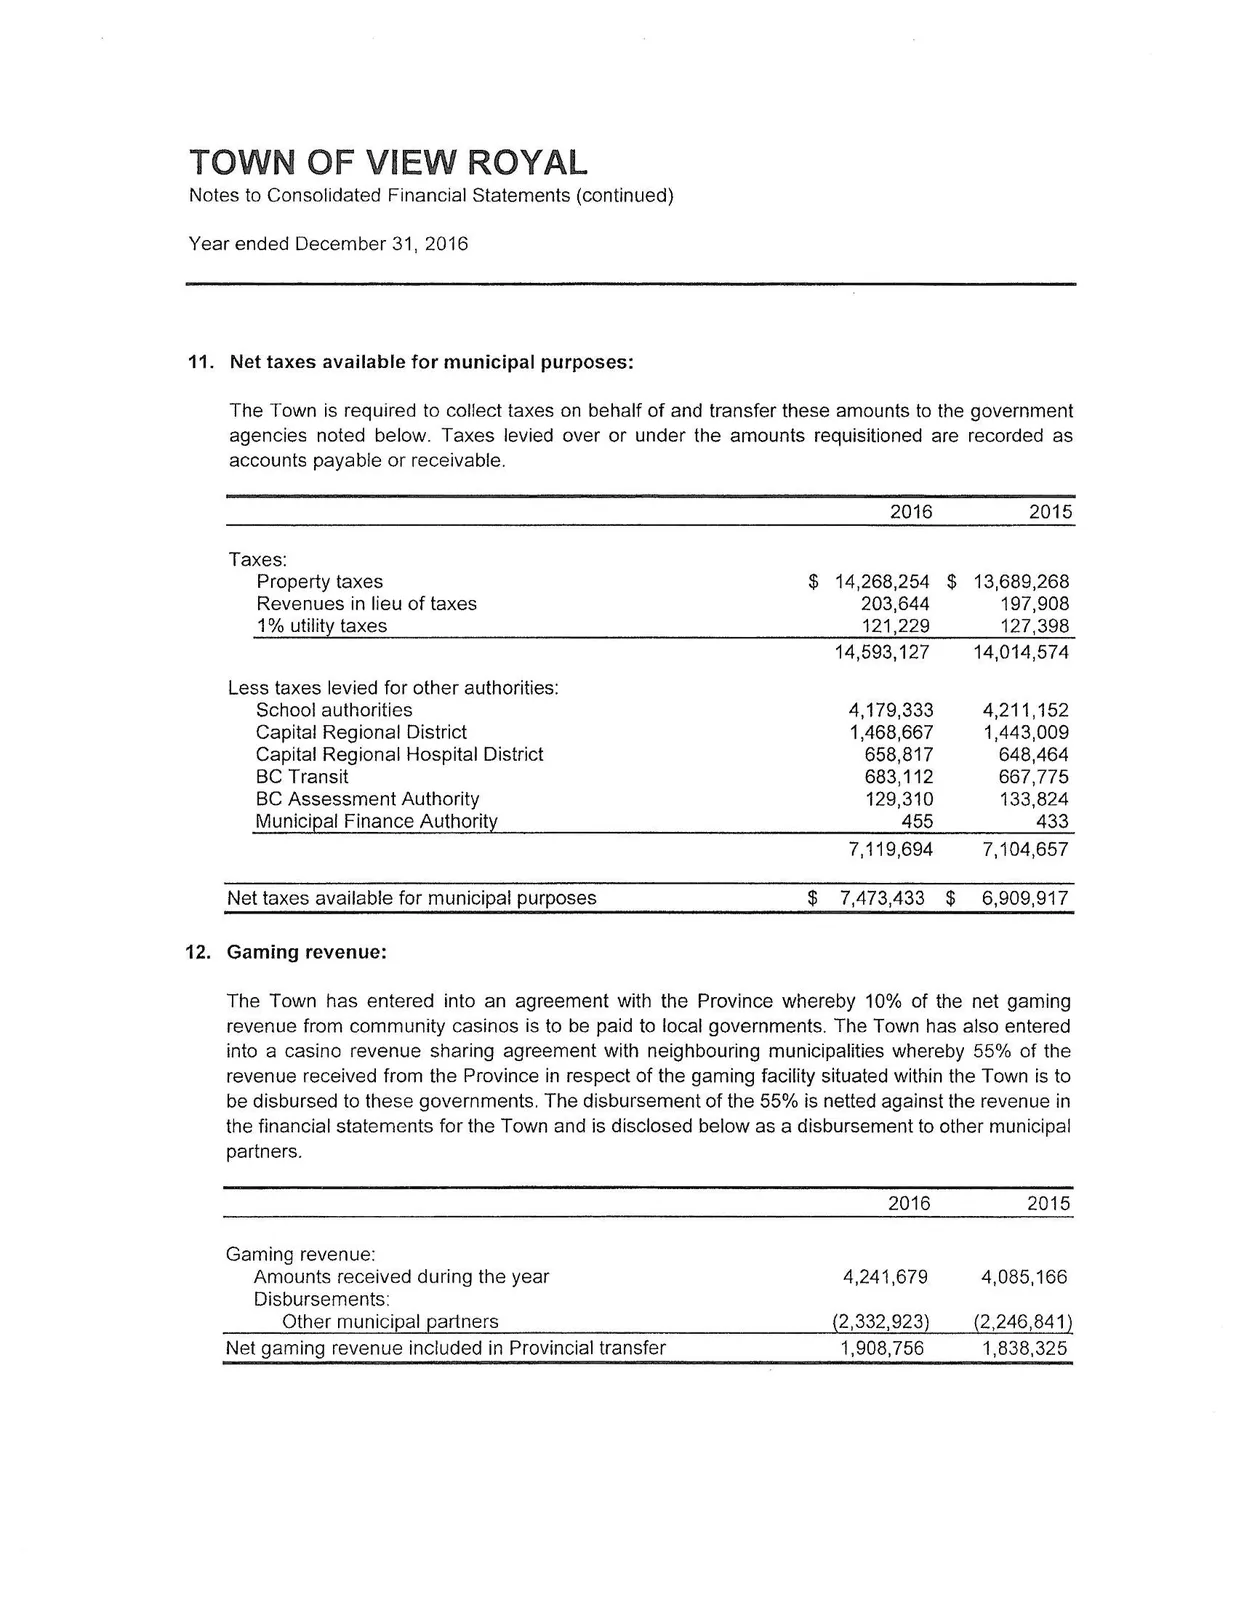
11. Net taxes available for municipal purposes:
The Town is required to collect taxes on behalf of and transfer these amounts to the government agencies noted below. Taxes levied over or under the amounts requisitioned are recorded as accounts payable or receivable.
| 2016 | 2015 | |
|---|---|---|
| Taxes: | ||
| Property taxes | $ 14,268,254 | $ 13,689,268 |
| Revenues in lieu of taxes | 203,644 | 197,908 |
| 1% utility taxes | 121,229 | 127,398 |
| 14,593,127 | 14,014,574 | |
| Less taxes levied for other authorities: | ||
| School authorities | 4,179,333 | 4,211,152 |
| Capital Regional District | 1,468,667 | 1,443,009 |
| Capital Regional Hospital District | 658,817 | 648,464 |
| BC Transit | 683,112 | 667,775 |
| BC Assessment Authority | 129,310 | 133,824 |
| Municipal Finance Authority | 455 | 433 |
| 7,119,694 | 7,104,657 | |
| Net taxes available for municipal purposes | $ 7,473,433 | $ 6,909,917 |
12. Gaming revenue:
The Town has entered into an agreement with the Province whereby 10% of the net gaming revenue from community casinos is to be paid to local governments. The Town has also entered into a casino revenue sharing agreement with neighbouring municipalities whereby 55% of the revenue received from the Province in respect of the gaming facility situated within the Town is to be disbursed to these governments. The disbursement of the 55% is netted against the revenue in the financial statements for the Town and is disclosed below as a disbursement to other municipal partners.
| 2016 | 2015 | |
|---|---|---|
| Gaming revenue: | ||
| Amounts received during the year | 4,241,679 | 4,085,166 |
| Disbursements: | ||
| Other municipal partners | (2,332,923) | (2,246,841) |
| Net gaming revenue included in Provincial transfer | 1,908,756 | 1,838,325 |
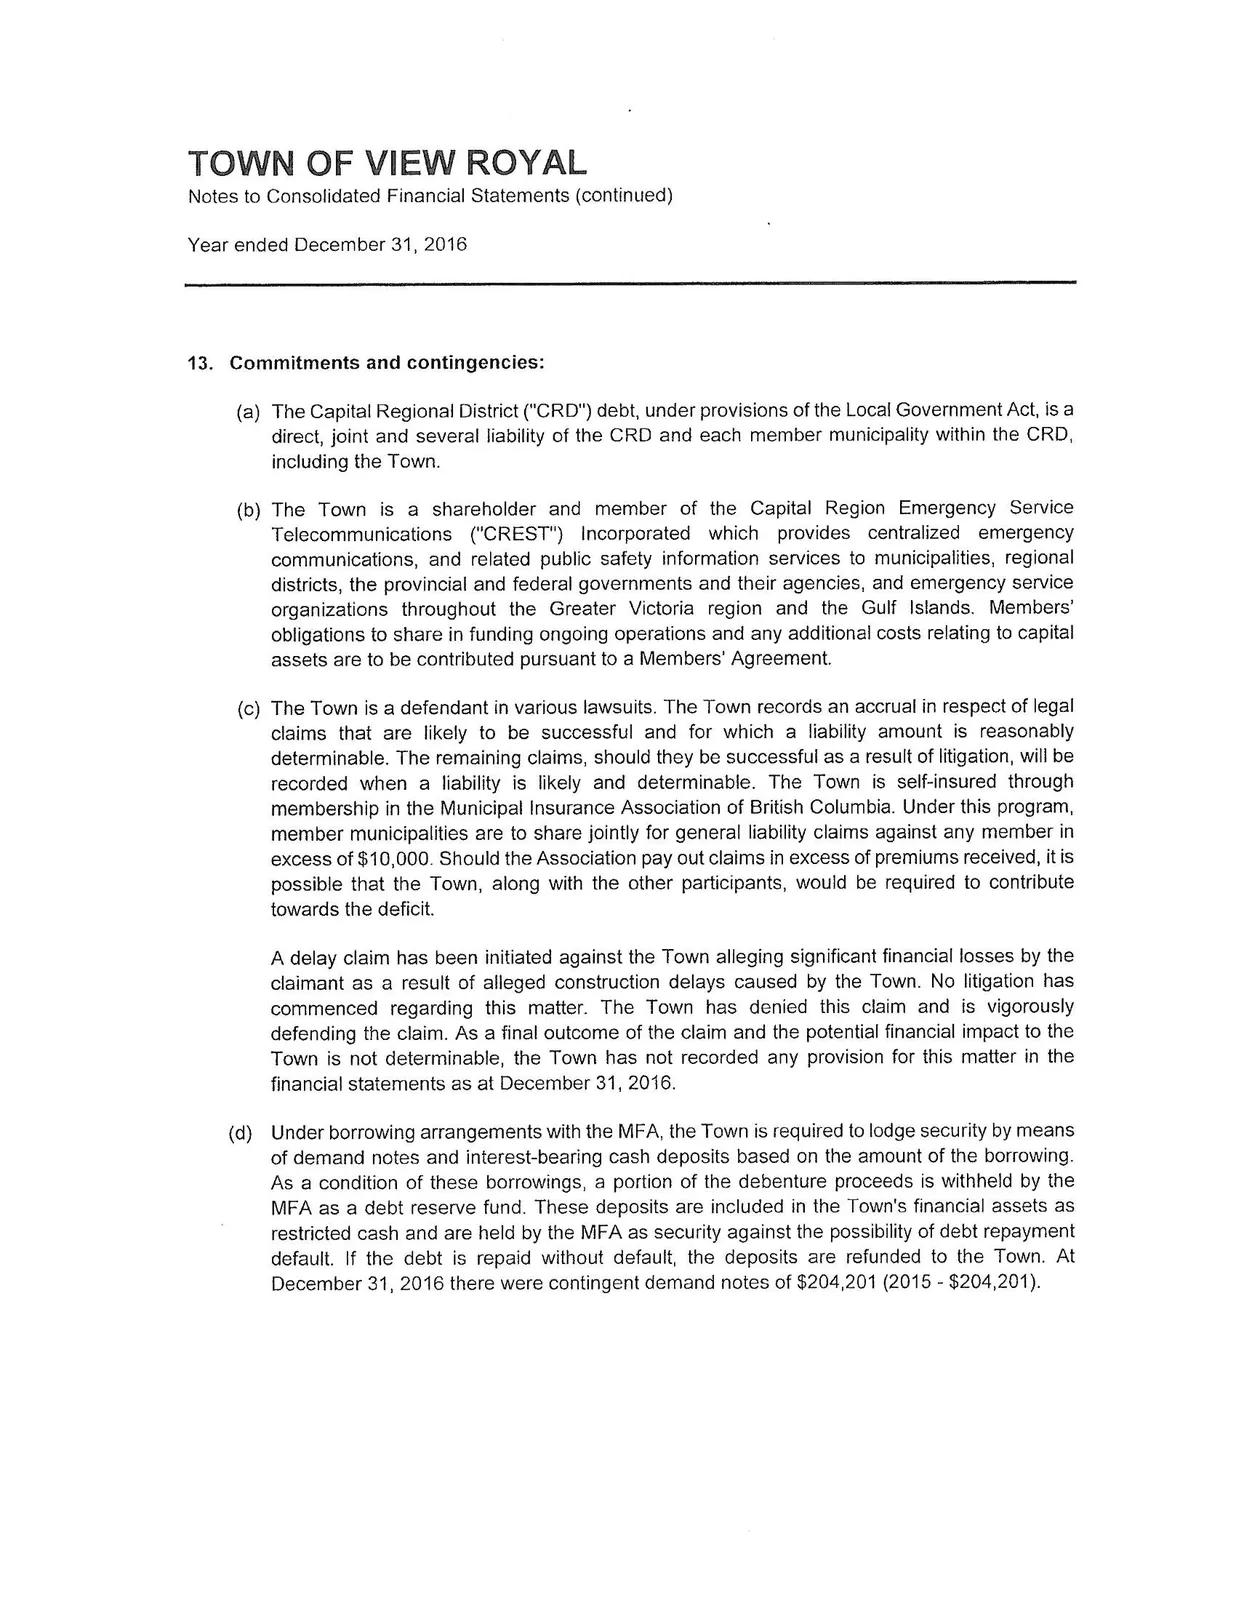
13. Commitments and contingencies:
(a) The Capital Regional District ("CRD") debt, under provisions of the Local Government Act, is a direct, joint and several liability of the CRD and each member municipality within the CRD, including the Town.
(b) The Town is a shareholder and member of the Capital Region Emergency Service Telecommunications ("CREST") Incorporated which provides centralized emergency communications, and related public safety information services to municipalities, regional districts, the provincial and federal governments and their agencies, and emergency service organizations throughout the Greater Victoria region and the Gulf Islands. Members' obligations to share in funding ongoing operations and any additional costs relating to capital assets are to be contributed pursuant to a Members' Agreement.
(c) The Town is a defendant in various lawsuits. The Town records an accrual in respect of legal claims that are likely to be successful and for which a liability amount is reasonably determinable. The remaining claims, should they be successful as a result of litigation, will be recorded when a liability is likely and determinable. The Town is self-insured through membership in the Municipal Insurance Association of British Columbia. Under this program, member municipalities are to share jointly for general liability claims against any member in excess of $10,000. Should the Association pay out claims in excess of premiums received, it is possible that the Town, along with the other participants, would be required to contribute towards the deficit.
A delay claim has been initiated against the Town alleging significant financial losses by the claimant as a result of alleged construction delays caused by the Town. No litigation has commenced regarding this matter. The Town has denied this claim and is vigorously defending the claim. As a final outcome of the claim and the potential financial impact to the Town is not determinable, the Town has not recorded any provision for this matter in the financial statements as at December 31, 2016.
(d) Under borrowing arrangements with the MFA, the Town is required to lodge security by means of demand notes and interest-bearing cash deposits based on the amount of the borrowing. As a condition of these borrowings, a portion of the debenture proceeds is withheld by the MFA as a debt reserve fund. These deposits are included in the Town's financial assets as restricted cash and are held by the MFA as security against the possibility of debt repayment default. If the debt is repaid without default, the deposits are refunded to the Town. At December 31, 2016 there were contingent demand notes of $204,201 (2015 - $204,201).
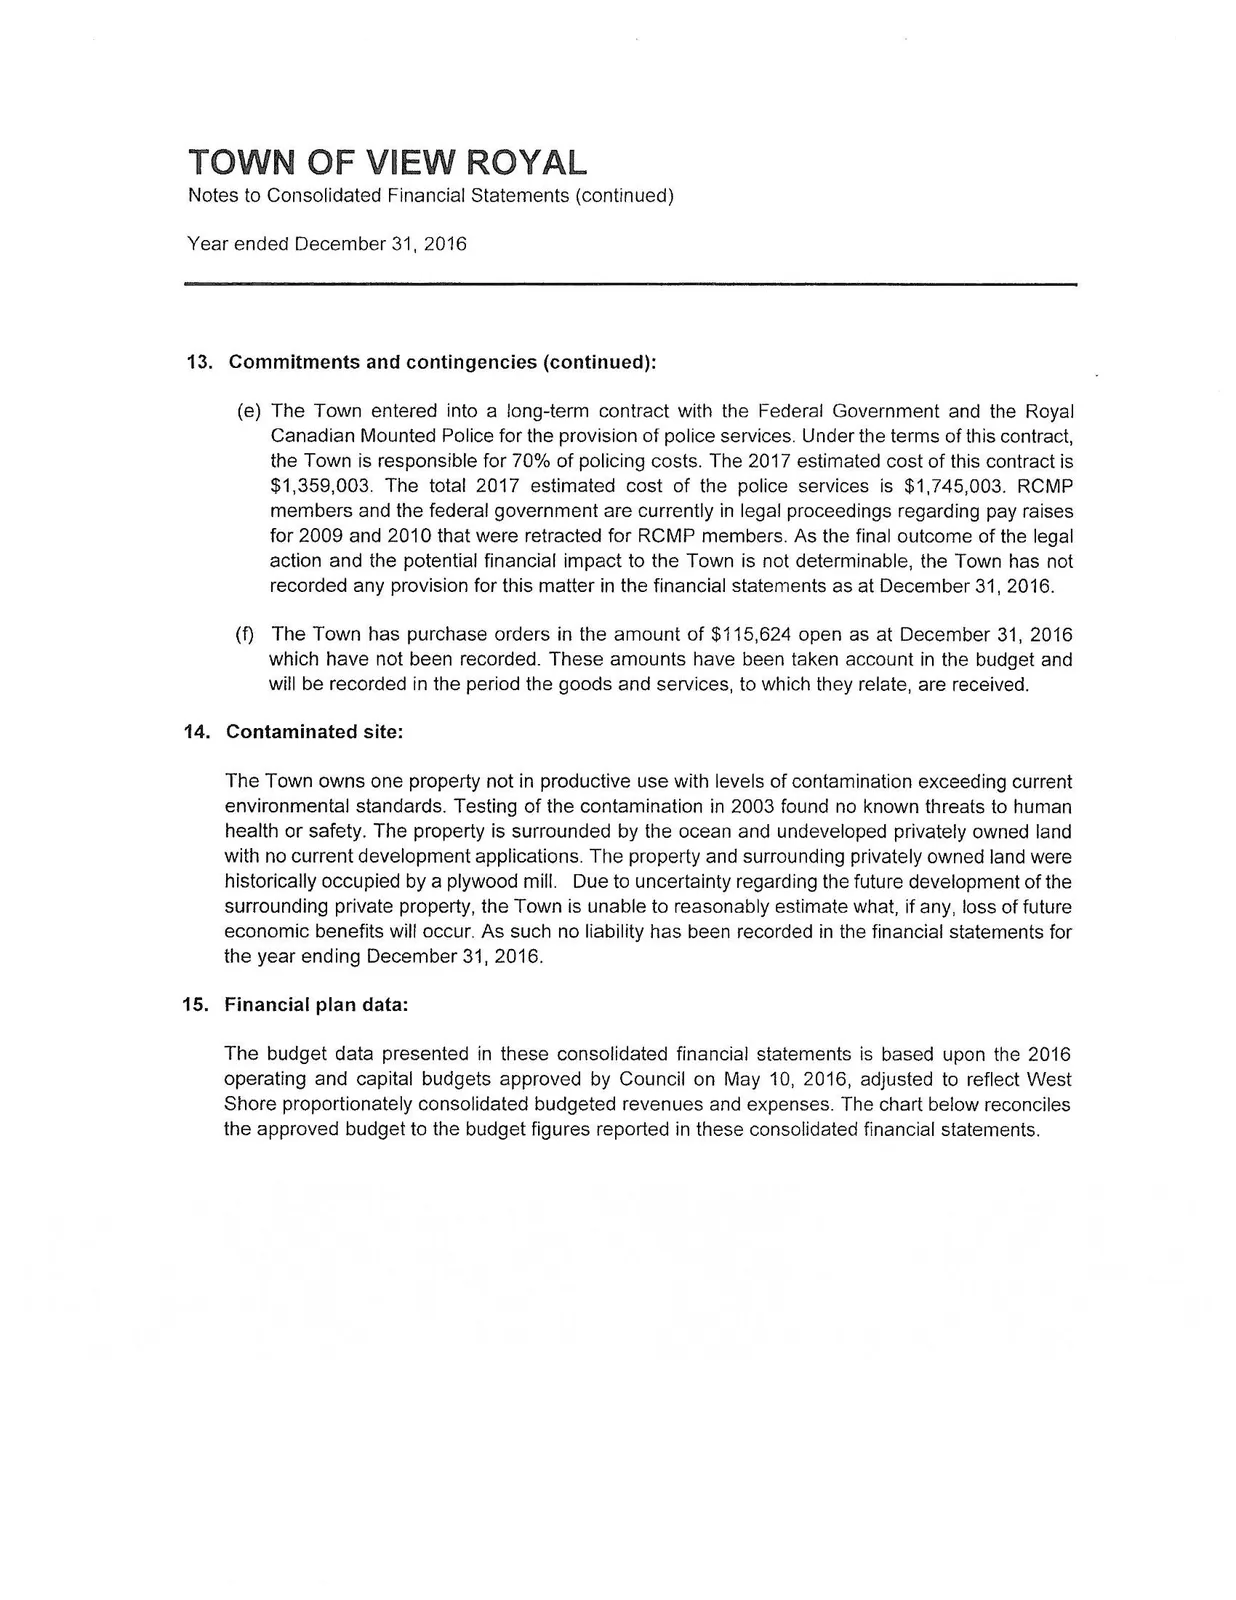
(e) The Town entered into a long-term contract with the Federal Government and the Royal Canadian Mounted Police for the provision of police services. Under the terms of this contract, the Town is responsible for 70% of policing costs. The 2017 estimated cost of this contract is $1,359,003. The total 2017 estimated cost of the police services is $1,745,003. RCMP members and the federal government are currently in legal proceedings regarding pay raises for 2009 and 2010 that were retracted for RCMP members. As the final outcome of the legal action and the potential financial impact to the Town is not determinable, the Town has not recorded any provision for this matter in the financial statements as at December 31, 2016.
(f) The Town has purchase orders in the amount of $115,624 open as at December 31, 2016 which have not been recorded. These amounts have been taken account in the budget and will be recorded in the period the goods and services, to which they relate, are received.
14. Contaminated site:
The Town owns one property not in productive use with levels of contamination exceeding current environmental standards. Testing of the contamination in 2003 found no known threats to human health or safety. The property is surrounded by the ocean and undeveloped privately owned land with no current development applications. The property and surrounding privately owned land were historically occupied by a plywood mill. Due to uncertainty regarding the future development of the surrounding private property, the Town is unable to reasonably estimate what, if any, loss of future economic benefits will occur. As such no liability has been recorded in the financial statements for the year ending December 31, 2016.
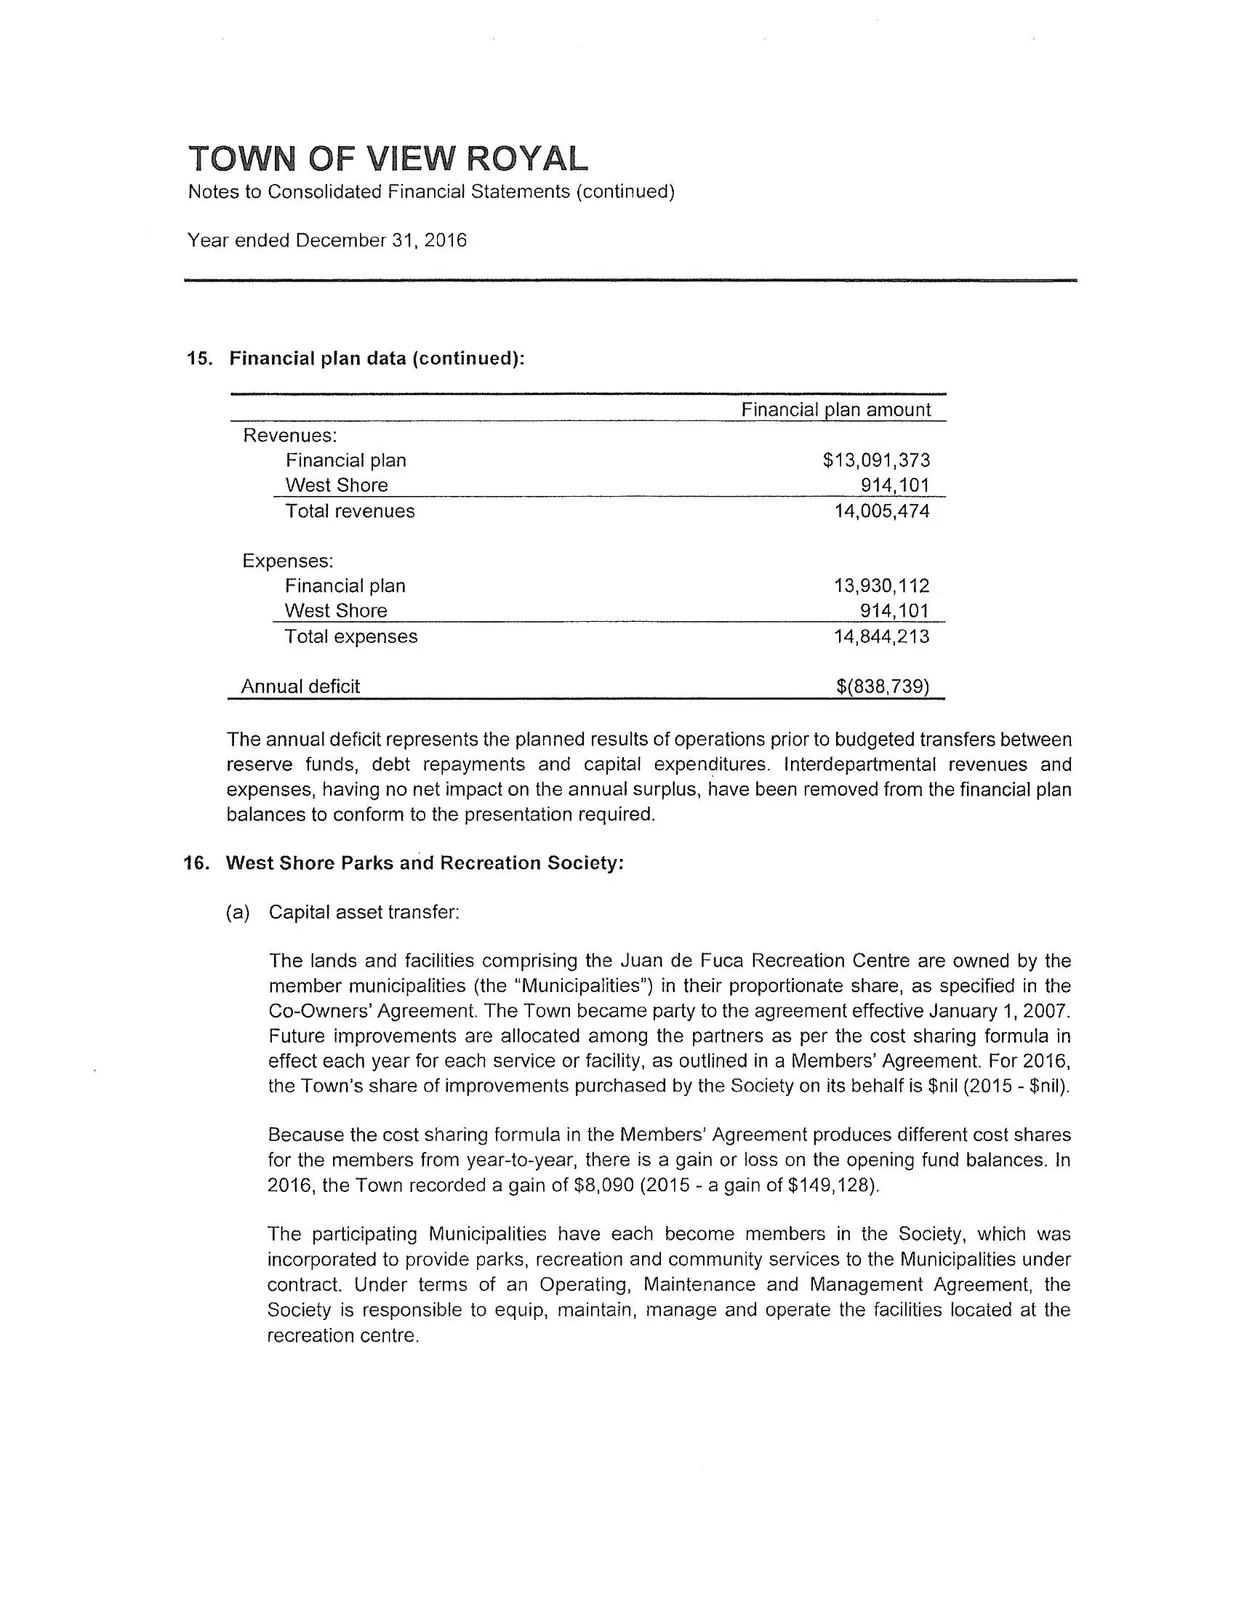
15. Financial plan data:
The budget data presented in these consolidated financial statements is based upon the 2016 operating and capital budgets approved by Council on May 10, 2016, adjusted to reflect West Shore proportionately consolidated budgeted revenues and expenses. The chart below reconciles the approved budget to the budget figures reported in these consolidated financial statements.
| Financial plan amount | |
|---|---|
| Revenues: | |
| Financial plan | $13,091,373 |
| West Shore | 914,101 |
| Total revenues | 14,005,474 |
| Expenses: | |
| Financial plan | 13,930,112 |
| West Shore | 914,101 |
| Total expenses | 14,844,213 |
| Annual deficit | $(838,739) |
The annual deficit represents the planned results of operations prior to budgeted transfers between reserve funds, debt repayments and capital expenditures. Interdepartmental revenues and expenses, having no net impact on the annual surplus, have been removed from the financial plan balances to conform to the presentation required.
16. West Shore Parks and Recreation Society:
(a) Capital asset transfer: The lands and facilities comprising the Juan de Fuca Recreation Centre are owned by the member municipalities (the “Municipalities”) in their proportionate share, as specified in the Co-Owners' Agreement. The Town became party to the agreement effective January 1, 2007. Future improvements are allocated among the partners as per the cost sharing formula in effect each year for each service or facility, as outlined in a Members' Agreement. For 2016, the Town's share of improvements purchased by the Society on its behalf is $nil (2015 - $nil).
Because the cost sharing formula in the Members' Agreement produces different cost shares for the members from year-to-year, there is a gain or loss on the opening fund balances. In 2016, the Town recorded a gain of $8,090 (2015 - a gain of $149,128).
The participating Municipalities have each become members in the Society, which was incorporated to provide parks, recreation and community services to the Municipalities under contract. Under terms of an Operating, Maintenance and Management Agreement, the Society is responsible to equip, maintain, manage and operate the facilities located at the recreation centre.
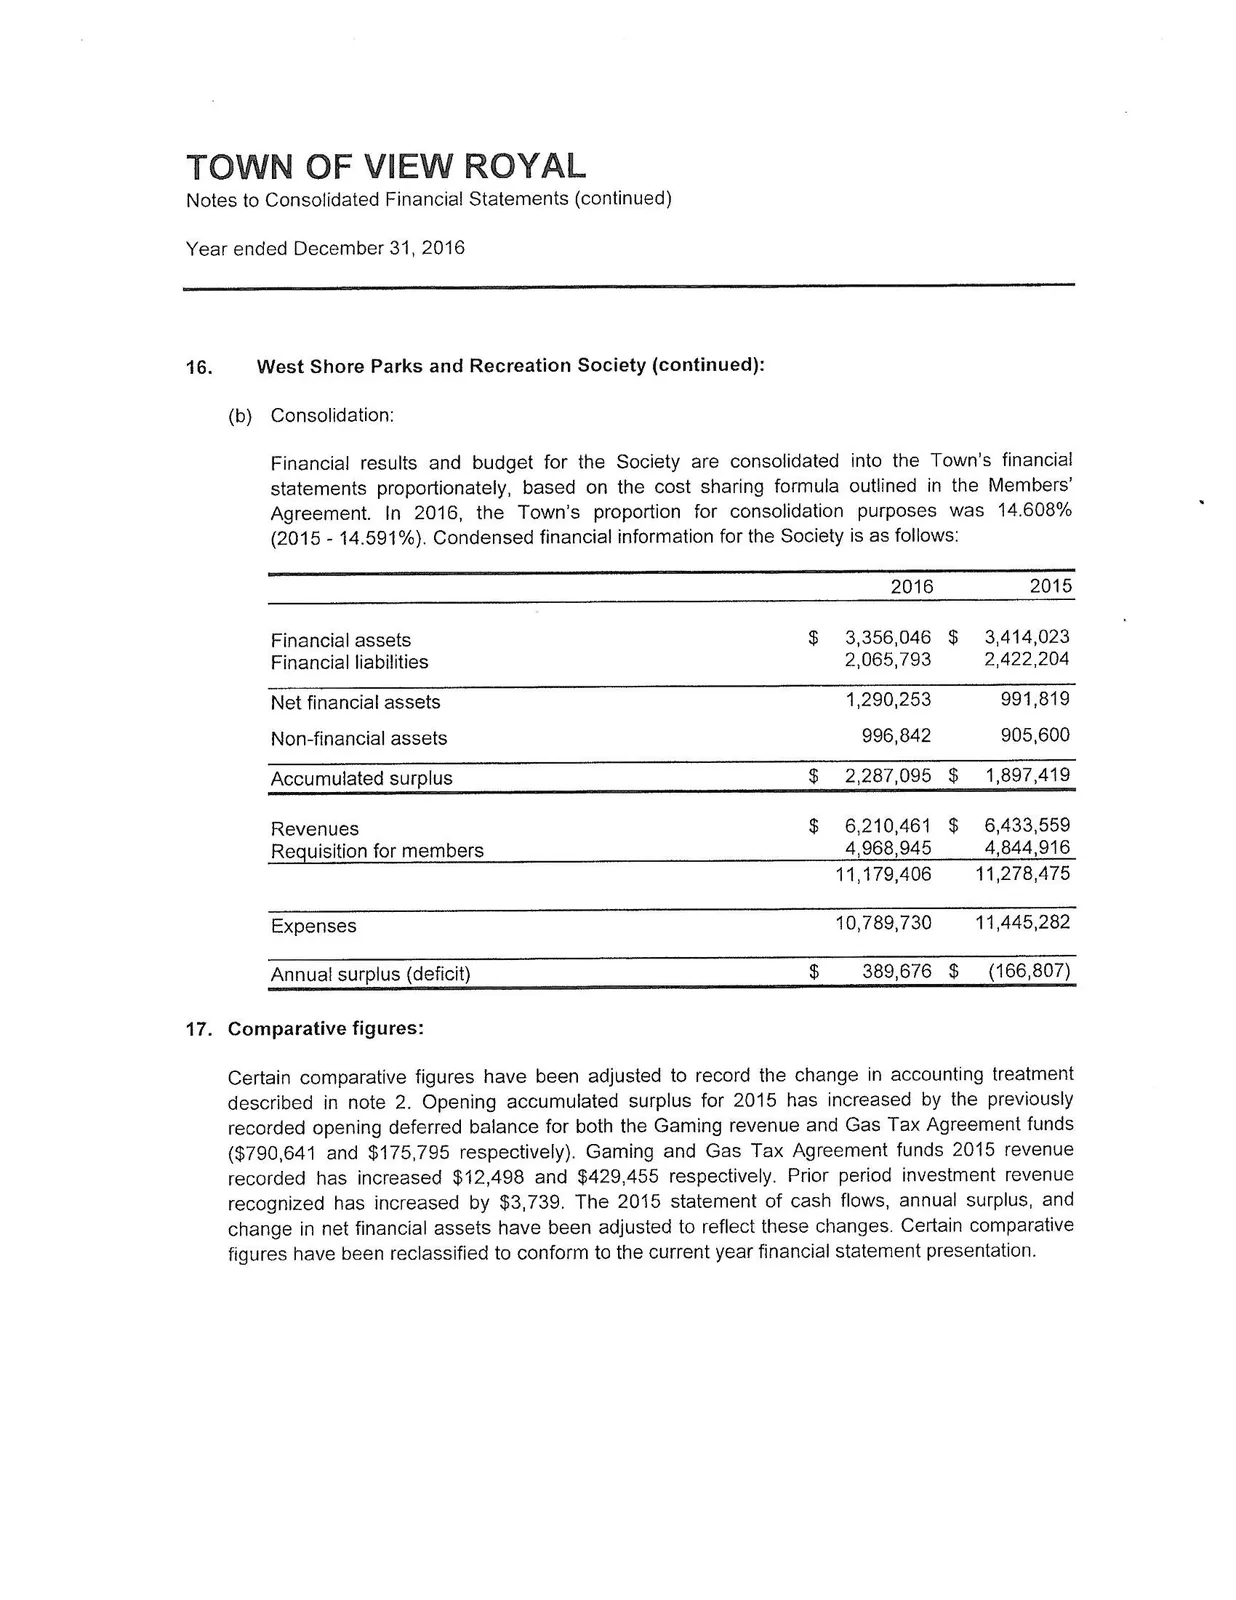
(b) Consolidation: Financial results and budget for the Society are consolidated into the Town's financial statements proportionately, based on the cost sharing formula outlined in the Members’ Agreement. In 2016, the Town's proportion for consolidation purposes was 14.608% (2015 - 14.591%). Condensed financial information for the Society is as follows:
| 2016 | 2015 | |
|---|---|---|
| Financial assets | $ 3,356,046 | $ 3,414,023 |
| Financial liabilities | 2,065,793 | 2,422,204 |
| Net financial assets | 1,290,253 | 991,819 |
| Non-financial assets | 996,842 | 905,600 |
| Accumulated surplus | $ 2,287,095 | $ 1,897,419 |
| Revenues | $ 6,210,461 | $ 6,433,559 |
| Requisition for members | 4,968,945 | 4,844,916 |
| 11,179,406 | 11,278,475 | |
| Expenses | 10,789,730 | 11,445,282 |
| Annual surplus (deficit) | $ 389,676 | $ (166,807) |
17. Comparative figures:
Certain comparative figures have been adjusted to record the change in accounting treatment described in note 2. Opening accumulated surplus for 2015 has increased by the previously recorded opening deferred balance for both the Gaming revenue and Gas Tax Agreement funds ($790,641 and $175,795 respectively). Gaming and Gas Tax Agreement funds 2015 revenue recorded has increased $12,498 and $429,455 respectively. Prior period investment revenue recognized has increased by $3,739. The 2015 statement of cash flows, annual surplus, and change in net financial assets have been adjusted to reflect these changes. Certain comparative figures have been reclassified to conform to the current year financial statement presentation.
18. Segmented information:
The Town is a diversified municipal organization that provides a wide range of services to its citizens. Town services are provided by departments and their activities reported separately. Certain functions that have been separately disclosed in the segmented information, along with the services they provide, are as follows:
General government The general government operations provide the functions of corporate administration, finance, human resources and legislative services and any other functions categorized as non-departmental.
Protective services Protective Services includes the View Royal Fire Rescue which is a paid / composite fire department responsible to provide fire suppression service, fire inspections of public buildings, and training and education of volunteer firemen as well as the citizens of View Royal. In addition, it also includes policing provided by the RCMP, emergency planning, animal control and the maintenance and enforcement of building and construction bylaws as well as all other municipal bylaws. Fire protection services are provided to the Songhees and Esquimalt First Nation communities under contract.
Transportation services Transportation services is comprised of a wide variety of services such as the annual maintenance of all municipally owned roads and bridges, sidewalks, street signage, boulevards, bus shelters, street lighting and traffic signals. Transportation also includes the design, inspection, and maintenance of the storm drain collection systems.
Environmental health services Environmental health services are comprised of the following services:
- Solid Waste Management – providing the service of solid waste collection and disposal to the citizens of View Royal.
- Liquid Waste Management (Sewer) Services – providing the removal of the Town's waste water (sewage).
Planning and development services Environmental development services include all land use, planning and zoning issues in the Town.
Recreation and cultural services Recreation and culture is comprised of services meant to improve the health and development of the citizens of View Royal.
This segment includes maintenance and development of all parks and green space within the Town as well as the Town's financial contribution to the services provided by the Greater Victoria Public Library and the Town's portion of West Shore Parks and Recreation Society.
Statement of segmented information The following statement provides additional financial information for the foregoing functions. Certain allocation methodologies have been employed in the preparation of the segmented financial information. Taxation is apportioned based on budgeted taxation revenue as presented in the consolidated financial plan.
The accounting policies used in these segments are consistent with those followed in the preparation of the financial statements as disclosed in Note 1.
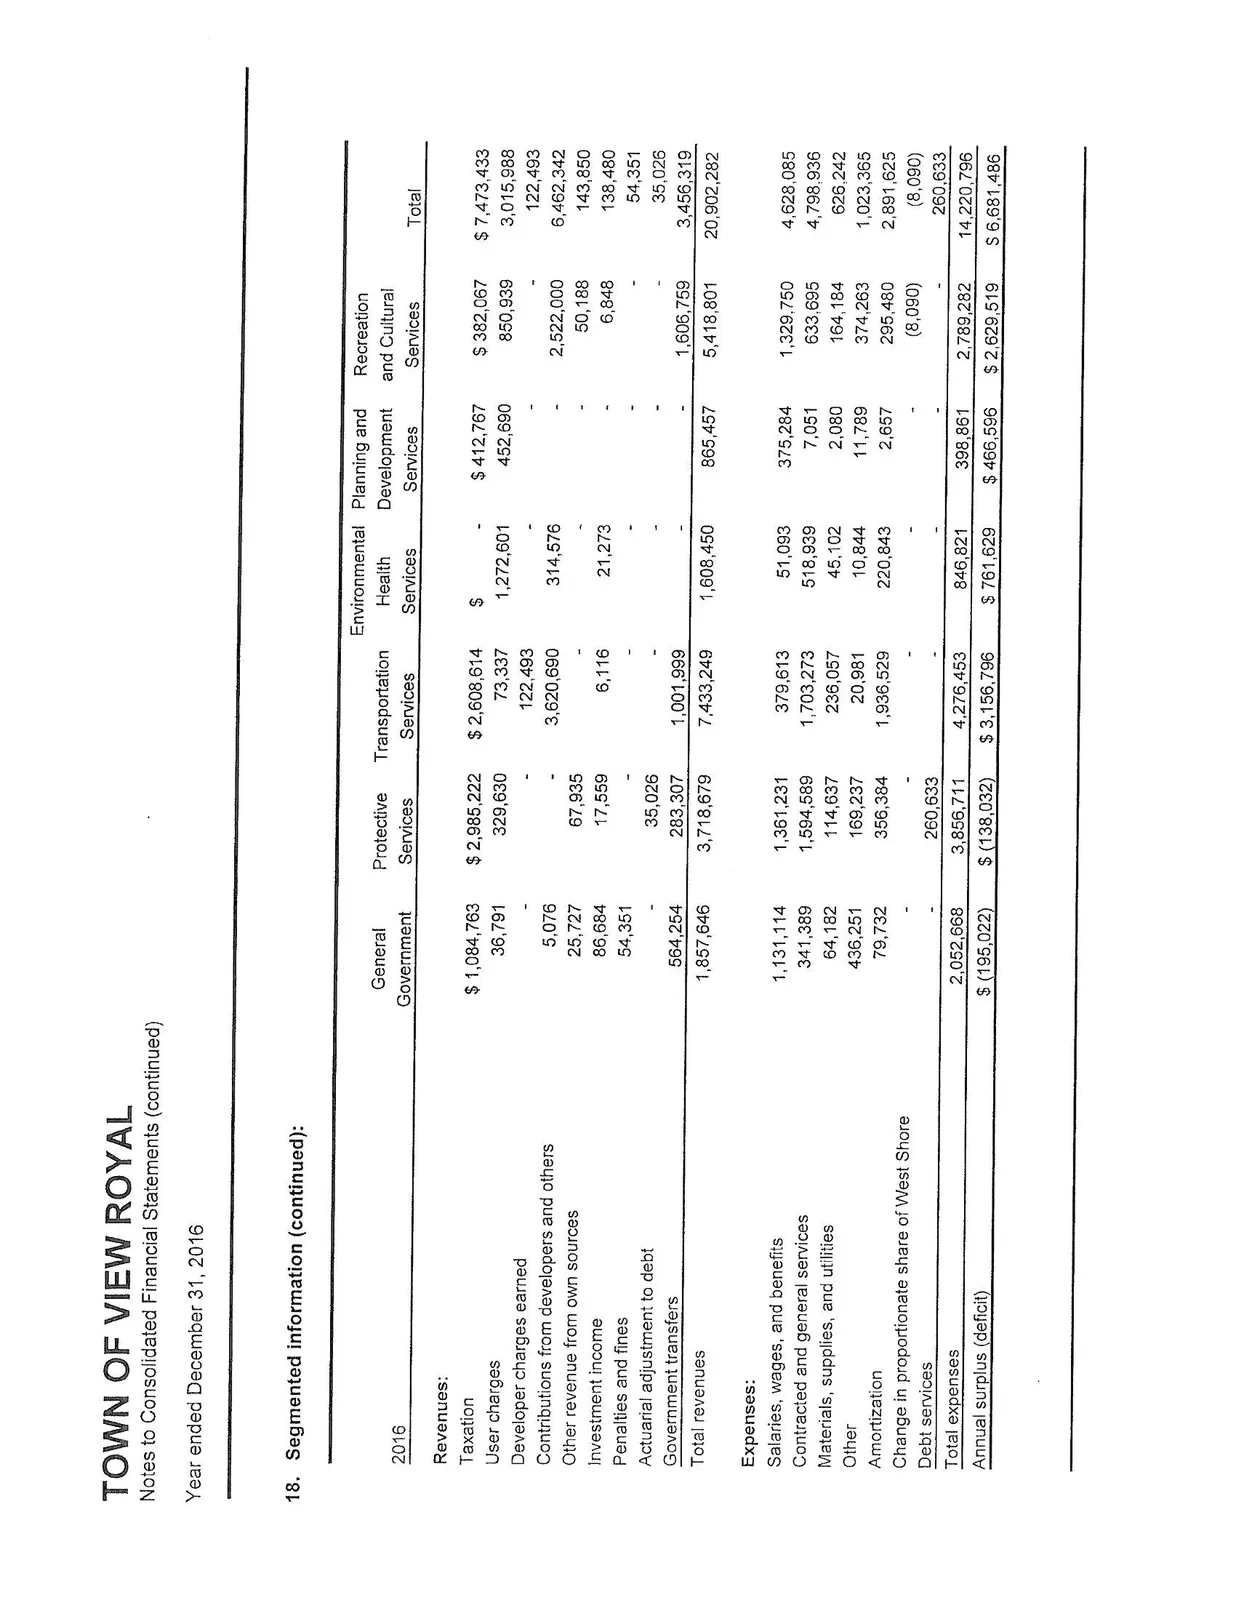
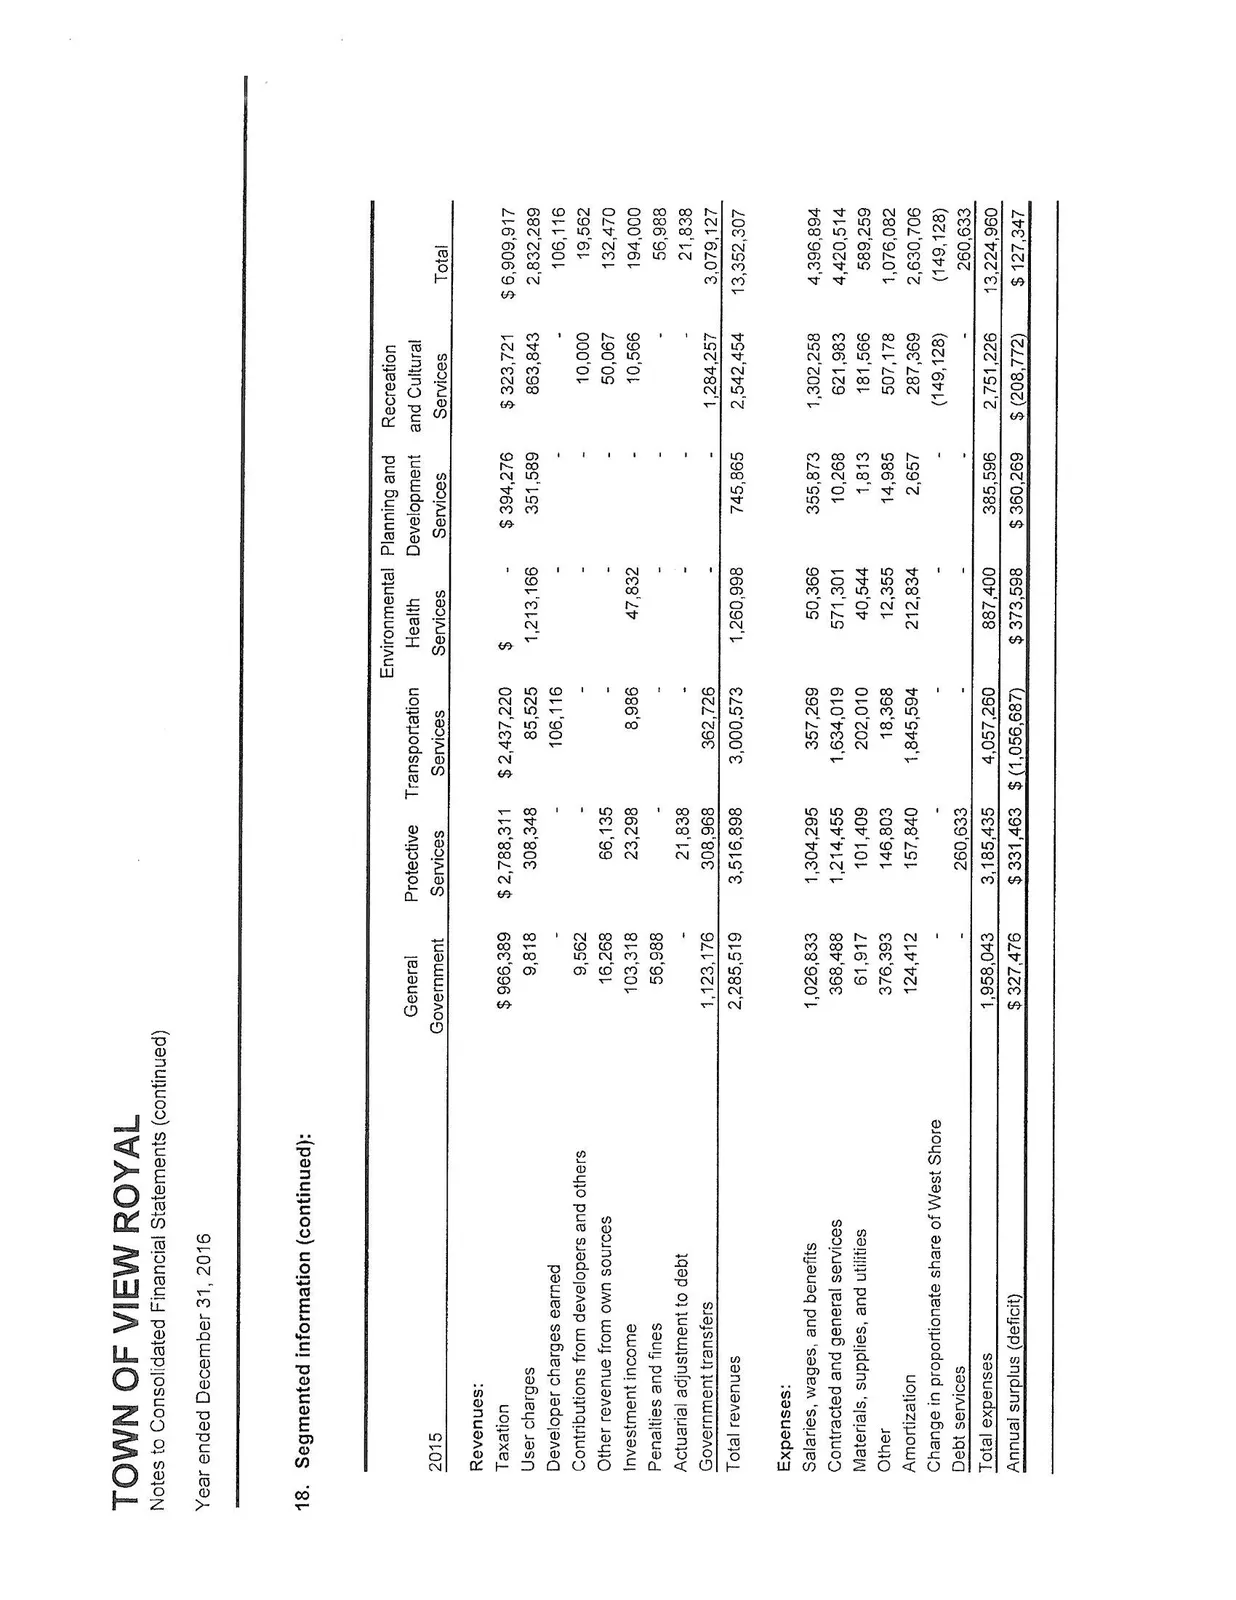
18. Segmented information (continued):
| 2016 | General Government | Protective Services | Transportation Services | Environmental Health Services | Planning and Development Services | Recreation and Cultural Services | Total |
|---|---|---|---|---|---|---|---|
| Revenues: | |||||||
| Taxation | $ 1,084,763 | $ 2,985,222 | $ 2,608,614 | $ - | $ 412,767 | $ 382,067 | $ 7,473,433 |
| User charges | 36,791 | 329,630 | 73,337 | 1,272,601 | 452,690 | 850,939 | 3,015,988 |
| Developer charges earned | - | - | 122,493 | - | - | - | 122,493 |
| Contributions from developers and others | 5,076 | - | 3,620,690 | 314,576 | - | 2,522,000 | 6,462,342 |
| Other revenue from own sources | 25,727 | 67,935 | - | - | - | 50,188 | 143,850 |
| Investment income | 86,684 | 17,559 | 6,116 | 21,273 | - | 6,848 | 138,480 |
| Penalties and fines | 54,351 | - | - | - | - | - | 54,351 |
| Actuarial adjustment to debt | - | - | - | - | - | 35,026 | 35,026 |
| Government transfers | 564,254 | 283,307 | 1,001,999 | - | - | 1,606,759 | 3,456,319 |
| Total revenues | 1,857,646 | 3,718,679 | 7,433,249 | 1,608,450 | 865,457 | 5,418,801 | 20,902,282 |
| Expenses: | |||||||
| Salaries, wages, and benefits | 1,131,114 | 1,361,231 | 379,613 | 51,093 | 375,284 | 1,329,750 | 4,628,085 |
| Contracted and general services | 341,389 | 1,594,589 | 1,703,273 | 518,939 | 7,051 | 633,695 | 4,798,936 |
| Materials, supplies, and utilities | 64,182 | 114,637 | 236,057 | 45,102 | 2,080 | 164,184 | 626,242 |
| Other | 436,251 | 169,237 | 20,981 | 10,844 | 11,789 | 374,263 | 1,023,365 |
| Amortization | 79,732 | 356,384 | 1,936,529 | 220,843 | 2,657 | 295,480 | 2,891,625 |
| Change in proportionate share of West Shore | - | - | - | - | - | (8,090) | (8,090) |
| Debt services | - | 260,633 | - | - | - | - | 260,633 |
| Total expenses | 2,052,668 | 3,856,711 | 4,276,453 | 846,821 | 398,861 | 2,789,282 | 14,220,796 |
| Annual surplus (deficit) | $ (195,022) | $ (138,032) | $ 3,156,796 | $ 761,629 | $ 466,596 | $ 2,629,519 | $ 6,681,486 |
18. Segmented information (continued):
| 2015 | General Government | Protective Services | Transportation Services | Environmental Health Services | Planning and Development Services | Recreation and Cultural Services | Total |
|---|---|---|---|---|---|---|---|
| Revenues: | |||||||
| Taxation | $ 966,389 | $ 2,788,311 | $ 2,437,220 | $ - | $ 394,276 | $ 323,721 | $ 6,909,917 |
| User charges | 9,818 | 308,348 | 85,525 | 1,213,166 | 351,589 | 863,843 | 2,832,289 |
| Developer charges earned | - | - | 106,116 | - | - | - | 106,116 |
| Contributions from developers and others | 9,562 | - | - | - | - | 10,000 | 19,562 |
| Other revenue from own sources | 16,268 | 66,135 | - | - | - | 50,067 | 132,470 |
| Investment income | 103,318 | 23,298 | 8,986 | 47,832 | - | 10,566 | 194,000 |
| Penalties and fines | 56,988 | - | - | - | - | - | 56,988 |
| Actuarial adjustment to debt | - | 21,838 | - | - | - | - | 21,838 |
| Government transfers | 1,123,176 | 308,968 | 362,726 | - | - | 1,284,257 | 3,079,127 |
| Total revenues | 2,285,519 | 3,516,898 | 3,000,573 | 1,260,998 | 745,865 | 2,542,454 | 13,352,307 |
| Expenses: | |||||||
| Salaries, wages, and benefits | 1,026,833 | 1,304,295 | 357,269 | 50,366 | 355,873 | 1,302,258 | 4,396,894 |
| Contracted and general services | 368,488 | 1,214,455 | 1,634,019 | 571,301 | 10,268 | 621,983 | 4,420,514 |
| Materials, supplies, and utilities | 61,917 | 101,409 | 202,010 | 40,544 | 1,813 | 181,566 | 589,259 |
| Other | 376,393 | 146,803 | 18,368 | 12,355 | 14,985 | 507,178 | 1,076,082 |
| Amortization | 124,412 | 157,840 | 1,845,594 | 212,834 | 2,657 | 287,369 | 2,630,706 |
| Change in proportionate share of West Shore | - | - | - | - | - | (149,128) | (149,128) |
| Debt services | - | 260,633 | - | - | - | - | 260,633 |
| Total expenses | 1,958,043 | 3,185,435 | 4,057,260 | 887,400 | 385,596 | 2,751,226 | 13,224,960 |
| Annual surplus (deficit) | $ 327,476 | $ 331,463 | $ (1,056,687) | $ 373,598 | $ 360,269 | $ (208,772) | $ 127,347 |
Schedule of Payments Made for the Provision of Goods and Services (Unaudited)
Year ended December 31, 2016
| Supplier Name | Aggregated amount paid to supplier |
|---|---|
| 599510 BC LTD | $ 235,157 |
| AON REED STENHOUSE | 36,196 |
| ARGUS EXCAVATING LTD. | 42,067 |
| BC ASSESSMENT | 128,484 |
| BC HYDRO | 176,847 |
| BC TRANSIT | 687,652 |
| BROOMFIELD DEAN T | 40,285 |
| CAPITAL CITY PAVING LTD | 55,132 |
| CAPITAL REGIONAL DISTRICT- ACCOUNTS | 2,216,875 |
| CAPITAL REGIONAL DISTRICT WATER DEPARTMENT | 139,469 |
| CAPITAL REGIONAL HOSPITAL DISTRICT | 655,005 |
| CITY OF LANGFORD | 943,612 |
| CITY OF LANGFORD - IN TRUST | 1,700,653 |
| CORPORATION OF THE TOWNSHIP OF ESQUIMALT | 107,150 |
| CRD BYLAW ENFORCEMENT & ANIMAL CONTROL | 42,150 |
| CREST | 36,639 |
| DISTRICT OF SAANICH | 76,103 |
| DUNCAN ELECTRIC MOTOR LTD | 64,546 |
| E.H. EMERY ELECTRIC LTD | 58,822 |
| EAGLE CREEK VILLAGE I GP | 481,237 |
| EAGLE PACIFIC DEVELOPMENTS INC | 98,893 |
| FIVE STAR PAVING CO LTD | 551,155 |
| GREATER VICTORIA PUBLIC LIBRARY | 536,443 |
| HARRIS & COMPANY | 40,035 |
| IPI TECH INC | 28,151 |
| ISLAND ASPHALT COMPANY | 48,573 |
| ISLAND LAND SURVEYING LTD | 32,779 |
| JOHN MOONEN AND ASSOCIATES LTD | 48,694 |
| LIMONA CONSTRUCTION LTD | 25,574 |
| MINISTER OF FINANCE | 2,200,605 |
| MUNICIPAL INSURANCE ASSOCIATION OF BRITISH | 103,692 |
| MUNICIPAL PENSION PLAN | 445,475 |
| NORTHRIDGE EXCAVATING LTD | 29,895 |
| NOVUS CONSULTING INC | 70,957 |
| PACIFIC BLUE CROSS | 144,842 |
| PBX ENGINEERING LTD | 42,381 |
| PHILLIPS STEVEN | 25,120 |
| PHOENIX LAW CORPORATION | 29,909 |
| RANDALL & MURRELL LLP IN TRUST | 50,000 |
| RAYLEC POWER LTD | 203,577 |
| RECEIVER GENERAL FOR CANADA | 794,612 |
| RECEIVER GENERAL FOR CANADA - RCMP POLICING | 1,224,927 |
| RECEIVER GENERAL FOR CANADA-RCMP E DIVISION HQ | 43,536 |
| RECTEC INDUSTRIES INC. | 49,006 |
| REVENUE SERVICES OF BRITISH COLUMBIA | 25,170 |
| SCHO'S LINE PAINTING LTD | 53,996 |
| SIGMA SAFETY CORP | 27,680 |
| SOFTCHOICE LP | 33,857 |
| STANTEC CONSULTING LTD | 46,030 |
| SUBURBAN MOTORS | 81,554 |
| TOMAHAWK TREE SERVICE (2006) LTD | 29,558 |
| VADIM COMPUTER MANAGEMENT GROUP LTD | 28,409 |
| VICTORIA CONTRACTING & MUNICIPAL MTC CORP | 1,263,060 |
| WASTE MANAGEMENT OF CANADA CORP. | 439,446 |
| WATKISS RISE DEVELOPMENT LTD | 567,670 |
| WEST SHORE PARKS & REC. SOCIETY | 549,108 |
| WORKERS' COMPENSATION BOARD OF BC | 32,365 |
| X.W. SUNRISE DEVELOPMENTS | 202,070 |
| Total aggregate payments to suppliers exceeding $25,000 | $ 18,172,885 |
| Consolidated total of payments of $25,000 or less | 1,445,611 |
| Total aggregate payments to suppliers | $ 19,618,496 |
| Grants and contributions exceeding $25,000 | |
| SHORELINE COMMUNITY SCHOOL ASSOCIATION | $ 30,000 |
| VIEW ROYAL READING CENTRE | 28,000 |
| VIEW ROYAL FIREFIGHTERS ASSOCIATION | 49,100 |
| Consolidated total of all grants and contributions exceeding $25,000 | $ 107,100 |
| Consolidated total of all grants and contributions $25,000 or less | 40,075 |
| Total aggregate grants and contributions | $ 147,175 |
| Total aggregate payments exceeding $25,000 paid to suppliers | $ 18,172,885 |
| Consolidated total of payments of $25,000 or less paid to suppliers | 1,445,611 |
| Total aggregate grants and contributions | 147,175 |
| Total per Notes to Consolidated Financial Statements (Note 18. Segmented Information: Total Expenses) | 14,220,796 |
| **Variance *** | $ 5,544,875 |
- The variance comprises differences between cash and accrual based accounting and non-expensed items such as payments for capital, debt, taxes collected for other governments and sharing of revenue under agreements.
Statement of Remuneration and Expenses (Unaudited)
Year ended December 31, 2016
Elected Officials
| Name | Position | Remuneration | Expenses | Total |
|---|---|---|---|---|
| Screech, David | Mayor | $ 25,813 | $ 5,752 | $ 31,565 |
| Rast, Heidi | Councillor | 12,376 | 847 | 13,223 |
| Rogers, John | Councillor | 12,376 | 3,827 | 16,203 |
| Mattson, Ron | Councillor | 12,376 | 1,692 | 14,068 |
| Weisgerber, Aaron | Councillor | 12,376 | 2,813 | 15,189 |
| $ 75,317 | $ 14,931 | $ 90,248 |
Employees
| Name | Position | Remuneration | Expenses | Total |
|---|---|---|---|---|
| Anema, Kim | Chief Administrative Officer | $ 152,718 | $ 7,379 | $ 160,097 |
| Becelaere, Deb | Deputy Director of Engineering | 99,533 | 1,401 | 100,934 |
| Bevan, Heath | Firefighter | 99,618 | 1,605 | 101,223 |
| Brown, David | Firefighter | 98,395 | 1,920 | 100,315 |
| Calla, Enzo | Bylaw Officer | 82,926 | 1,189 | 84,115 |
| Chase, Lindsay | Director of Development Services | 116,027 | 5,769 | 121,796 |
| Chow, Jeffrey | Senior Planner | 86,096 | 2,998 | 89,094 |
| Davison, James | Planner | 76,908 | 1,954 | 78,862 |
| Dillabaugh, Michael | Director of Finance | 106,487 | - | 106,487 |
| Faykes, Gary | Building Inspector | 75,482 | 4,006 | 79,488 |
| Hurst, Paul | Fire Chief | 129,118 | 1,450 | 130,568 |
| Jones, Sarah | Director of Corporate Administration | 124,984 | 2,570 | 127,554 |
| Marshall, Rob | Firefighter | 97,534 | 2,289 | 99,823 |
| Mollin, Troy | Firefighter | 98,133 | 3,037 | 101,170 |
| Pitre, Geoffrey | Firefighter | 88,529 | 1,009 | 89,538 |
| Podmoroff, David | Parks Supervisor | 90,006 | 2,181 | 92,187 |
| Rosenberg, John | Director of Engineering | 114,132 | 8,959 | 123,091 |
| Watson, Monique | Senior Accountant | 84,304 | - | 84,304 |
| Woodley, Darryl | Engineering Technologist | 86,185 | 63 | 86,248 |
| Other Employees (under $75,000) | 844,176 | - | 844,176 | |
| $ 2,751,291 | $ 49,779 | $ 2,801,070 |
Reconciliation of Remuneration
- Elected Officials: $ 75,317
- Employees: 2,751,291
- Receiver General for Canada (Employer portion CPP & EI): 131,895
- Health and Pension Benefits: 417,577
- RCMP (West Shore Detachment) Civilian Staff Wages and benefits paid to City of Langford: 245,427
- Overtime Banked as of December 31, 2016: 14,996
- Other reconciling items, including adjustments for accrual-based accounting, wages & benefits not included in the statement of operations ie. capital and West Shore Parks and Recreation Society: 991,582 Total per Notes to Consolidated Financial Statements (Note 18. Segmented Information: Salaries, wages, and benefits): $ 4,628,085
Prepared under the Financial Information Regulation, Schedule 1, section 6(2), (3), (4), (5) and (6)
Statement of Guarantee and Indemnity Agreements
Year ended December 31, 2016
The Town of View Royal has not provided any guarantees or indemnities under the Guarantee and Indemnities Regulation.
Prepared under the Financial Information Regulation, Schedule 1, subsection 5(3) and 5(4)
Statement of Severance Agreements
Year ended December 31, 2016
There were no severance agreements under which payments commenced between the Town of View Royal and an employee during the fiscal year 2016.
Prepared under the Financial Information Regulation, Schedule 1, subsection 6(8)
Statement of Permissive Tax Exemptions (Unaudited)
Year ended December 31, 2016
| Organization | Folio | Municipal Property Tax |
|---|---|---|
| Places of public worship | ||
| All Saints Church - 287 Pallisier Ave | 401-04412.018 | $ 4,716 |
| St. Columba Church - 40 High Street | 401-07654.010 | 2,933 |
| Community activity centres | ||
| Strawberry Vale Community Hall - 11 High Street | 401-07647.010 | 5,092 |
| View Royal Community Hall - 279 Island Highway | 401-04399.010 | 4,567 |
| Not for profit organizations | ||
| Island Corridor Foundation | ||
| PID 023-005-459; Sections 6, 97, and 103: Plan VIP60330 | 401-18806.000 | 6,252 |
| PID 011-825-871; 014-980-258; 024-036-021; 024-039-209; 024-839-957 | 401-18807.000 | 10,484 |
| PID 011-825-871; 014-980-258; 024-036-021; 024-039-209; 024-839-957 | 401-18807.000 | 7 |
| PID 024-635-987; Lot 1, Sections 8 & 27; Plan VIP69799 | 401-18807.002 | 336 |
| Recreational property | ||
| Victoria Bowmen Association | ||
| PID 000-345-644; Part of Section 6 Plan VIP7133; Area of 1,940 m2 | 401-07684.041 | 2,016 |
| $ 36,403 |
Statement of Development Cost Charges (DCC)
Year ended December 31, 2016
| Balance January 1 | Transfer to Projects | DCC's Received | Interest Earned | Balance December 31 | |
|---|---|---|---|---|---|
| Drainage DCC | $ 774,458 | $ - | $ 9,910 | $ 9,928 | $ 794,296 |
| Highways DCC | 1,754,445 | 122,493 | 58,992 | 22,510 | 1,713,454 |
| Park Improvement DCC | 93,564 | - | 4,832 | 1,201 | 99,597 |
| Park Land DCC | 587,284 | - | 12,071 | 7,531 | 606,886 |
| Sewer DCC | 1,276,983 | - | 9,396 | 16,367 | 1,302,746 |
| $ 4,486,734 | $ 122,493 | $ 95,201 | $ 57,537 | $ 4,516,979 |
Statistical Information (Unaudited)
Taxable Assessments of Land and Improvements - Final Roll Totals
| 2012 | 2013 | 2014 | 2015 | 2016 | |
|---|---|---|---|---|---|
| Residential | 1,703,860,702 | 1,688,392,103 | 1,688,507,203 | 1,705,971,703 | 1,755,744,103 |
| Utilities | 379,500 | 376,200 | 377,200 | 304,600 | 304,700 |
| Light Industry | - | 2,074,000 | 2,298,000 | 2,712,000 | 2,711,000 |
| Business | 154,482,400 | 155,824,400 | 165,285,450 | 168,958,950 | 191,493,350 |
| Rec/Non Profit | 6,529,000 | 6,526,000 | 6,221,000 | 6,222,000 | 6,401,000 |
| Farm | 71,218 | 71,218 | 60,496 | 60,496 | 60,496 |
| 1,865,322,820 | 1,853,263,921 | 1,862,749,349 | 1,884,229,749 | 1,956,714,649 |
Property Tax Rates - Municipal ($ per $1,000 assessment)
| 2012 | 2013 | 2014 | 2015 | 2016 | |
|---|---|---|---|---|---|
| Residential | 2.35161 | 2.52342 | 2.66124 | 2.82883 | 2.93375 |
| Utilities | 30.23178 | 31.70102 | 33.05331 | 40.00000 | 40.00000 |
| Light Industry | - | 8.81447 | 8.31667 | 8.87083 | 9.22077 |
| Business | 8.55460 | 8.81447 | 9.18848 | 9.82487 | 9.90580 |
| Rec/Non Profit | 8.49933 | 8.83896 | 9.08049 | 9.68820 | 9.78435 |
| Farm | 19.46739 | 20.23598 | 21.15469 | 22.57408 | 23.45532 |
Municipal Property Tax Billings by Property Class
| 2012 | 2013 | 2014 | 2015 | 2016 | |
|---|---|---|---|---|---|
| Residential | 4,006,816 | 4,260,522 | 4,493,523 | 4,825,904 | 5,150,916 |
| Utilities | 11,473 | 11,926 | 12,468 | 12,184 | 12,188 |
| Light Industry | - | 18,281 | 19,112 | 24,058 | 24,998 |
| Business * | 1,321,535 | 1,373,509 | 1,518,722 | 1,660,000 | 1,896,895 |
| Rec/Non Profit | 55,492 | 57,683 | 56,490 | 60,280 | 62,630 |
| Farm | 1,386 | 1,441 | 1,280 | 1,366 | 1,419 |
| $ 5,396,702 | $ 5,723,362 | $ 6,101,595 | $ 6,583,792 | $ 7,149,046 |
Statistical Information (continued)

2016 Assessments by Property Class
- Residential: 89.73%
- Business: 9.79%
- Rec/Non Profit: 0.33%
- Light Industry: 0.14%
- Utilities: 0.02%
- Farm: 0.00%

2016 Municipal Property Tax by Property Class
- Residential: 72.05%
- Business *: 26.53%
- Rec/Non Profit: 0.88%
- Light Industry: 0.35%
- Utilities: 0.17%
- Farm: 0.02%
Statistical Information (continued)
Long Term Debt and Capital Lease Obligations (Unaudited)
| 2016 | 2015 | 2014 | 2013 | 2012 | |
|---|---|---|---|---|---|
| Long-term debt | |||||
| General | $ 6,897,532 | $ 7,232,118 | $ 7,553,834 | $ 2,195,904 | $ 2,536,117 |
| Consolidated entity debt | 10,571 | 23,796 | 36,076 | ||
| 6,897,532 | 7,232,118 | 7,564,405 | 2,219,700 | 2,572,193 | |
| Capital lease obligation | |||||
| General - protective services | - | - | - | - | - |
| Total Long Term Debt and Capital Lease Obligations | 6,897,532 | 7,232,118 | 7,564,405 | 2,219,700 | 2,572,193 |
| Population | 10,408 | 10,834 | 10,714 | 10,858 | 9,838 |
| Debt per capita | $ 663 | $ 668 | $ 706 | $ 204 | $ 261 |
Source: Population: Statistics Canada
Statistical Information (continued)
Principal Corporate Taxpayers (Unaudited)
| Registered Owner | Primary Property | Total 2016 General Municipal Taxes Levied |
|---|---|---|
| Admirals Walk Properties Ltd Inc | Admirals Walk | $ 275,926 |
| Eagle Creek Village Property Ltd | Eagle Creek Village | 223,319 |
| Great Canadian Casinos Inc | View Royal Casino | 164,793 |
| Canadian Tire Real Estate Ltd | Canadian Tire | 143,377 |
| Natural Properties Ltd | Reliable Controls | 104,438 |
| Christie Point Apartments Ltd | Christie Point Apartments | 93,634 |
| West Shore U-Lock Mini Storage Ltd | U-Lock Mini Storage | 87,765 |
| Goodwill Investments Ltd | Fort Victoria | 85,879 |
| Adams Storage Village Ltd | Adams Storage | 80,567 |
| Mojack Holdings Ltd | Jenner Chevrolet | 65,458 |
| Total Tax Contributions from Top 10 Corporate Taxpayers | $ 1,325,156 | |
| Total General Municipal Tax | $ 7,149,045 | |
| Proportion of municipal tax paid by top ten corporate taxpayers | 18.54% |
Document Images
(32)