Appendix
Appendix: WSPRS 2017 Budget - Overview Tables
January 17, 2017Pages 89–902 sections
Financial summaries detailing projected revenues and expenses for various recreation programs and departments.
Total Revenue: $6,064,257Total Expenses: $10,611,748
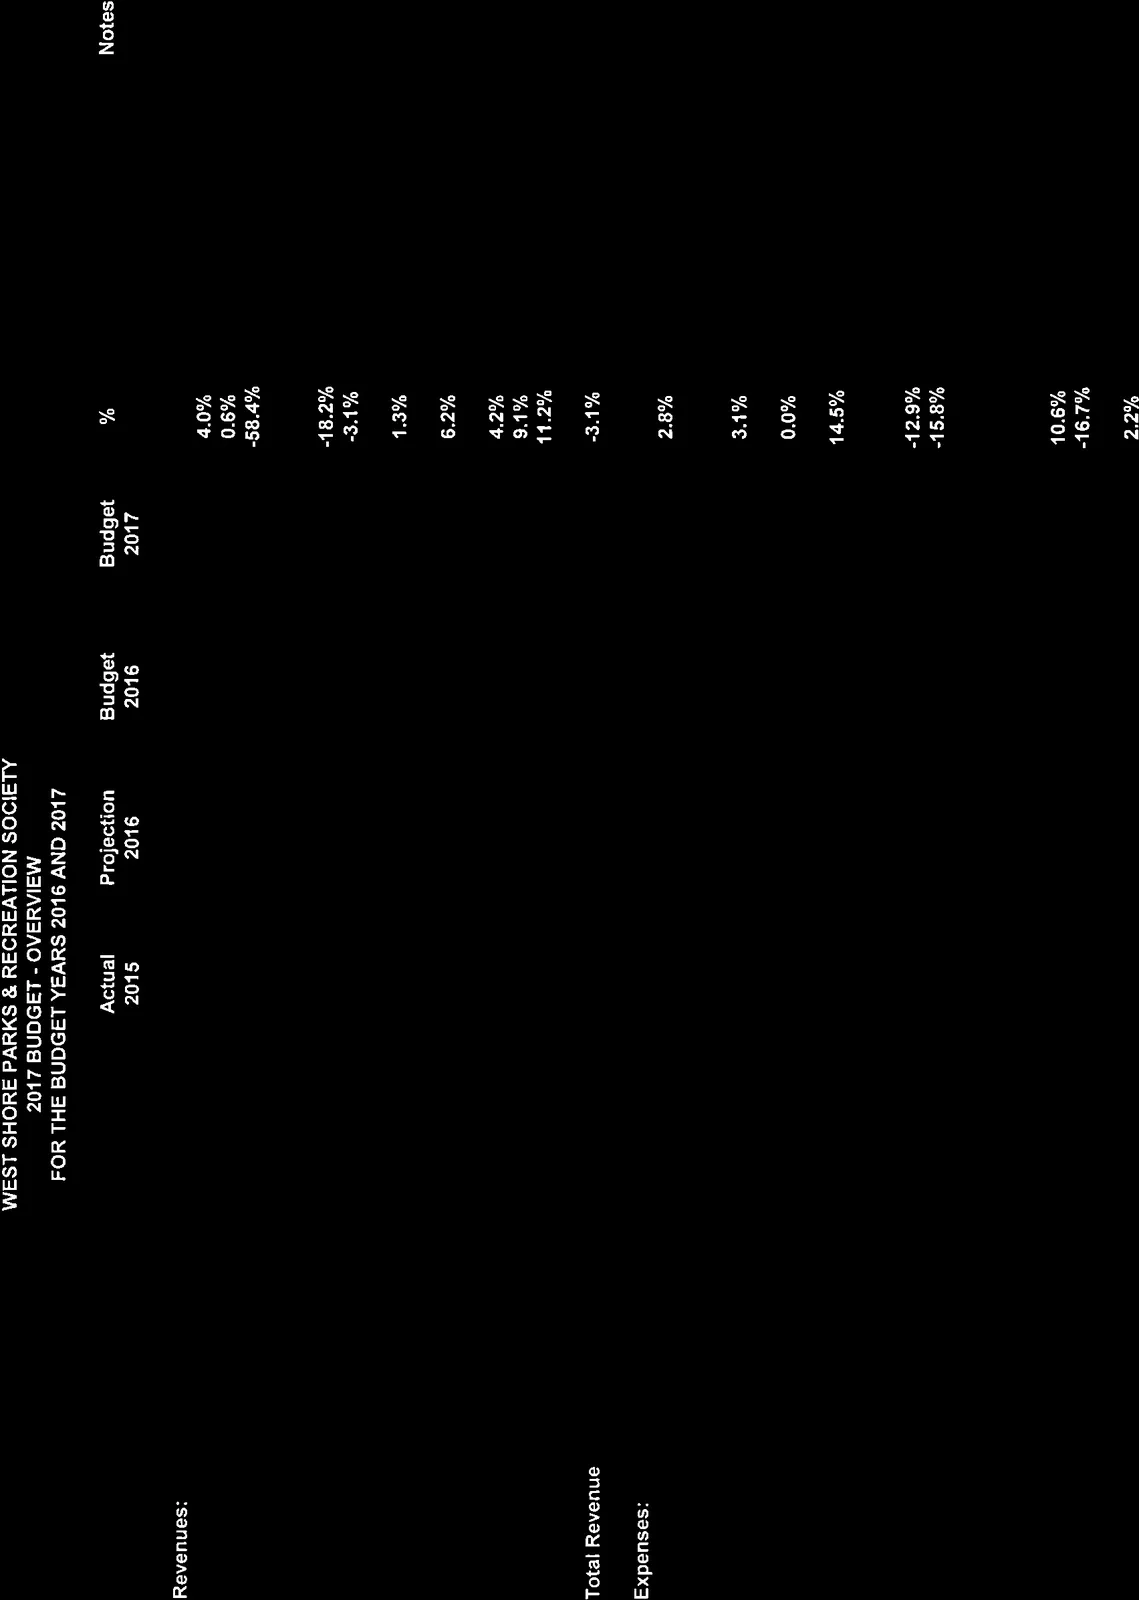
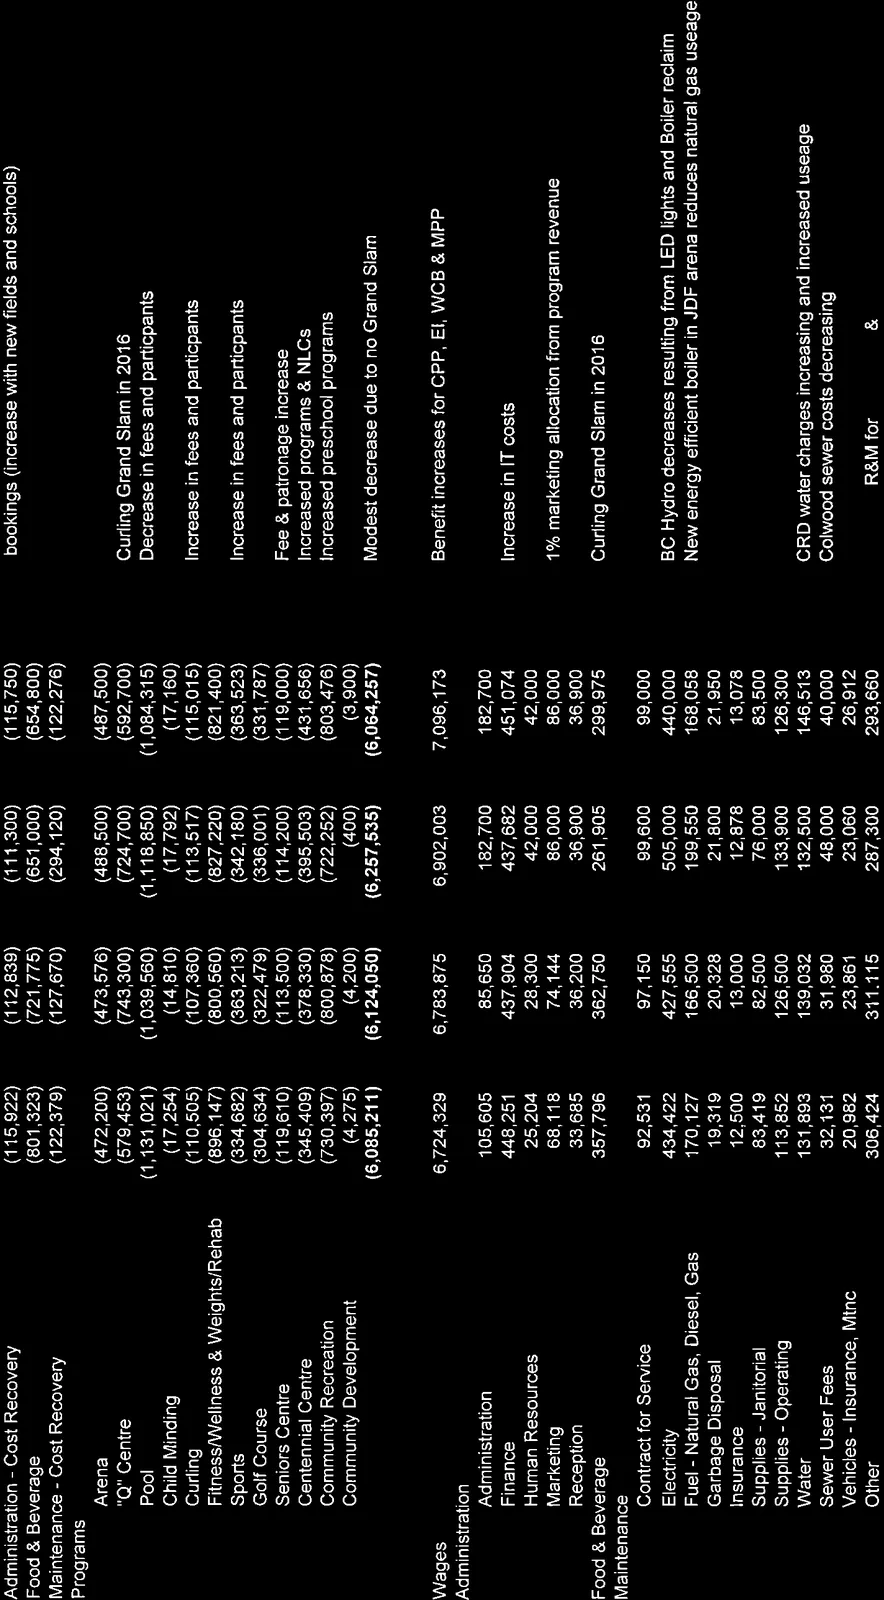
WEST SHORE PARKS & RECREATION SOCIETY
2017 BUDGET - OVERVIEW
FOR THE BUDGET YEARS 2016 AND 2017
| Actual 2015 | Projection 2016 | Budget 2016 | Budget 2017 | % | Notes | |
|---|---|---|---|---|---|---|
| Revenues: | ||||||
| Administration - Cost Recovery | (115,922) | (112,839) | (111,300) | (115,750) | 4.0% | bookings (increase with new fields and schools) |
| Food & Beverage | (801,323) | (721,775) | (651,000) | (654,800) | 0.6% | |
| Maintenance - Cost Recovery | (122,379) | (127,670) | (294,120) | (122,276) | -58.4% | |
| Programs | ||||||
| Arena | (472,200) | (473,576) | (488,500) | (487,500) | ||
| "Q" Centre | (579,453) | (743,300) | (724,700) | (592,700) | -18.2% | Curling Grand Slam in 2016 |
| Pool | (1,131,021) | (1,039,560) | (1,118,850) | (1,084,315) | -3.1% | Decrease in fees and participants |
| Child Minding | (17,254) | (14,810) | (17,792) | (17,160) | ||
| Curling | (110,505) | (107,360) | (113,517) | (115,015) | 1.3% | Increase in fees and participants |
| Fitness/Wellness & Weights/Rehab | (896,147) | (800,560) | (827,220) | (821,400) | ||
| Sports | (334,682) | (363,213) | (342,180) | (363,523) | 6.2% | Increase in fees and participants |
| Golf Course | (304,634) | (322,479) | (336,001) | (331,787) | ||
| Seniors Centre | (119,610) | (113,500) | (114,200) | (119,000) | 4.2% | Fee & patronage increase |
| Centennial Centre | (345,409) | (378,330) | (395,503) | (431,656) | 9.1% | Increased programs & NLCs |
| Community Recreation | (730,397) | (800,878) | (722,252) | (803,476) | 11.2% | Increased preschool programs |
| Community Development | (4,275) | (4,200) | (400) | (3,900) | ||
| Total Revenue | (6,085,211) | (6,124,050) | (6,257,535) | (6,064,257) | -3.1% | Modest decrease due to no Grand Slam |
| Expenses: | ||||||
| Wages | 6,724,329 | 6,783,875 | 6,902,003 | 7,096,173 | 2.8% | Benefit increases for CPP, EI, WCB & MPP |
| Administration | ||||||
| Administration | 105,605 | 85,650 | 182,700 | 182,700 | ||
| Finance | 448,251 | 437,904 | 437,682 | 451,074 | 3.1% | Increase in IT costs |
| Human Resources | 25,204 | 28,300 | 42,000 | 42,000 | ||
| Marketing | 68,118 | 74,144 | 86,000 | 86,000 | 0.0% | 1% marketing allocation from program revenue |
| Reception | 33,685 | 36,200 | 36,900 | 36,900 | ||
| Food & Beverage | 357,796 | 362,750 | 261,905 | 299,975 | 14.5% | Curling Grand Slam in 2016 |
| Maintenance | ||||||
| Contract for Service | 92,531 | 97,150 | 99,600 | 99,000 | ||
| Electricity | 434,422 | 427,555 | 505,000 | 440,000 | -12.9% | BC Hydro decreases resulting from LED lights and Boiler reclaim |
| Fuel - Natural Gas, Diesel, Gas | 170,127 | 166,500 | 199,550 | 168,058 | -15.8% | New energy efficient boiler in JDF arena reduces natural gas useage |
| Garbage Disposal | 19,319 | 20,328 | 21,800 | 21,950 | ||
| Insurance | 12,500 | 13,000 | 12,878 | 13,078 | ||
| Supplies - Janitorial | 83,419 | 82,500 | 76,000 | 83,500 | ||
| Supplies - Operating | 113,852 | 126,500 | 133,900 | 126,300 | ||
| Water | 131,893 | 139,032 | 132,500 | 146,513 | 10.6% | CRD water charges increasing and increased useage |
| Sewer User Fees | 32,131 | 31,980 | 48,000 | 40,000 | -16.7% | Colwood sewer costs decreasing |
| Vehicles - Insurance, Mtnc | 20,982 | 23,861 | 23,060 | 26,912 | ||
| Other | 306,424 | 311,115 | 287,300 | 293,660 | 2.2% | Security, R&M for buildings & equipment |
Page 89–90
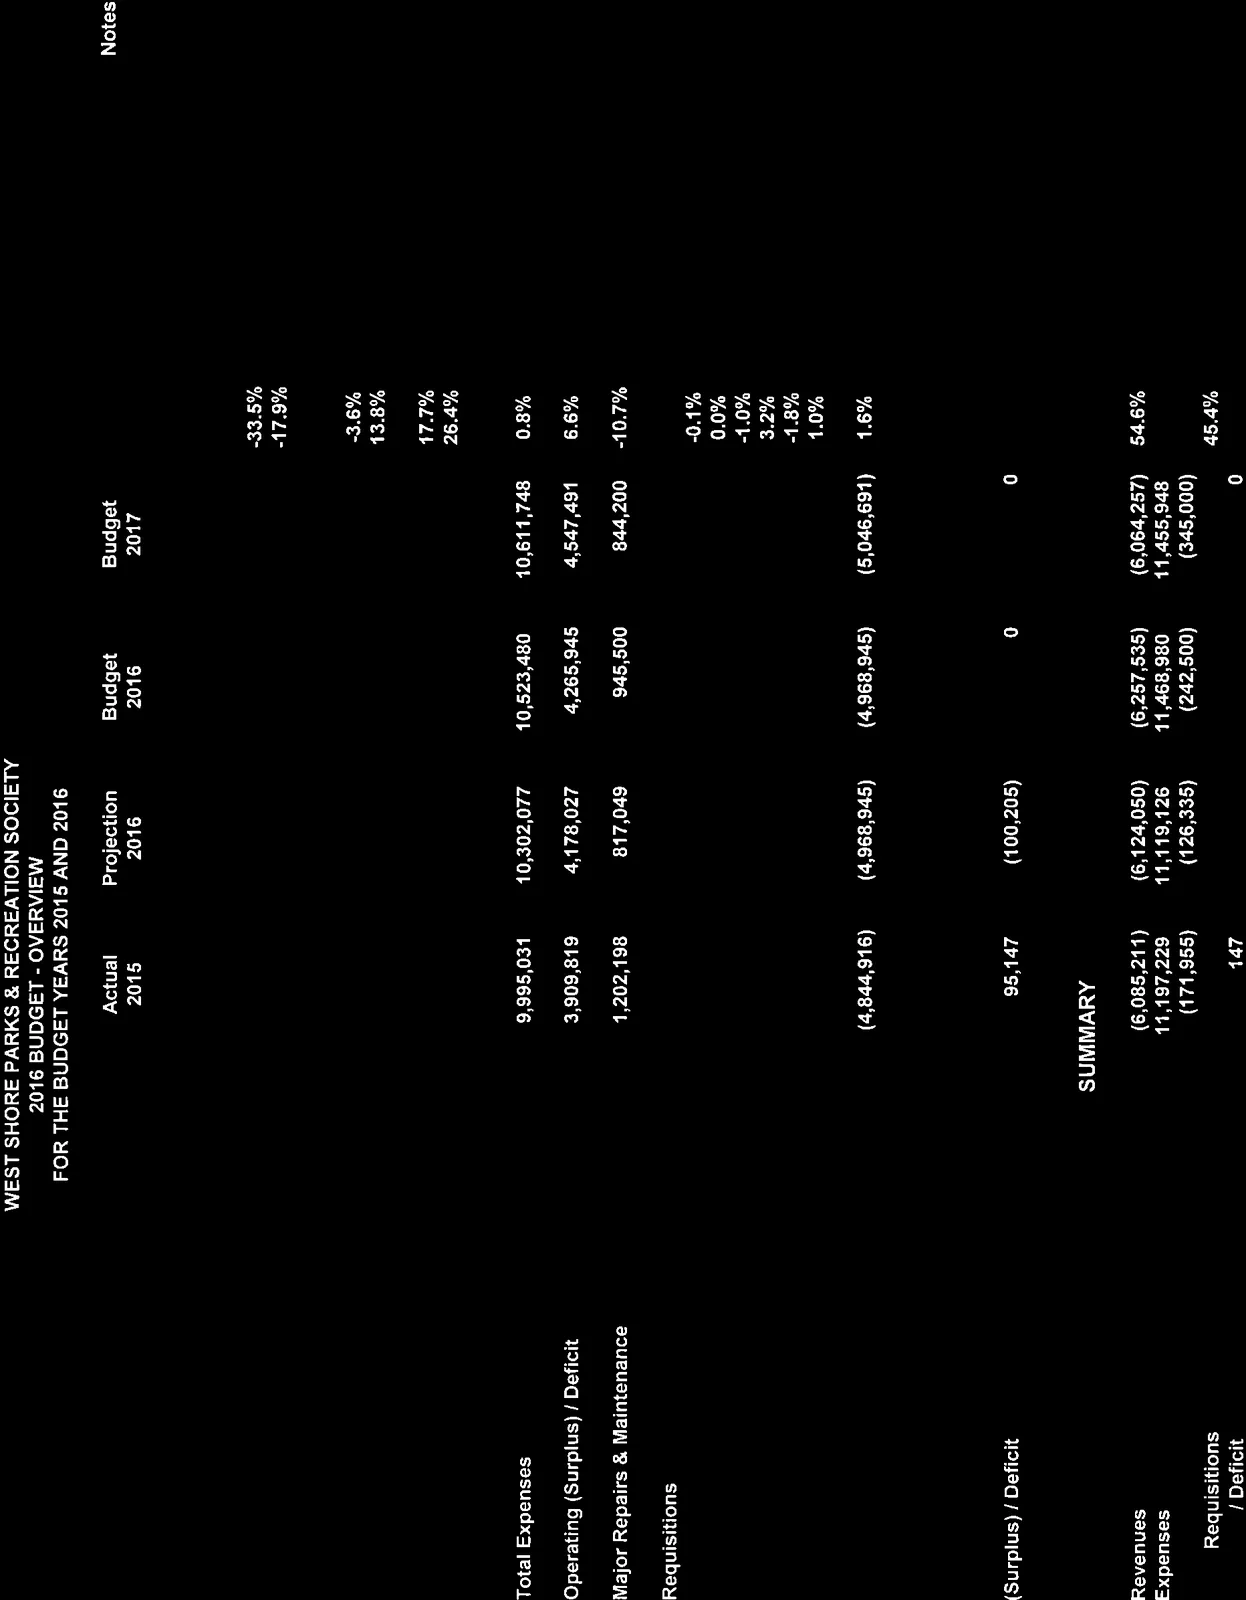
WEST SHORE PARKS & RECREATION SOCIETY
2016 BUDGET - OVERVIEW
FOR THE BUDGET YEARS 2015 AND 2016
| Actual 2015 | Projection 2016 | Budget 2016 | Budget 2017 | % | Notes | |
|---|---|---|---|---|---|---|
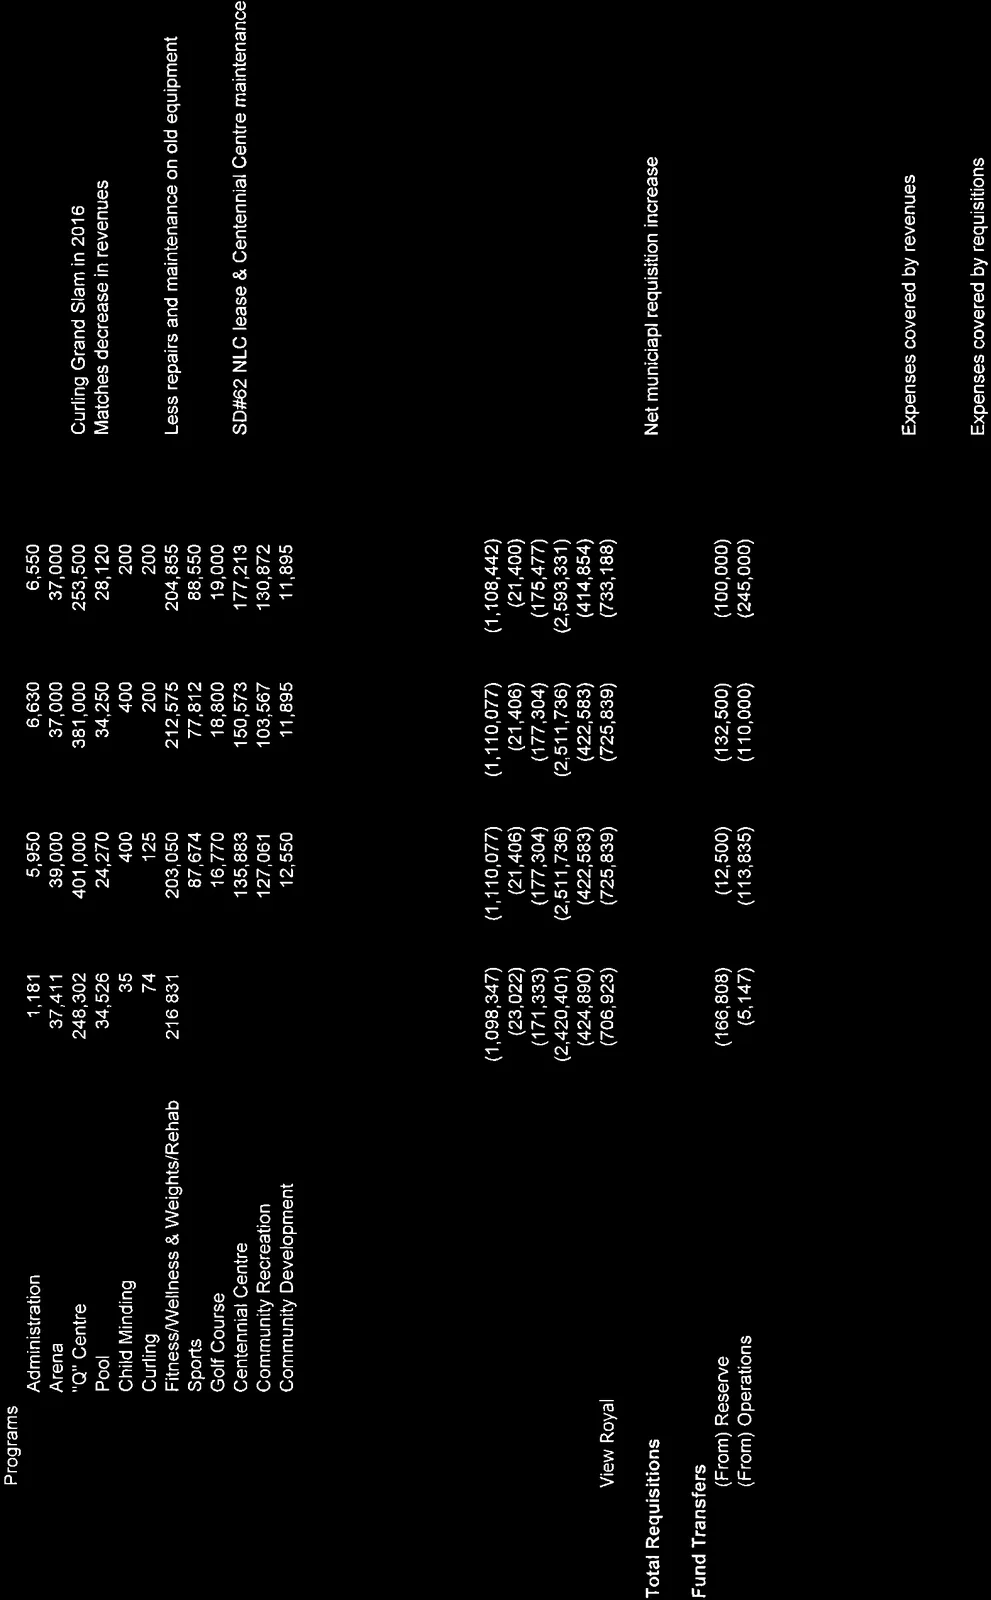
| Programs | ||||||
| Administration | 1,181 | 5,950 | 6,630 | 6,550 | ||
| Arena | 37,411 | 39,000 | 37,000 | 37,000 | ||
| "Q" Centre | 248,302 | 401,000 | 381,000 | 253,500 | -33.5% | Curling Grand Slam in 2016 |
| Pool | 34,526 | 24,270 | 34,250 | 28,120 | -17.9% | Matches decrease in revenues |
| Child Minding | 35 | 400 | 400 | 200 | ||
| Curling | 74 | 125 | 200 | 200 | ||
| Fitness/Wellness & Weights/Rehab | 216,831 | 203,050 | 212,575 | 204,855 | -3.6% | Less repairs and maintenance on old equipment |
| Sports | 69,546 | 87,674 | 77,812 | 88,550 | 13.8% | |
| Golf Course | 13,067 | 16,770 | 18,800 | 19,000 | ||
| Centennial Centre | 87,194 | 135,883 | 150,573 | 177,213 | 17.7% | SD#62 NLC lease & Centennial Centre maintenance |
| Community Recreation | 94,234 | 127,061 | 103,567 | 130,872 | 26.4% | |
| Community Development | 12,039 | 12,550 | 11,895 | 11,895 | ||
| Total Expenses | 9,995,031 | 10,302,077 | 10,523,480 | 10,611,748 | 0.8% | |
| Operating (Surplus) / Deficit | 3,909,819 | 4,178,027 | 4,265,945 | 4,547,491 | 6.6% | |
| Major Repairs & Maintenance | 1,202,198 | 817,049 | 945,500 | 844,200 | -10.7% | |
| Requisitions | ||||||
| Colwood | (1,098,347) | (1,110,077) | (1,110,077) | (1,108,442) | -0.1% | |
| Electoral | (23,022) | (21,406) | (21,406) | (21,400) | 0.0% | |
| Highlands | (171,333) | (177,304) | (177,304) | (175,477) | -1.0% | |
| Langford | (2,420,401) | (2,511,736) | (2,511,736) | (2,593,331) | 3.2% | |
| Metchosin | (424,890) | (422,583) | (422,583) | (414,854) | -1.8% | |
| View Royal | (706,923) | (725,839) | (725,839) | (733,188) | 1.0% | |
| Total Requisitions | (4,844,916) | (4,968,945) | (4,968,945) | (5,046,691) | 1.6% | Net municipal requisition increase |
| Fund Transfers | ||||||
| (From) Reserve | (166,808) | (12,500) | (132,500) | (100,000) | ||
| (From) Operations | (5,147) | (113,835) | (110,000) | (245,000) | ||
| (Surplus) / Deficit | 95,147 | (100,205) | 0 | 0 |
SUMMARY
| Actual 2015 | Projection 2016 | Budget 2016 | Budget 2017 | % | Notes | |
|---|---|---|---|---|---|---|
| Revenues | (6,085,211) | (6,124,050) | (6,257,535) | (6,064,257) | 54.6% | Expenses covered by revenues |
| Expenses | 11,197,229 | 11,119,126 | 11,468,980 | 11,455,948 | ||
| Transfers | (171,955) | (126,335) | (242,500) | (345,000) | ||
| Total Requisitions | (4,844,916) | (4,968,945) | (4,968,945) | (5,046,691) | 45.4% | Expenses covered by requisitions |
| (Surplus) / Deficit | 95,147 | (100,205) | (0) | 0 |

Page 89–90
Extracted from: 2017 01 17 Council Agenda - Agenda - Pdf