Financial Analysis of Proposed Redevelopment of the Christie Point Site
A financial feasibility study by Coriolis Consulting Corp regarding community amenity contributions for the Christie Point project.
VIA EMAIL
2 May 2017
Lindsay Chase MCIP RPP Director of Development Services Town of View Royal 45 View Royal Ave Victoria, BC V9B 1A6
Re: Financial Analysis of Proposed Redevelopment of the Christie Point Site
As you requested, we have analyzed the proposed redevelopment of the Christie Point site as an input to discussions between the municipality and the developer regarding possible community amenity contributions associated with the rezoning of the site.
1.0 INTRODUCTION
Christie Point is a waterfront site located in the Town of View Royal. It is currently developed with older, low density rental units. The owner is proposing a complete redevelopment of the site to a higher density, with all of the new units being rental. The municipality wants to know if the proposed redevelopment has the financial ability to provide any community amenity contribution, in the form of on-site amenities, cash-in-lieu, or some form of affordable housing.
2.0 APPROACH TO ANALYSIS
We use the following approach to the analysis:
- We estimate the current value of the site by reviewing three indicators of value: a. The current assessed value. b. The value of the property as income producing property. c. The value of the site as a redevelopment candidate under existing zoning.
- We construct a financial model of the proposed redevelopment concept to estimate the value of the land that is supported by the proposed rezoning. The model calculates the land value by estimating the end value of the project and then deducting all development costs.
- If the land value after rezoning is higher than the existing property value, then there is a financial basis for a discussion about possible community amenity contributions.
3.0 SITE DESCRIPTION
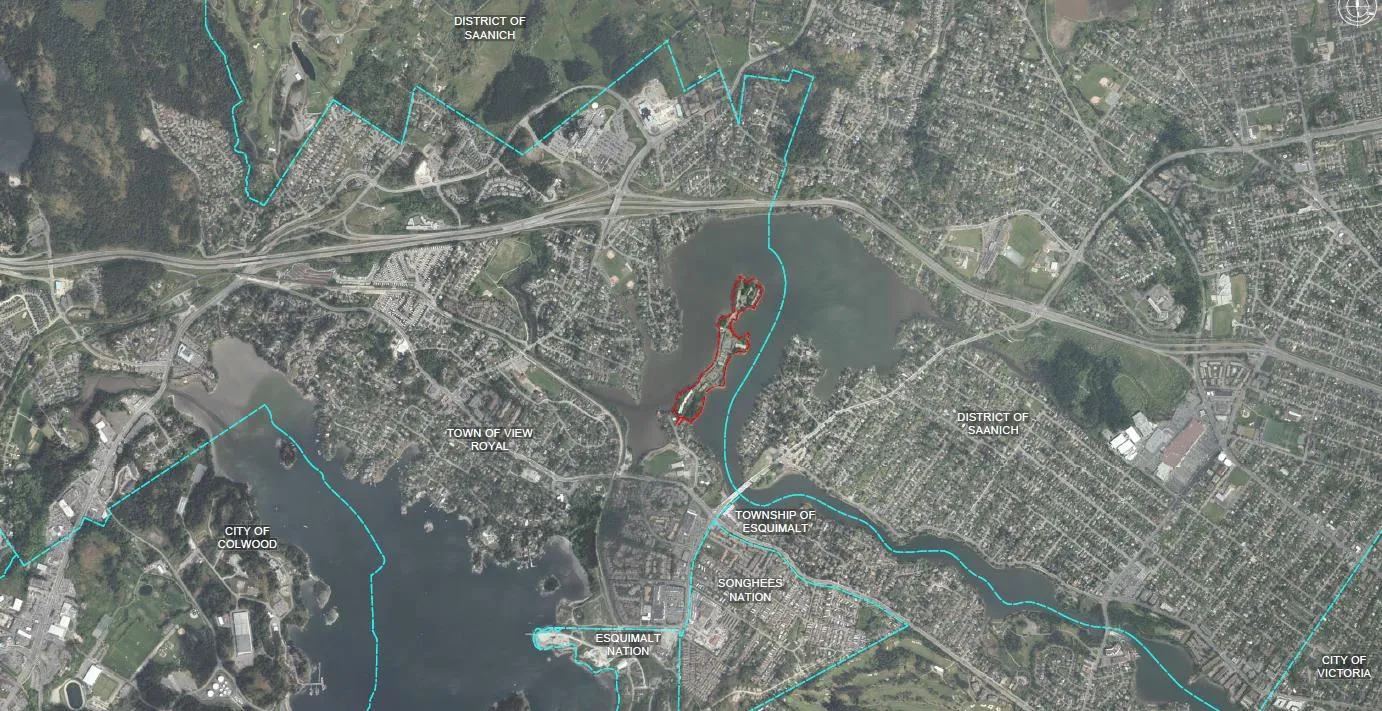
The subject site is on a 6.3 hectare (15.8 acre) waterfront peninsula in the Portage Inlet, located at 2861 Craigowan Road.
Exhibit 1: Location of Subject Site
Source: Christie Point Redevelopment Rezoning Application
The entire site is designated ‘Mixed Residential’ (M-R) under the Official Community Plan and is zoned ‘Ground-Oriented Multiple-Unit Residential’ (RM-1).
The Mixed Residential designation under the Official Community Plan allows for detached homes on small lots, townhouses, and low-rise apartments. Townhouse development is permitted up to 3 storeys with a maximum floor space ratio (FSR) of 1.25 and apartment development is permitted up to 4 storeys with a maximum FSR of 1.6.
The Official Community Plan also includes land use policy which encourages ‘any future redevelopment at Christie Point to include a mix of medium density residential and park uses’. It also indicates ‘Development at this location should be carefully reviewed to ensure that environmentally sensitive areas are protected, potential sea-level rise issues are addressed, and safe and efficient road access from the Island Highway is maintained’.¹
The site is zoned Ground-Oriented Multiple-Unit Residential, which allows for detached homes, duplexes, and townhouses up to a maximum FSR of 0.8.² Lot coverage is permitted up to 40% of the site at a maximum building height of 7.5 metres.
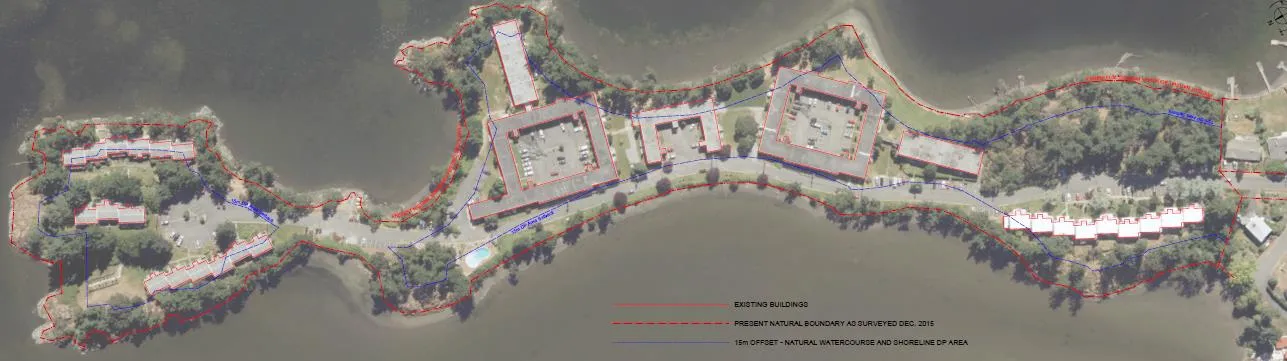
There are currently 161 units on site, including 113 apartment units and 48 townhouse units (Exhibit 2). There are 5 apartment buildings in the centre of the site with 2 and 3 bedroom apartment units, and 4 townhouse buildings at the outer edges of the site with 3 bedroom townhomes (Exhibit 3). All buildings are 2 storeys.
Exhibit 2: Existing Units at the Subject Site
| Number of Units | Average Size (sq. ft.) | Existing Area (sq. ft.) | % of Area | |
|---|---|---|---|---|
| Two Bedroom Apartment Units | 103 | 840 | 86,520 | 57% |
| Three Bedroom Apartment Units | 10 | 995 | 9,950 | 7% |
| Three Bedroom Townhouse Units | 48 | 1,135 | 54,480 | 36% |
| Total | 161 | 938 | 150,950 | 100% |
Source: Town of View Royal
Exhibit 3: Aerial Photograph of Existing Units at the Subject Site
Source: Christie Point Redevelopment Rezoning Application
Land use surrounding the Portage Inlet is predominantly single family residential, with Highway 1 running east to west at the north end of the inlet. Shoreline Community Middle School is located directly to the south of the site. Admiral’s Walk Shopping Centre is a neighbourhood commercial centre located further to the south which includes a Thrifty’s Foods, Coast Capital Bank and Rexall Pharmacy.
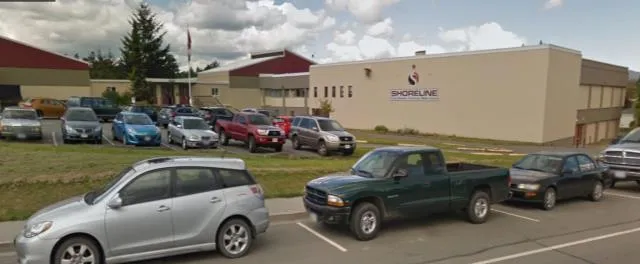
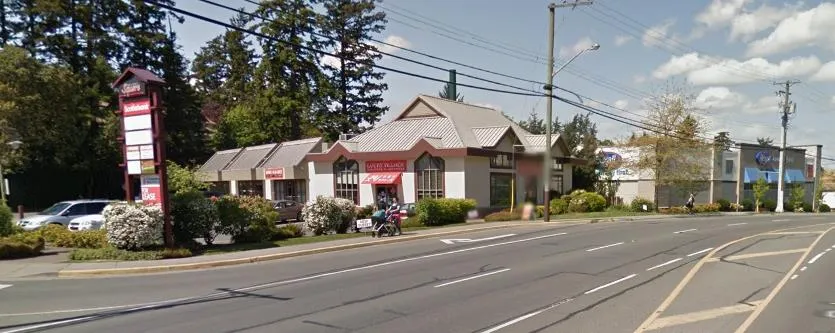
Source: Google Earth
4.0 PROJECT DESCRIPTION
4.1 DEVELOPMENT PROPOSAL
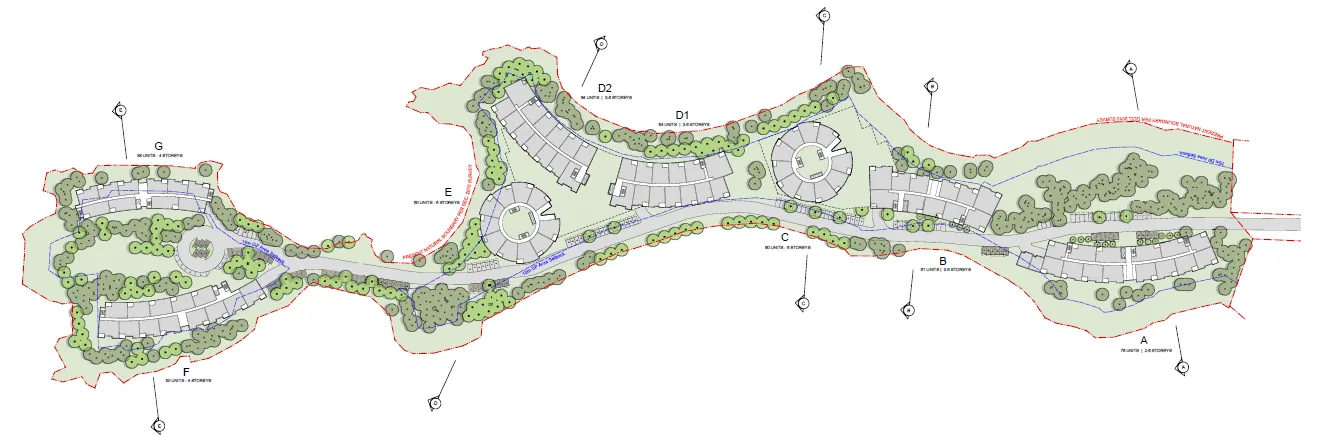
Realstar Management has proposed to redevelop Christie Point with 473 purpose-built rental units in 8 buildings. Based on the proposed concept plan and discussions with Realstar, the units will be predominantly apartment units, with the potential for some podium townhouse units.
Exhibit 4 summarizes the total number of units and floorspace by building. Given the gross floor area of the building and the total number of units proposed, the average gross floor area per unit is about 1,650 square feet. Discussions with Realstar indicate the proposed project will have a net-to-gross ratio of 70%, which translates into a net unit size of about 1,150 square feet per unit. Realstar indicates the building efficiency is lower than the standard 85% due to flood construction requirements³, administrative office space for rental inquiries and tenant services, common amenity space, and support space for Realstar maintenance staff. There are two round buildings with single-loaded hallways which will also reduce building efficiency.
Exhibit 4: Christie Point Redevelopment Proposal
| Number of Units | Approximate Floor Area (sq. ft.) | Average Gross Area Per Unit (sq. ft.) | Average Net Unit Size (sq. ft.) | |
|---|---|---|---|---|
| Building A | 76 | 125,000 | 1,645 | 1,151 |
| Building B | 61 | 102,000 | 1,672 | 1,170 |
| Building C | 60 | 100,000 | 1,667 | 1,167 |
| Building D1 | 64 | 108,000 | 1,688 | 1,181 |
| Building D2 | 64 | 108,000 | 1,688 | 1,181 |
| Building E | 60 | 100,000 | 1,667 | 1,167 |
| Building F | 50 | 79,000 | 1,580 | 1,106 |
| Building G | 38 | 59,000 | 1,553 | 1,087 |
| Total | 473 | 781,000 | 1,651 | 1,156 |
Source: Christie Point Redevelopment Rezoning Application
Buildings range in size from 4 to 6 storeys in height. Four of the buildings step down to 2 to 3 storeys to ‘respond to site topography and opening view angles from neighbouring shorelines.’⁴
The project will have 594 parking spaces, including 460 underground spaces⁵ and 134 surface parking spaces. Overall, the proposal includes 1.26 parking spaces per unit, including visitor parking.
Exhibit 5: Christie Point Redevelopment - Proposed Concept Plan
Source: Christie Point Redevelopment Rezoning Application
Exhibit 6 summarizes applicable zoning by-law regulations and proposed zoning by-law amendments. The proposed density on the site totals 1.15 FSR which is permitted under the Official Community Plan, but requires a zoning by-law amendment. The base density permitted under the ‘RM-1’ zoning is 0.6 FSR with an additional 0.1 FSR for 80% underground parking and 0.1 FSR for 75% green roof. The proposed floorspace of 781,000 square feet yields an FSR of 1.15 and will require a rezoning.
Exhibit 6: Existing Zoning By-law and Proposed Zoning By-law Amendments
| Existing Zoning By-law | Proposed Zoning By-Law Amendments | |
|---|---|---|
| FSR | 0.8⁶ | 1.15 |
| Maximum Building Height | 7.5m | 26.0m |
| Maximum Lot Coverage | 40% | No change |
Source: Coriolis Consulting
The maximum building height permitted under the zoning by-law is 7.5 m. The proposed maximum building height is 26.0 m, requiring an amendment.
Lot coverage will increase from the existing 217,700 square feet to 266,300 square feet in the proposal, or from 32% to 39.2% lot coverage.⁷ This is permitted under the existing maximum lot coverage of 40%.
The project will have 1.26 parking spaces per unit. The zoning by-law requires 1 parking space per studio or one bedroom unit, 1.5 parking spaces per two bedroom unit and 2 parking spaces per three bedroom unit. While we do not know the project unit mix, the large average unit size indicates most units will be 2 and 3 bedroom units. This suggests a parking by-law amendment will be required.
Realstar Management indicates the project will be phased over 5 years which includes 1 year for the development permit process and 4 years for project build-out. The number, timing, and breakdown of potential construction phases has not yet been determined. Realstar has proposed one possible phasing scenario which is summarized in Exhibit 7. This involves the demolition of 56 units in Phase 1 and construction of buildings A, B and C. The remaining 105 units will be demolished at the beginning of Phase 2, followed by construction of buildings D1, D2, E, F and G.
Exhibit 7: Christie Point - Redevelopment Phasing Plan
| Phase 1 | Phase 2 | |||||
|---|---|---|---|---|---|---|
| Year 0 | Year 1 | Year 2 | Year 3 | Year 4 | Year 5 | |
| Remaining Existing Units | ||||||
| Apartment Units | 113 | 75 | 75 | - | - | - |
| Townhouse Units | 48 | 30 | 30 | - | - | - |
| Total | 161 | 105 | 105 | |||
| New Units | 197 | 197 | 473 |
Source: Realstar Management
4.2 COMMENTS ON DEVELOPMENT PROPOSAL
There are two components of the development proposal which are not typical for a purpose-built rental apartment project.
The proposed average net unit size of 1,150 square feet is very large. Our survey of units currently renting in the area indicates the average net unit size is around 715 square feet.⁸ An additional survey of purpose built rental projects in Metro Vancouver indicates average net unit size is around 650 square feet. This is common for purpose-built rental projects which generate a higher rent per square foot for studio and one bedroom units. The large average unit size will reduce the achievable rents per square foot and will have a downward influence on the estimated land value in the redevelopment scenario. On the other hand, the large average unit size means a high proportion of the units will be 2 or 3 bedroom units which are suitable for families.
The second component which is not typical for apartment development is the building efficiency. The standard net-to-gross ratio for an apartment building is 85%, and accounts for common areas, hallways and elevators. The net-to-gross ratio for this building is 70%. The low building efficiency also has a downward influence on the estimated land value in the redevelopment scenario.
5.0 EXISTING VALUE
We use three approaches to determine the existing value of the site:
- The current assessed value.
- The value of the property as income producing property.
- The value of the site as a redevelopment candidate under existing zoning.
5.1 ASSESSED VALUE
The assessed value for the property is $36,530,000 based on the 2016 BC Assessment. This includes a $15.1 million assessment for the land and $21.4 million for existing improvements on the site.
Exhibit 8: Christie Point (2861 Craigowan Road) – Assessed Value (2016)
| 2016 Assessed Value | |
|---|---|
| Land | $15,141,000 |
| Building | $21,389,000 |
| Total | $36,530,000 |
Source: BC Assessment
5.2 INCOME APPROACH
We estimate the value of the property assuming the existing 48 townhouse and 113 apartment units are maintained as income producing assets.
Rental rates for existing townhouse and apartment units were provided by Realstar and represent an average across each unit type (Exhibit 9).
Exhibit 9: Christie Point – Average In-Place Rents
| Average Monthly Rent / Unit | |
|---|---|
| Apartment Two Bedroom Units | $1,200 |
| Apartment Three Bedrooms Units | $1,419 |
| Townhouse Three Bedroom Units | $1,634 |
| Overall Average Rents | $1,343 |
Source: Realstar Management
Parking revenue assumptions were also provided by the applicant with each space generating about $35 per month. The total number of parking spaces is estimated using parking standards in the current zoning by-law.
Operating cost assumptions are based on the cost per unit of operating a typical market rental project. A cap rate of 4.5% is used based on the Colliers Q4 2016 cap rate report for multifamily projects in Victoria.
Using the income approach, we estimate the value of the property is about $41.3 million, with the apartment units valued at $26.4 million and the townhouse units valued at $14.9 million. For a complete list of detailed assumptions and the financial analysis see Attachment 2.
Exhibit 10: Christie Point – Value Based on Income Approach
| Income Approach | |
|---|---|
| Apartment Units | $26,421,000 |
| Townhouse Units | $14,854,000 |
| Total | $41,275,000 |
Source: Coriolis Consulting
The value based on this approach does not take into account any deferred maintenance or capital upgrades which are required on the building. According to the Christie Point Comprehensive Redevelopment Plan, Realstar began exploration of redevelopment options in early 2016, as cosmetic refurbishment of the suites is deemed no longer adequate for the long-term sustainability of the property and the building is reaching the end of its useful life.⁹ This suggests capital upgrades required at the building could be substantial. The capital cost of upgrading the building would reduce the estimate based on the income approach of $41.3 million.
5.3 LAND VALUE UNDER EXISTING ZONING
We also estimate the value of the subject site as a redevelopment site under the existing zoning. To do this, we estimate the land value of the property assuming the applicant redevelops the property to the highest and best use permitted under the existing regulations.
The ‘Ground-Oriented Multiple-Unit Residential’ (RM-1) zoning allows townhouse development up to 0.6 FSR base density, plus 0.1 FSR for 80% underground parking and 0.1 FSR for 75% green roof coverage, for a maximum total density of 0.8 FSR.¹⁰ This FSR translates into a total of 340 townhouse units permitted at the subject site, based on an average townhouse size of 1,595 square feet.¹¹
The ‘Mixed Residential’ (M-R) designation in the Official Community Plan permits apartment development up to 1.6 FSR. Based on the more restrictive zoning, we have assumed a maximum of 340 townhouse units could be developed on-site at an FSR of 0.8. We tested land value generated by both strata and rental development, and found strata development to generate the higher land value.
We estimate the land value of the site by deducting all project costs from project revenues and accounting for a developer profit margin of 15%. This generates a redevelopment land value of about $27.1 million.
For details on the financial analysis, see Attachment 3.
Exhibit 11: Christie Point – Redevelopment Value Under Existing Zoning
| Redevelopment Value Under Existing Zoning | |
|---|---|
| Townhouse Units | $27,092,085 |
Source: Coriolis Consulting
We have not factored in the time to absorb the townhouse units on-site which would reduce the redevelopment value under existing zoning.
5.4 SITE VALUE
Our analysis shows that the value of the existing rental property ranges between the assessed value of $36.5 million and the maximum value based on income (before any deductions for major capital upgrades) of $41.3 million. If we assume that BC Assessment has considered the depreciated condition of the buildings, we can characterize the $4.8 million difference between assessed value and value based on income as the need for capital upgrades required on the building. A $4.8 million capital upgrade translates into around $28 per gross square foot of building area¹² or about $29,800 per unit. This is equivalent to only a modest upgrade for an older building, so we assume the $36.5 million assessment value is a reasonable estimate for the existing value of the property. This is higher than the $27.1 million value as a redevelopment site under existing zoning.
Exhibit 12: Existing Value of Christie Point
| 2016 Assessed Value | Value Based on Income Approach | Redevelopment Value Under Existing Zoning | |
|---|---|---|---|
| Existing Value | $36,530,000 | $41,275,000 | $27,092,085 |
Source: Coriolis Consulting
Therefore, for this analysis we use $36.5 million as the current property value and $27.1 million as the value of the site as though vacant.
In order to support a significant community amenity contribution, the rezoned land value should be at least $27.1 million and ideally more than $36.5 million.
6.0 REDEVELOPMENT VALUE
Next, we estimate the residual land value of the site based on the proposed redevelopment concept submitted by the applicant. We compare the redevelopment land value with the existing value to determine if there is any increase in land value generated by the rezoning.
6.1 PROPOSED DEVELOPMENT CONCEPT
In the first scenario, we test the proposed development concept provided by Realstar. We completed a detailed review of apartments units for rent in the area to determine project revenues. We received some project costs assumptions from Realstar and have provided estimates for the remaining costs.
1. Revenue and Value:
To determine achievable rents at the subject site, we completed a detailed review of apartment rental rates in the area (Attachment 1).
Based on apartment rents currently being achieved near the subject site, we assume the project could achieve the rents per square foot summarized in Exhibit 13.
Exhibit 13: Achievable Rents Per Square Foot at Christie Point
| Average Rent PSF per Month | |
|---|---|
| Studio Units | $2.91 |
| One Bedroom Units | $2.60 |
| Two Bedroom Units | $2.20 |
| Three Bedroom Units | $2.00 |
Source: Coriolis Consulting
In order to generate an average unit size of 1,150 square feet, the development would be comprised primarily of very large two and three bedroom units.¹³ One possible unit mix outlined in Exhibit 14 generates a weighted average rent of $2.13 per square foot.
Exhibit 14: Base Case - Blended Average Rents Per Square Foot
| % of Units | Total Units | Average Size (sq. ft.) | Total Rent per Month | Weighted Average Rent PSF per Month | |
|---|---|---|---|---|---|
| Studio Units | 5% | 24 | 500 | $1,457 | $2.91 |
| One Bedroom Units | 5% | 24 | 650 | $1,690 | $2.60 |
| Two Bedroom Units | 50% | 237 | 1,050 | $2,310 | $2.20 |
| Three Bedroom Units | 40% | 189 | 1,400 | $2,800 | $2.00 |
| Total | 100% | 473 | 1,143 | $2,432 | $2.13 |
Source: Coriolis Consulting
Additional revenue assumptions are included in Attachment 3.
2. Costs and Allowances
The following key cost assumptions and allowances were provided by the applicant:
- Hard construction costs of $210 per square foot, which includes one storey of concrete construction and five storeys of woodframe construction. We reviewed indicators to test the appropriateness of this assumption, including the BDC cost index, the Altus Group 2017 Cost Guide, and previous experience in the area. Based on the information we reviewed, this assumption is reasonable. However, it is at the high end of the cost range for this type of construction.
- An allowance of $5.0 million for site exclusions, which includes on-site servicing, landscaping and surface parking construction.
- A project management fee of 3.5% included on hard and soft costs.
- A contingency allowance of 5% included on hard costs, soft costs and the project management fee.
- A $1.5 million allowance for demolition of existing buildings.
- A cost of $2,000 per unit for fixtures and equipment in common areas.
The following assumptions used in our analysis are based on typical development assumptions:
- Soft costs and professional fees will total 9.0% of hard construction costs. This covers application fees, design, engineering, consultants, survey, legal, insurance, warranties, deficiencies, and other professional fees. This is within the typical range for a highrise residential development.
- Separate allowances included for property taxes and DCCs.
- A financing fee of 1.25% is included.
- No developer's profit margin. For rental projects developed by the owner, we assume that the objective is to earn the rate of return that is commensurate with the cap rate, not to earn a profit margin as would be expected by a developer of strata units for sale.
- A cap rate of 4%, which is lower than the rate applied to the existing project. The lower cap rate reflects the fact that the development will be new, with no need for capital upgrades in the short term. The 4% cap rate may be a little low, based on market evidence, but it has the effect of maximizing the value of the new project and therefore yielding a high-side estimate of the value of the land after rezoning.
Based on the above assumptions, we estimate the value of site under the proposed development scenario to be approximately $5.2 million.¹⁴ This is significantly below the existing property value of $36.5 million (and lower than the estimated vacant site value of $27 million) so does not generate a significant increase in land value that could be put towards a community amenity contribution. For assumptions and details on the analysis see Attachment 3.
We think it is worth noting that we have analyzed the financial performance of a wide range of rental housing redevelopment projects in a variety of regional housing markets in BC and other provinces and we have found that rental developments do not typically support a community amenity contribution except in extraordinary circumstances such as a very large increase in density or a very low existing land value (neither of which applies to the subject property).
Considering the apparent “loss” of property value, one might ask whether this project is viable. The proponent has two options: inject significant capital into a major renovation or demolish and redevelop. A renovation does not increase the number of units and would not significantly extend the life of the project.
Comparing the analysis of the existing situation to the redevelopment scenario (see Attachments 2 and 3) we see that:
- The value of the asset increases from $36.5 million to $260 million.
- Annual net operating income increases from just under $2 million per year to almost $10.5 million per year.
The developer is presumably willing to give up land value in order to create a much more valuable asset and greater revenue, rather than invest capital in a major upgrade of the existing units.
6.2 SENSITIVITY TESTING
We have already noted that the above-average unit sizes and the below-average efficiency have negative impact on project financial performance. If unit size is reduced and/or efficiency is increased, as the proposal evolves, the supportable land value will increase, although it will require significant improvements to both factors to generate enough land value lift to support a significant community amenity contribution.
7.0 BENEFITS OF THE PROPOSED DEVELOPMENT
The development as proposed does not generate a land lift that would support a major community contribution. However, it is important to note that the project has several features which could be considered advantageous to the municipality or community:
- The project will create 473 units of rental housing (a net increase of 312).
- The large units will be suitable for families.
- The project will pay about $2.9 million in DCC fees.
- The project has apparently offered a $1.0 million contribution to affordable housing. (This voluntary contribution may seem at odds with our conclusion that the project cannot support a significant CAC. Considering that this project is seeking a significant increase in height, unit count, and density, it is not surprising that the developer would want to offer some kind of community benefit. The $1.0 million is well under 1% of project cost, so it is not indicative of the ability to make a large contribution).
- According to The Town of View Royal, the project will be expected to provide off-site road and sidewalk improvements that benefit the area.
So, while the project does not appear able to support a large cash amenity contribution, it is providing an array of benefits.
8.0 CONCLUSION
Based on our analysis, a rezoning based on the development proposal submitted by the applicant does not generate an increase in land value that would support the financial ability to make a significant community amenity contribution.
We note that the concept includes a large average unit size and low efficiency. Improving these could have a significant upward effect on financial performance, land value, and potential for an amenity contribution. As proposed, the project should not be expected to make a significant amenity contribution, but the municipality should consider retesting the project if the applicant makes design changes that increase the number of units, reduce average unit size, or improve building efficiency.
CORIOLIS CONSULTING CORP.
Jay Wollenberg
¹ View Royal Official Community Plan. September 2011. Page 55. Policy LU8.4. ² Base Density of 0.6 FSR plus 0.1 FSR with provision of 80% underground parking and 0.1 FSR with provision of 75% green roof coverage. ³ Rising sea level mitigation through higher flood level construction requires that some spaces, such as mechanical equipment, electrical equipment, tenant storage lockers, and additional storage space be located at or above the main floor level. ⁴ Christie Point Comprehensive Development Plan. February 15, 2017. Pg. 34. ⁵ 70% underground parking. ⁶ FSR Base Density of 0.6 plus bonus of 0.1 for 80% underground parking and 0.1 for 75% green roof. ⁷ Both figures include site coverage of paved areas and site coverage of building footprints. ⁸ Includes a mix of one and two bedroom units. There were limited studio and three bedroom units renting in the four areas assessed: Downtown Victoria, Victoria West, Esquimalt and Langford/Colwood. See Attachment 1. ⁹ Realstar. Christie Point Comprehensive Redevelopment Plan. January 2017. Page 1. ¹⁰ Lot coverage is a maximum of 40% which requires 80% underground parking based on the site size and the existing by-law of 1.5 stalls per townhouse unit. ¹¹ Average townhouse size of the 14 units sold over the past year in View Royal that were built since 2012. ¹² Based on an estimated 168,292 square feet of gross floor area. ¹³ Average unit sizes take from survey of units currently marketing in the area. Size of one and two bedroom unit taken from the high end of the range of unit sizes surveyed. Unit sizes for studios based on ratio differential between studio and one bedroom units from a survey of purpose-built projects in Metro Vancouver. Size of three bedroom units were derived in order to generate the high average unit size. ¹⁴ Excludes a developer’s profit margin which would further reduce the land value.
Attachment 1 – Rental Rates Survey
Survey of Market Rents and Unit Sizes in Study Area
| Area | Development Name | Address | Number of Bedrooms | Size (Sq. Ft.) | Rent | Rent PSF | Construction | Age | Storeys | Notes |
|---|---|---|---|---|---|---|---|---|---|---|
| Downtown Victoria | 595 Pandora | 595 Pandora Avenue | 1 | 584 | $1,700 | $2.91 | Woodframe | 2017 | 5 | New build. Gym and amenity room. |
| Downtown Victoria | The City Place | 827 Fairfield Road | 1 | 520 | $1,700 | $3.27 | Woodframe | 2004 | 6 | Hydro not included - includes parking. |
| Downtown Victoria | The Escher | 838 Broughton Street | 1 | 475 | $1,550 | $3.26 | Concrete | 2017 | 10 | Underground parking, new build. |
| Downtown Victoria | The Escher | 838 Broughton Street | 1 | 1,035 | $2,895 | $2.80 | Concrete | 2017 | 10 | Underground parking, new build. |
| Downtown Victoria | The Escher | 838 Broughton Street | 1 | 652 | $1,600 | $2.45 | Concrete | 2017 | 10 | No parking or hydro. |
| Downtown Victoria | Hudson Walk One | 755 Caledonia | 1 | 560 | $1,510 | $2.70 | Concrete | 2017 | 15 | Parking available at $150/month. Storage $25 per month. |
| Downtown Victoria | The Wave | 845 Yates Street | 1 | 563 | $1,375 | $2.44 | Concrete | 2006 | 13 | No parking, utilities included. |
| Downtown Victoria | The Wave | 845 Yates Street | 2 | 910 | $2,150 | $2.36 | Concrete | 2006 | 13 | |
| Downtown Victoria | Hudson Walk One | 755 Caledonia | 2 | 1,270 | $2,795 | $2.20 | Concrete | 2017 | 15 | Parking available at $150/month |
| Victoria West | Promontory | 83 Saghalie | 1 | 550 | $1,850 | $3.36 | Concrete | 2014 | 21 | Size is approximate based on suite layout. Luxury building with swimming pool. |
| Victoria West | The Bayview Place | 100 Saghalie | 2 | 940 | $2,750 | $2.93 | Concrete | |||
| Langford | Waterstone | 3210 Jacklin Road | 1 | 653 | $1,395 | $2.14 | Woodframe | 2008 | 4 | New unit - parking extra for $20/month. |
| Langford | Station Street Apartments | 2885 Jacklin Rd | 1 | 568 | $1,175 | $2.07 | Woodframe | 2015 | 5 | No parking or hydro. |
| Langford | Roberts Place | 777 Hockley Ave | 1 | 668 | $1,400 | $2.10 | Woodframe | 2017 | 4 | |
| Langford | Village Walk West Apartments | 784 Hockley Ave | 1 | 550 | $1,400 | $2.55 | Woodframe | 2017 | 4 | New Build. Underground parking. |
| Langford | Roberts Place | 777 Hockley Ave | 2 | 845 | $1,500 | $1.78 | Woodframe | 2017 | 4 | |
| Langford | Maconnell Place West | 663 Goldstream Avenue | 2 | 810 | $1,600 | $1.98 | Woodframe | 2007 | 4 | Parking, locker included. |
| Average | 715 |
Source: Craigslist, Kijiji, Coriolis Consulting
Average Rental Rates Per Square Foot by Area
| One Bedroom | Two Bedroom | |
|---|---|---|
| Victoria West | $3.36 | $2.93 |
| Downtown Victoria | $2.83 | $2.28 |
| Langford/Colwood | $2.21 | $1.88 |
Source: Craigslist, Kijiji, Coriolis Consulting
Average Mix and Size of New Purpose Built Rental in Metro Vancouver
| Average Size (sq. ft.) | |
|---|---|
| Studio | 416 |
| One Bedroom | 572 |
| Two Bedroom | 778 |
| Three Bedroom | 1,101 |
| Total | 652 |
Source: Craigslist, Kijiji, Coriolis Consulting
Attachment 2 - Existing Value Key Assumptions
Income Approach Assumptions used to determine existing value based on the income approach include:
1. Revenue and Operating Assumptions: a) Rental rates for existing units are based on information provided by the applicant and are $1,200 per month for two bedroom apartment units, $1,419 per month for three bedroom apartment units and $1,634 per month for townhouse units. b) Parking revenue is assumed to be $35 per month per stall assuming 100% occupancy and 1.5 stalls per townhouse unit, 1.5 stalls for each two bedroom apartment unit and 2.0 stalls for each three bedroom apartment unit. Laundry revenue is assumed to be $10 per month for apartment units and is offered in-suite in townhouse units. c) A vacancy allowance of 1.0% based on a CMHC vacancy rate of 0.8% for purpose-built apartment units in View Royal d) Operating costs excluding property taxes are $3,500 for apartment units and $4,500 for townhouse units. This works out to approximately 23% of Effective Gross Revenue and is based on operating costs for typical purpose built rental projects and MLS data which shows monthly strata fees in the region are around $4.00 per square foot per year for older units. e) Cap rate of 4.5% from Q4 2016 Canada Cap Rate Report from Colliers International which indicates cap rates for multi-family properties range from 4.0% to 5.0%.
Value of Existing Apartment Units Using Income Approach
Assumptions Total Gross Floorspace: 113,812 sq.ft. Net Rentable Residential Floorspace: 96,740 or 85% of gross residential floorspace Total Number of Residential Units: 113 units Average Net Residential Unit Size: 854 sq.ft. net Number of Residential Parking Stalls: 175 stalls
Market Rental Rates Residential Units (average): $1,219 per unit per month Laundry Revenue: $10.00 per unit per month Parking Revenue: $35.00 per stall per month Residential Vacancy Allowance: 1.0%
Property Tax Allowance Residential Assessment: $23,345,804 Residential Tax Rate: 0.583% Residential Property Taxes: $136,128 or $1,205 per unit per year Residential Operating Costs (see notes): 23.0% of EGI or $3,507 per unit per year
Analysis Revenues Apartment Gross Potential Rent: $1,653,480 Parking Revenue: $73,290 Laundry Revenue: $13,560 Total Gross Potential Revenue: $1,740,330 Apartment Vacancy: $17,403 Effective Gross Apartment Revenue: $1,722,927
Residential Operating Expenses and Property Taxes Residential Property Taxes: $136,128 Residential Operating Expenses: $396,273.14 Total Operating Expenses and Property Taxes: $532,401 Net Operating Income on Residential: $1,190,526 Capitalization Rate on Residential: 4.50% Capitalized Value of Residential Space (rounded): $26,456,000
Source: Coriolis Consulting
Value of Existing Townhouse Units Using Income Approach
Assumptions Total Gross Floorspace: 54,480 sq.ft. Net Rentable Residential Floorspace: 54,480 or 100% of gross residential floorspace Total Number of Residential Units: 48 units Average Net Residential Unit Size: 1,135 sq.ft. net Number of Residential Parking Stalls: 72 stalls
Market Rental Rates Residential Units (average): $1,634 per unit per month Laundry Revenue: $0.00 per unit per month Parking Revenue: $35.00 per stall per month Residential Vacancy Allowance: 1.0%
Property Tax Allowance Residential Assessment: $13,184,196 Residential Tax Rate: 0.583% Residential Property Taxes: $76,876 or $1,602 per unit per year Residential Operating Costs (see notes): 23% of EGI or $4,508 per unit per year
Analysis Revenues Apartment Gross Potential Rent: $941,184 Parking Revenue: $30,240 Laundry Revenue: $0 Total Gross Potential Revenue: $971,424 Apartment Vacancy: $9,714 Effective Gross Apartment Revenue: $961,710
Residential Operating Expenses and Property Taxes Residential Property Taxes: $76,876 Residential Operating Expenses: $216,385 Total Operating Expenses and Property Taxes: $293,261 Net Operating Income on Residential: $668,449 Capitalization Rate on Residential: 4.50% Capitalized Value of Residential Space (rounded): $14,854,000
Source: Coriolis Consulting
Attachment 3 - Redevelopment Scenarios
Assumptions
1. Revenue and Value: a) Townhouse prices of $330 per square foot based on MLS sales of townhouses in View Royal over the past year. b) Apartment rental rates based on a review of rents currently being achieved in Victoria West, Downtown Victoria and Langford/Colwood by unit type in newer buildings (see Attachment 1). Parking revenue included in the rental rate based on survey of units currently renting in the area. c) Average net unit size of 1,150 square feet provided by the client. d) A vacancy allowance of 1.0% based on a CMHC vacancy rate of 0.8% for purpose-built apartment units in View Royal. e) Operating costs excluding property taxes of $4,000 per unit or $3.50 per square foot per year based on operating costs for newer purpose-built rental projects and strata fees in the region for newer apartment units. f) Cap rate of 4.0% based on Q4 2016 Canada Cap Rate Report from Colliers International which indicates cap rates for multi-family properties in Victoria range from 4.0% to 5.0%.
2. Policy: a) For assessment of smaller unit scenario, a parking allowance of 1.0 stalls per unit for one bedrooms, 1.5 stalls per unit for two bedrooms, 2.0 stalls per unit for three bedroom units. b) A rezoning fee of $60,206, public hearing fee of $2,500, a development permit fee $58,556 and building permit fee of $76,315 provided by the Town.
3. Building Cost Assumptions: a) Demolition cost of $1,500,000 for the site. b) Hard construction costs of $190 per sq. ft. for above grade woodframe townhouse residential floorspace based on the 2017 Altus Cost Guide (high quality). c) Hard construction costs of $260 per sq. ft. for concrete apartment residential floorspace based on the 2017 Altus Cost Guide (high quality). d) Allowance for site exclusions of $5.0 million including landscaping, on-site servicing and surface parking construction. e) Underground parking of $50,000 per stall or $75.00 per sq. ft. A total of 134 surface parking stalls included in ‘Site Exclusions’. f) Landscaping included in ‘Site Exclusions’. g) A project management fee of 3.5% included on hard and soft costs. h) Soft costs of 9% on hard costs are included for building permits and professional fees. i) A contingency allowance of 5% included on hard costs, soft costs and the project management fee. j) Fixtures and equipment fee of $2,000 per unit. k) Separate allowances included for property taxes and DCCs. l) A financing fee of 1.0% is included. m) No developer's profit margin.
Townhouse Value Under Redevelopment 0.8 FSR Major Assumptions (shading indicates figures that are inputs; unshaded cells are formulas)
Site and Building Size Site Size: 678,665 sq.ft. (6.30 hectares) Density: 0.80 FSR Residential Density Before Exclusions: 0.80 FSR Enclosed Balconies: 0.00 (0% of residential) In-suite storage: 0.00 (0.0 sf per unit) Effective Residential Density After Bonuses and Exclusions: 0.00 FSR Total Effective Gross Density After Bonuses and Exclusions: 0.80 FSR
Market Strata Residential floorspace Gross square feet: 542,932 Net saleable space: 542,932 sq.ft. or 100% of gross area Average Gross unit size: 1,595 sq.ft. gross Average Net unit size: 1,595 sq.ft. net Number of units: 340 units Two Bedroom Units: 68 Three Bedroom Units: 272 Total Market Strata Unit Parking Stalls: 511 stalls or 1.50 per unit Structured Garage Parking Stalls: 421 stalls Surface parking stalls: 90 stalls
Strata Revenue and Value Average Sales Price Per Sq. Ft.: $330 per sq.ft. of net saleable residential space Parking Stall(s): $0 per stall Storage Lockers: $0 per locker with 0 available Overall Average Sales Price Per Sq. Ft.: $330 per sq.ft. of net saleable residential space
Pre-Construction Costs Rezoning: $60,206 ($2,200 plus $0.1068 /sq. ft.) Public Hearing: $2,500 Development Permit Fee: $58,556 ($550 plus $0.11 /sq. ft.) Building Permit: $76,315 ($5,237 plus 0.075% construction costs)
Construction Costs Allowance for Demolition of Existing Buildings: $1,500,000 ($9 per gross sq.ft. of existing floorspace) Connection fees: $50,000 Green Roof: $2,035,995 ($4 per gross sq.ft. of existing floorspace) Hard Construction Costs: Market Strata Residential Area: $130 per gross sq.ft. of residential area Cost Per Underground Stall: $50,000 per underground stall Cost Per Garage Stall: $12,500 per garage stall Overall Costs Per Square Foot: $175 per gross sq.ft. Hard Cost Used in Analysis: $175
Landscaping: $1,696,663 or $5 per sq.ft. on 50% of site Soft costs/professional fees (excluding management): 9.0% of above Project Management: 3.5% of above Post Construction Holding Costs: $400 per unit per month on 50% of units for 12 months Contingency on hard and soft costs: 5.0% of hard and soft costs
Local Government Levies View Royal Development Cost Charge: $6,077 per market unit
Financing Assumptions Financing rate on construction costs: 5.0% on 50% of costs, assuming a 1.25 year construction period and a total loan of 75% on costs Financing fees: 1.00% of financed construction costs Financing on Land Acquisition: 5.0% during construction on 50% of land cost
Marketing and Commissions Commissions/sales costs on residential: 1.0% of gross strata market residential revenue Marketing on residential: 1.0% of gross strata market residential revenue
Property Taxes Tax Rate (New Multi-Residential): 0.583% of assessed value Current assessment (Year 1 of analysis): $36,530,000 for 2016 Assumed assessment after 1 year of construction (Year 2 of analysis): $89,583,780 (50% of completed project value)
Allowance for Developer's Profit: 15.0% of total costs or 13.0% of gross revenue
Revenue Gross Market Residential Sales Revenue: $179,167,560 Less commissions and sales costs: $1,791,676 Net residential sales revenue: $177,375,884 Allowance for Demolition of Existing Buildings: $1,500,000 Other Costs: $0 Connection fees: $50,000 Hard construction costs: $94,770,730 Landscaping: $1,696,663 Soft costs: $8,821,565 Project Management: $3,739,364 Residential Marketing: $1,791,676 Post Construction Holding Costs: $408,457 Contingency on hard and soft costs: $5,549,339 Municipal DCC: $2,068,397 Rezoning: $60,206 Public Hearing: $2,500 Development Permit Fee: $58,556 Building Permit: $76,315 Less property tax allowance during development: $183,840 Construction financing: $2,830,725 Financing fees/costs: $927,062 Total Project Costs Before Land Related: $124,535,395
Allowance for Developer's Profit: $23,363,450
Residual to Land and Land Carry: $29,477,040 Less financing on land during construction and approvals: $1,575,179 Less property purchase tax: $809,056 Residual Land Value: $27,092,805
Residual Value per sq.ft. of gross buildable floorspace: $50 Residual Value per sq.ft. of FSR under existing zoning: $50 Residual Value per sq.ft. of site: $40
Document Images
(1)