Council Meeting/Documents/Appendix A - TABLE 1: POPULATION, DWELLING UNIT AND EMPLOYMENT PROJECTIONS
Appendix
Appendix A - TABLE 1: POPULATION, DWELLING UNIT AND EMPLOYMENT PROJECTIONS
July 2, 2019Page 171 section
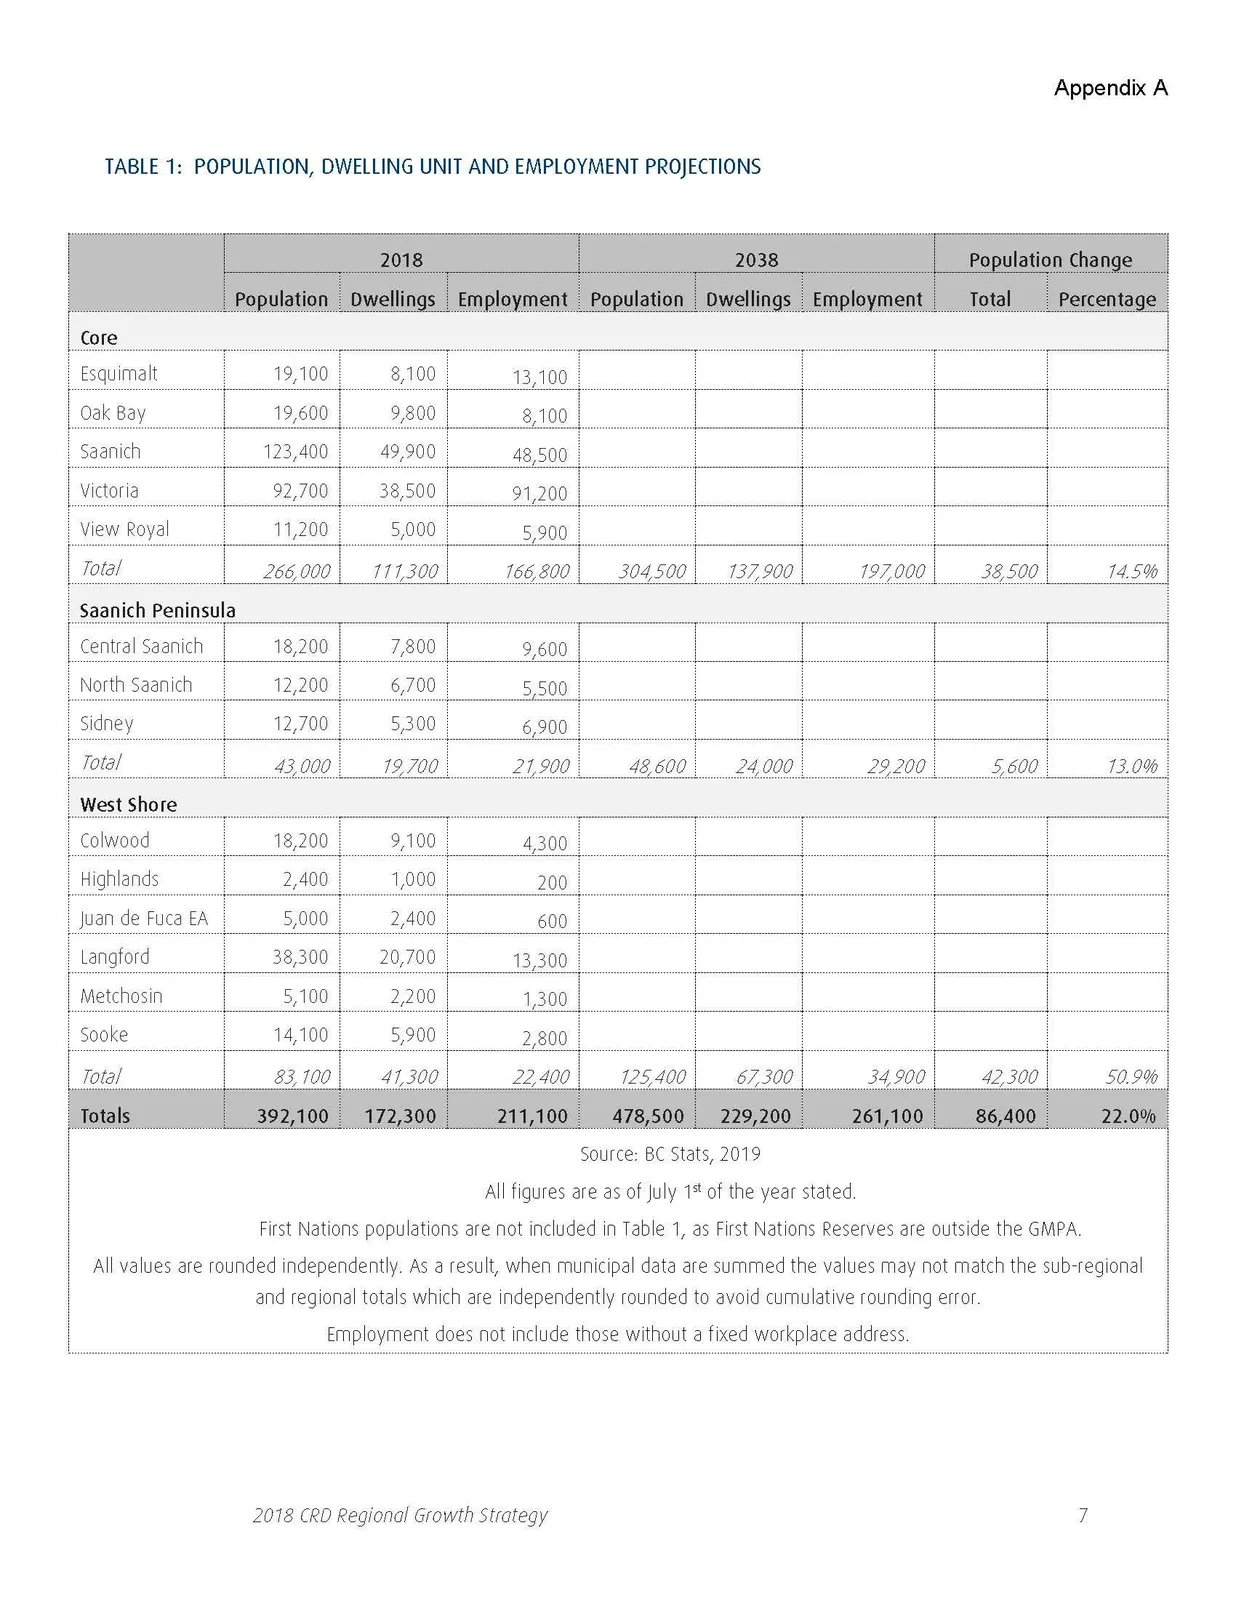
A statistical table detailing current (2018) and projected (2038) population and housing data for sub-regions including the West Shore and Core areas.
2018 Regional Population: 392,1002038 Regional Population Projection: 478,500Total Population Change: 86,400 (22.0%)
TABLE 1: POPULATION, DWELLING UNIT AND EMPLOYMENT PROJECTIONS
| 2018 | 2038 | Population Change | ||||||
|---|---|---|---|---|---|---|---|---|
| Population | Dwellings | Employment | Population | Dwellings | Employment | Total | Percentage | |
| Core | ||||||||
| Esquimalt | 19,100 | 8,100 | 13,100 | |||||
| Oak Bay | 19,600 | 9,800 | 8,100 | |||||
| Saanich | 123,400 | 49,900 | 48,500 | |||||
| Victoria | 92,700 | 38,500 | 91,200 | |||||
| View Royal | 11,200 | 5,000 | 5,900 | |||||
| Total | 266,000 | 111,300 | 166,800 | 304,500 | 137,900 | 197,000 | 38,500 | 14.5% |
| Saanich Peninsula | ||||||||
| Central Saanich | 18,200 | 7,800 | 9,600 | |||||
| North Saanich | 12,200 | 6,700 | 5,500 | |||||
| Sidney | 12,700 | 5,300 | 6,900 | |||||
| Total | 43,000 | 19,700 | 21,900 | 48,600 | 24,000 | 29,200 | 5,600 | 13.0% |
| West Shore | ||||||||
| Colwood | 18,200 | 9,100 | 4,300 | |||||
| Highlands | 2,400 | 1,000 | 200 | |||||
| Juan de Fuca EA | 5,000 | 2,400 | 600 | |||||
| Langford | 38,300 | 20,700 | 13,300 | |||||
| Metchosin | 5,100 | 2,200 | 1,300 | |||||
| Sooke | 14,100 | 5,900 | 2,800 | |||||
| Total | 83,100 | 41,300 | 22,400 | 125,400 | 67,300 | 34,900 | 42,300 | 50.9% |
| Totals | 392,100 | 172,300 | 211,100 | 478,500 | 229,200 | 261,100 | 86,400 | 22.0% |
Source: BC Stats, 2019 All figures are as of July 1st of the year stated. First Nations populations are not included in Table 1, as First Nations Reserves are outside the GMPA. All values are rounded independently. As a result, when municipal data are summed the values may not match the sub-regional and regional totals which are independently rounded to avoid cumulative rounding error. Employment does not include those without a fixed workplace address.
Page 17
Extracted from: 2019 07 02 Council Agenda - Agenda - Pdf