Island Highway Transit Priority Plan and Park & Ride Study Final Report
A comprehensive study by SNC-Lavalin for BC Transit analyzing transit priority improvements and park-and-ride demand along the Island Highway corridor.
Island Highway Transit Priority Plan and Park & Ride Study Final Report BC Transit July 2018
Table 5.1 Potential Construction Packages
| Southbound Improvements | Northbound Improvements | ||||
|---|---|---|---|---|---|
| Construction Package ID | Description | Comments | Construction Package ID | Description | Comments |
| S1 | SB queue jump bus lane from south of Craigflower Creek bridge to signals just south of ENR Overpass (see Sketch 001-A) | Shown as Option 1 on Sketch 001-A. Can be combined with Package S4 | N1 | NB queue jump bus lane from Colwood Crescent (Jerome Rd) to Goldstream Ave (see Sketch 005) | |
| S2 | SB queue jump bus lane from Trans Canada Hwy 1 Off Ramp to just north of Craigflower Creek Bridge (see Sketch 001-B) | Can be combined with Package S1 | N2 | NB bus lane north and south of Ocean Blvd (see Sketch 004) | |
| S3 | SB bus lane from Trans Canada Hwy 1 Off Ramp to signals just south of ENR Overpass (see Sketches 001-A and 002) | Shown as Option 2 on Sketches 001-A and 002. Can be combined with Package S4 | N3 | NB bus lane from Dukrill Rd to signals just south of ENR Overpass- see Sketches 003 and 001-A) | |
| S4 | SB bus lane from signals just south of ENR Overpass to 6-Mile Rd (see Sketches 001-A and 003) | Can be combined with Package S1 or S3 | |||
| S5 | SB bus lane north and south of Wale Rd (see Sketch 004) |
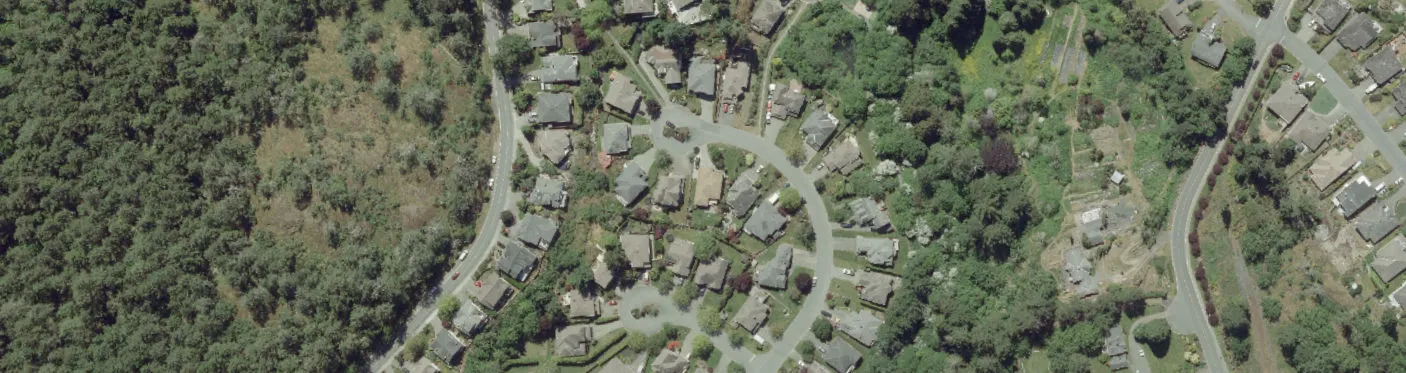
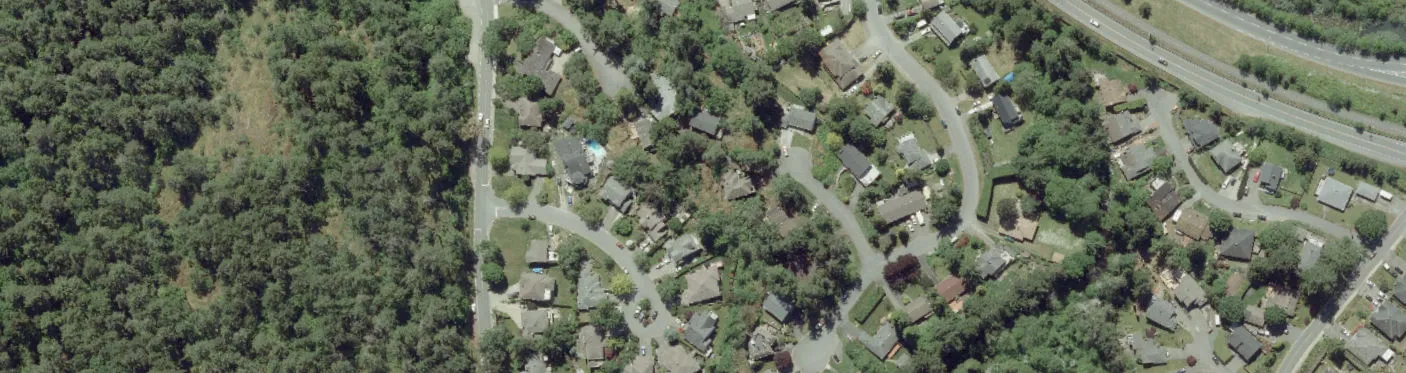
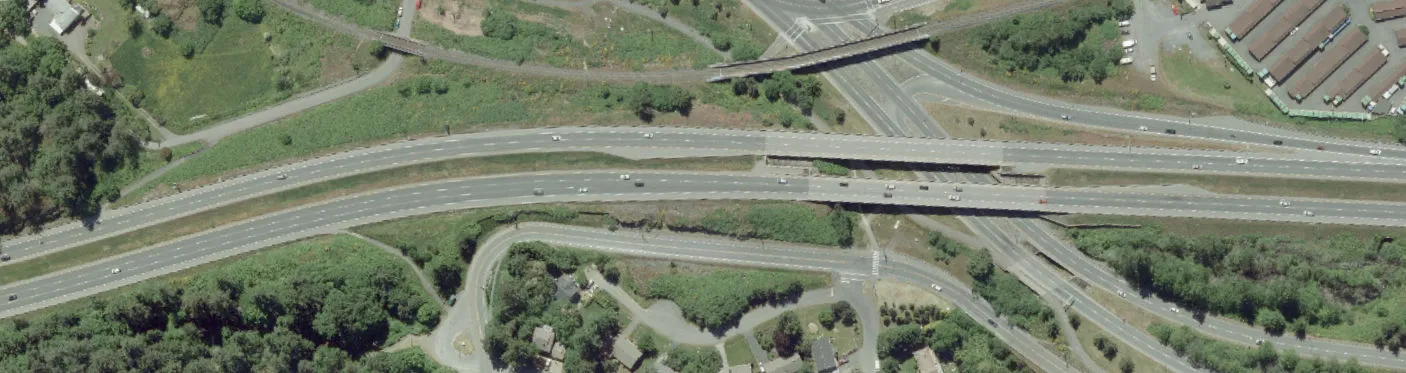
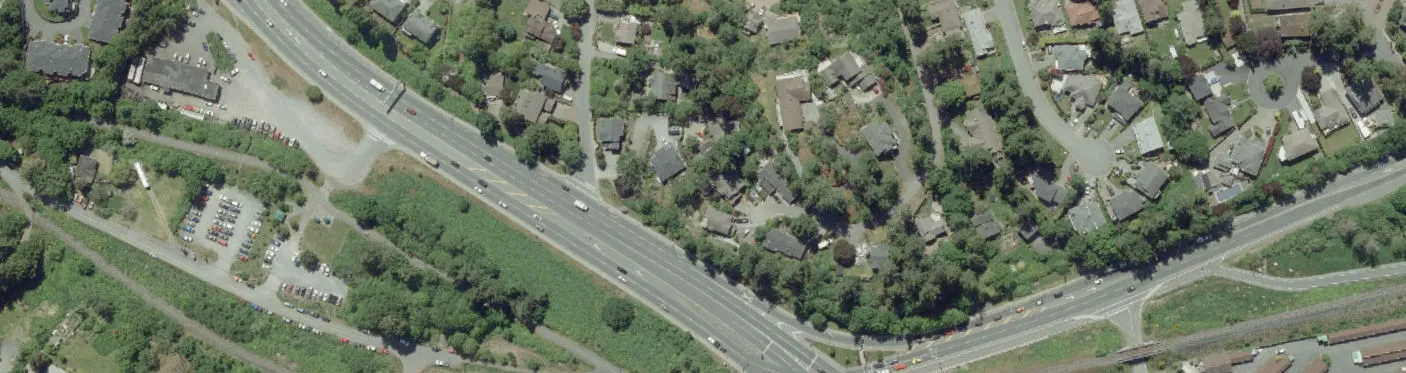
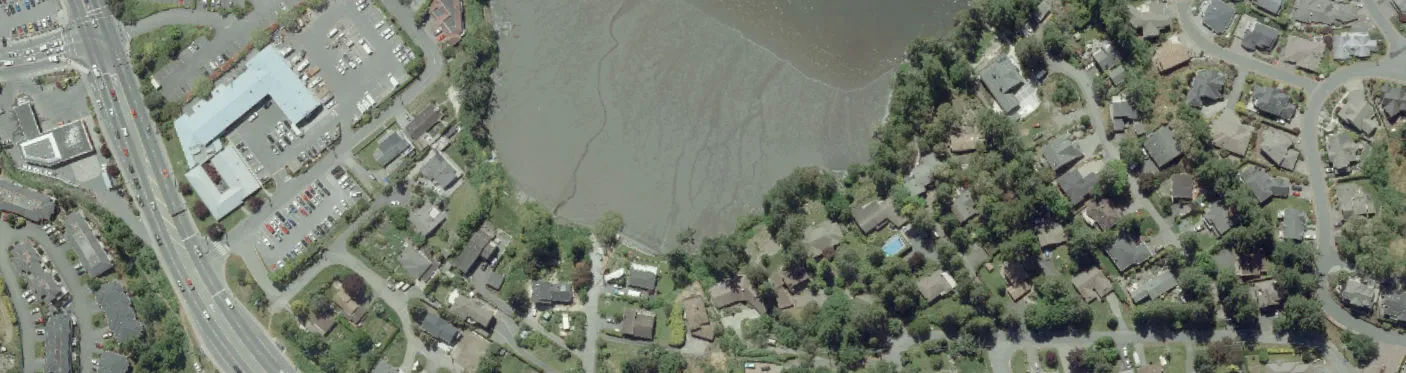
Proposed Transit Priority Measures Project Location: Colwood Interchange, Victoria, BC Client Name: BC Transit
Legend
- Signal priority for transit
- Intersection
Measures shown on map:
- S2 - Southbound queue jump lane from Highway 1 off ramp to Craigflower Bridge
- S1 - Southbound queue jump lane from Craigflower Bridge to Colwood Interchange
- N3 - Northbound bus lane from Dukrill Road to Colwood Interchange
- S3 - Southbound bus lane from Highway 1 off ramp to Colwood Interchange
- S4 - Southbound bus lane from Colwood Interchange to 6-Mile Road
- Location: Colwood Interchange (Hwy 1)
- Location: 6-Mile Rd

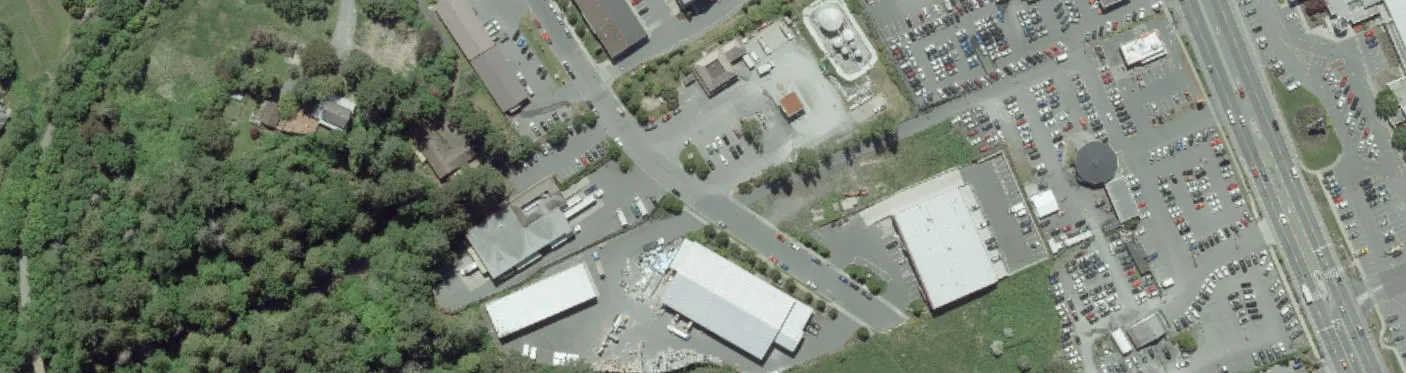
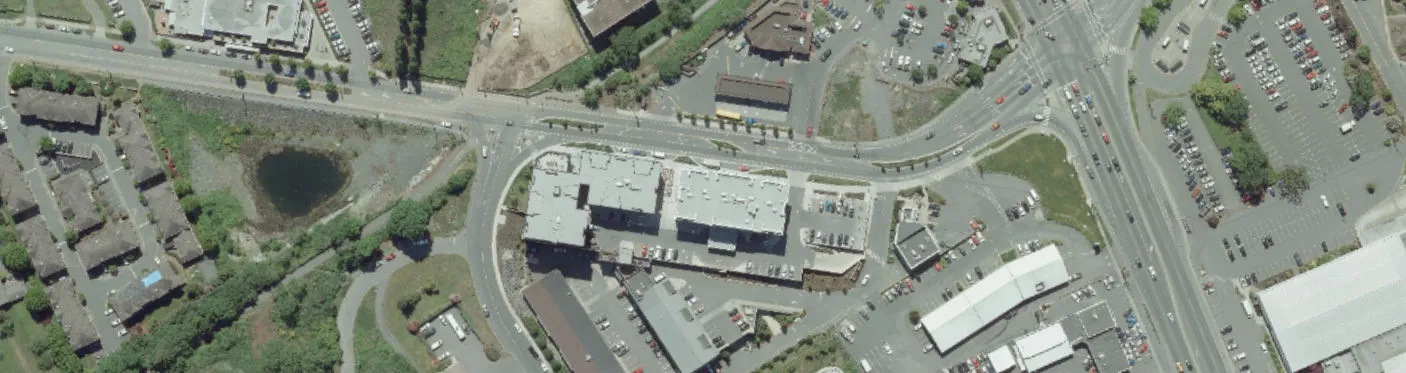
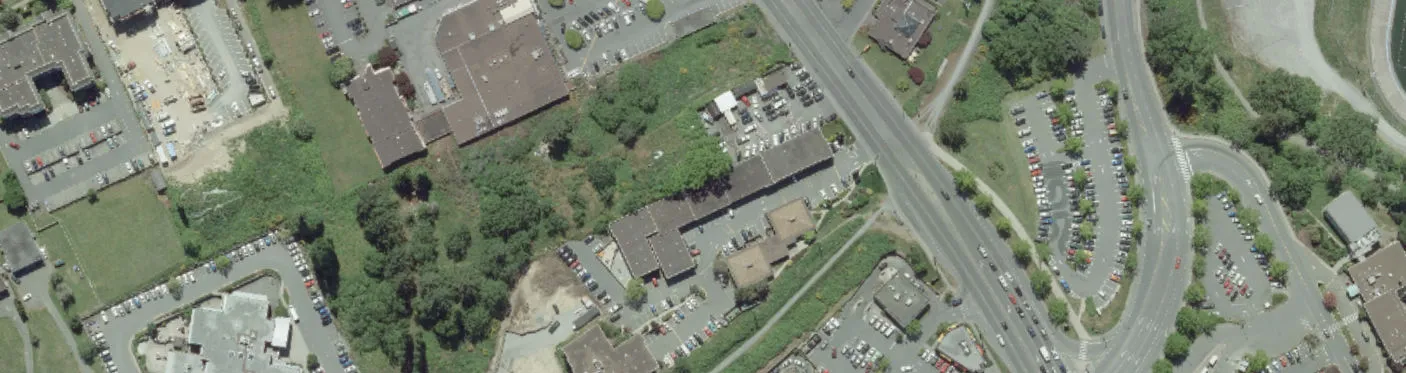
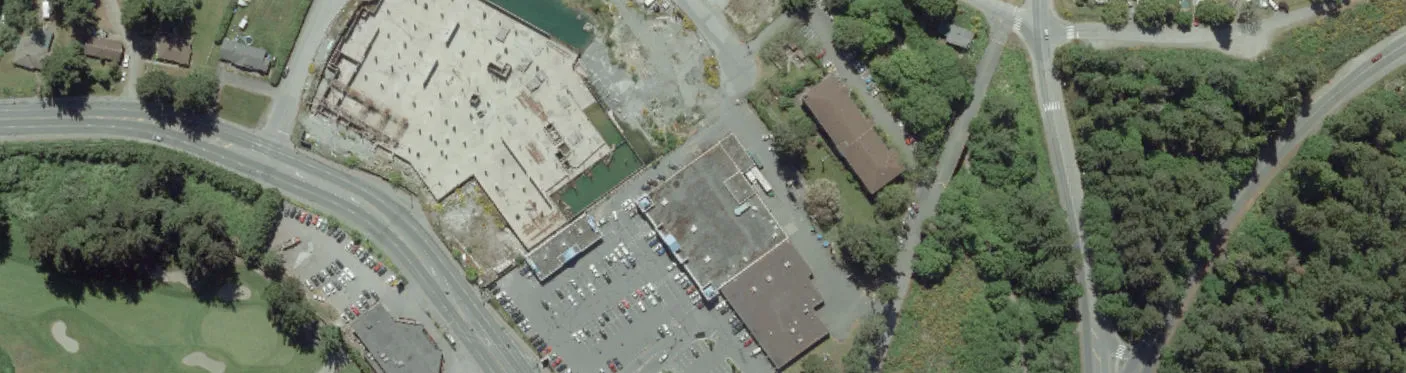
Proposed Transit Priority Measures Project Location: Colwood Interchange, Victoria, BC Client Name: BC Transit
Legend
- Signal priority for transit
- Intersection
Measures shown on map:
- N2 - Northbound bus lane North and South of Ocean Boulevard
- S5 - Southbound bus lane North and South of Wale Road
- N1 - Northbound queue jump lane
- Location: Goldstream Ave
- Location: Wale Rd/Ocean Blvd
5.2 Construction Cost Estimate
A conceptual level cost estimate for each of the potential construction packages was developed based on the concept design drawings. A detailed breakdown of the construction cost estimate build-up is provided in Appendix E. Table 5.2 summarizes the estimated construction cost for each of the potential construction packages.
Table 5.2 Construction Cost Estimate
Note: Southbound packages S1 and S2 are sub-component packages of construction package S3.
| Construction Package ID | Direct Costs: Rmovals & Utility Work | Direct Costs: Grading & Paving | Direct Costs: Bus Stop / Station | Direct Costs: Bridge Widening | Sub-Total Direct Costs | Indirect Costs: Mobilization | Indirect Costs: Traffic Management | Indirect Costs: Risk & Contingency | Construction Cost (excluding Risk & Contingency) | Total Including Risk & Contingency |
|---|---|---|---|---|---|---|---|---|---|---|
| Southbound Packages | ||||||||||
| S1 | $ 60,496 | $ 192,530 | $ 156,974 | $ - | $ 410,000 | $ 16,400 | $ 20,500 | $ 32,800 | $ 446,900 | $ 479,700 |
| S2 | $ 16,335 | $ 68,259 | $ - | $ - | $ 84,594 | $ 3,384 | $ 4,230 | $ 6,768 | $ 92,207 | $ 98,975 |
| S3 | $ 84,838 | $ 330,602 | $ 156,974 | $ 297,100 | $ 869,514 | $ 34,781 | $ 43,476 | $ 69,561 | $ 947,770 | $ 1,017,331 |
| S4 | $ 164,897 | $ 403,372 | $ 156,974 | $ - | $ 725,243 | $ 29,010 | $ 36,262 | $ 58,019 | $ 790,515 | $ 848,534 |
| S5 | $ 69,927 | $ 124,599 | $ 156,974 | $ - | $ 351,500 | $ 14,060 | $ 17,575 | $ 28,120 | $ 383,135 | $ 411,255 |
| Sub-Total Southbound Packages S3, S4, S5 | $ 319,662 | $ 858,573 | $ 470,922 | $ 297,100 | $ 1,946,257 | $ 77,850 | $ 97,313 | $ 155,701 | $ 2,121,420 | $ 2,277,121 |
| Northbound Packages | ||||||||||
| N1 | $ 59,020 | $ 172,036 | $ 136,738 | $ - | $ 367,794 | $ 14,712 | $ 18,390 | $ 29,424 | $ 400,895 | $ 430,319 |
| N2 | $ 27,093 | $ 110,086 | $ 156,974 | $ 294,153 | $ 11,766 | $ 14,708 | $ 23,532 | $ 320,627 | $ 344,159 | |
| N3 | $ 33,362 | $ 164,936 | $ 288,711 | $ 487,009 | $ 19,480 | $ 24,350 | $ 38,961 | $ 530,840 | $ 569,801 | |
| Sub-Total Northbound Packages N1, N2, N3 | $ 119,475 | $ 447,058 | $ 582,423 | $ - | $ 1,148,956 | $ 45,958 | $ 57,448 | $ 91,916 | $ 1,252,362 | $ 1,344,279 |
| Grand Total Packages S3, S4, S4, N1, N2, N3 | $ 439,137 | $ 1,305,631 | $ 1,053,345 | $ 297,100 | $ 3,095,213 | $ 123,809 | $ 154,761 | $ 247,617 | $ 3,373,782 | $ 3,621,399 |
5.3 Project Budget
The estimated total project budget for the proposed improvements is summarized on Table 5.3.
The total project budget was broken into the following groupings:
- Southbound Infrastructure improvements
- Northbound infrastructure improvements
- Corridor wide works
For southbound and northbound Infrastructure improvements the following elements are included:
- Estimated construction cost for the SB and NB infrastructure
- Estimated engineering fees for the infrastructure improvements
- An allowance for acquisition of property
- An allocation for construction contingency and risk
For Corridor wide works:
- Transit Signal controller upgrades for existing intersection signal controllers that require upgrading to enable compatibility with transit signal priority
- Supply, installation and testing of transit signal priority equipment for 4 intersections
- Supply, installation and testing of transit signal priority kits for 55 transit vehicles.
Transit signal priority equipment, for both the wayside and on-bus equipment, is based on employing the Opticom GPS based technology that has been used by BC Transit on previously completed TSP projects.
Based on the conceptual level of development of the project a project level contingency of 20% was carried.
Table 5.3 Estimated Project Budget
| Transit Priority Improvements | Cost Element | Estiamted Cost | Notes |
|---|---|---|---|
| Southbound Packages S3 + S4 + S5 | Construction Cost (excluding Risk & Contingency) | $ 2,121,420.13 | |
| Property | $ 346,000.00 | Allowance | |
| Engineering | $ 169,713.61 | ||
| Construction Risk & Contingency | $ 155,700.56 | ||
| Sub -Total Southbound Improvements | $ 2,792,834.30 | ||
| Northbound Packages N1 + N2 + N3 | Construction Cost (excluding Risk & Contingency) | $ 1,252,362 | |
| Property | $ 109,000 | Allowance | |
| Engineering | $ 100,189 | ||
| Construction Risk & Contingency | $ 91,916 | ||
| Sub -Total Northbound Improvements | $ 1,553,467 | ||
| Overall Corridor Packages (apply to Both Directions) | |||
| Traffic Signal Controller Upgrades | Upgrade signal controller for compatibility with TSP (supply, install, test & commission) | $ 22,000 | Upgrade intersection controllers at 4 intersections for compatibility with TSP. Existing cabinets reused. |
| Traffic Signal TSP Equipment | TSP Wayside controller and integrations with intersection signals (supply install, test & commission) | $ 90,036 | Upgrade 4 intersections with TSP |
| Bus TSP Equipment | TSP vehicle kit suplly install and commission | $ 323,989 | For 55 buses |
| Sub-Total Overall Corridor Improvements | $ 436,025 | Allocate to NB | |
| Capital Cost - Southbound Improvements | $ 2,792,834 | ||
| Project Contingency - 20% | $ 527,427 | ||
| Project Cost - Southbound | $ 3,320,261 | ||
| Capital Cost - Northbound Improvements | $ 1,989,493 | ||
| Project Contingency - 20% | $ 379,515 | ||
| Project Cost - Northbound | $ 2,369,008 |
6.0 Option Evaluation
A high level evaluation of the potential transit priority options was carried out. The evaluation looked at four accounts
- Transport
- Social / Property
- Environmental
- Economic
The transport account considered the impact and benefits of the proposed improvement options on the transportation system and includes the travel time savings for transit vehicles as well as other potential impacts to the transportation system such as impacts to general traffic, road works needed, and impacts to E&N Rail Trail users.
The Environment account considered impacts on potentially sensitive environmental areas along the corridor, impacts to landscaped areas as well as a qualitative assessment of the potential impact on GHG emissions form transit vehicles.
The Social / Property account looked at the potential impacts on property and changes required to public realm infrastructure (e.g. lighting / sidewalk relocations) that potentially impact the visual character of the area.
The economic account considers the financial aspects of the options and looks at the monetary costs and benefits of the potential options. The basis for the economic evaluation includes:
- The capital costs are conceptual level estimates as provided in section 5
- Costs and benefits are assessed over a 10 year time horizon from the completion of construction of the proposed improvements.
- The high level time line for the implementation of the proposed options is
- Planning, engineering, permitting, approvals – 2019
- Infrastructure construction – 2020
- Start of operations - 2021
- The savings in transit operational hours is based on $117 per operating hour for 2018. Costs are inflated over the time horizon at 3% p.a. based on historical trend.
- The savings in transit vehicle reductions is estimated based on monthly vehicle lease costs of $5528 (2018-19 figures for Heavy Duty vehicle). Costs are inflated over the time horizon at 3% p.a. based on historical trend.
- Travel time savings for transit customers are based on $18.49 per hour based on default values for benefit cost analysis in British Columbia (Apex Engineering, May 2017).
- A discount rate of 6% is used for the economic analysis.
Results of the option evaluation are presented on table 6.1
Note that no separate evaluation was completed for packages S1 and S2. As previously noted they are sub-components of package S3 and are accounted for in the evaluation of package S3. It should also be noted that the costs for corridor wide improvements (intersection controller upgrades and TSP upgrades) are carried under the northbound improvements.
Table 6.1 Evaluation of Options
| Package | Description | Evaluation Accounts: Transport | Evaluation Accounts: Social / Property | Evaluation Accounts: Environmental | Evaluation Accounts: Economic |
|---|---|---|---|---|---|
| S3, S4, S5 | * SB bus lane from Trans Canada Hwy 1 Off Ramp to signals just south of ENR Overpass * SB bus lane from signals just south of ENR Overpass to 6-Mile Rd * SB bus lane north and south of Wale Rd |
* PM peak period bus travel time reduced 1:30 * AM peak period bus travel time reduced 0:20 sec * Reduction in vehicle delays * Marginal increase in E&N Rail Trail crossing time * Pavement lifts at Craigflower Creek Bridge |
* Property required at Wale Rd. / Ocean Blvd. intersection (~60 sq. m): to accommodate bike lane and for widening sidewalk for bus stop platform * Utility, signal, lighting & sign relocations * Large dia. water mains may require protection |
* New Galloping Goose Trail Bridge over Craigflower Creek will require environmental review * Significant GHG reduction from buses |
Capital Cost (2018 $) $3,317,127 Project NPV: -$1,101,977 B/C ratio: 0.65 |
| N1, N2, N3 | * NB queue jump bus lane from Colwood Crescent (Jerome Rd) to Goldstream Ave * NB bus lane north and south of Ocean Blvd * NB bus lane from Dukrill Rd to signals just south of ENR Overpass |
* PM peak period bus travel time reduced 0:15 sec * AM peak period bus travel time reduced 3:10 * Reduction in vehicle delays |
* Property required at Goldstream Rd. intersection for bus station platform / (~121 sq. m) * New bus station platform/shelter encroaches (~1 m) into Juan de Fuca Park & Ride facility * Sidewalk relocation encroaches into Colwood Transit Exchange & Juan de Fuca Park & Ride |
* No impacts on environmental areas * Significant GHG reduction from buses |
Capital Cost (2018 $) $2,369,098 Project NPV: $541,487 B/C ratio: 1.24 |
Part 2 - Park & Ride Study
7.0 Existing Park & Ride Facilities
7.1 Existing Park & Ride Supply
The existing Park & Ride facilities in the Study Area covering View Royal, Colwood, Langford and Sooke are shown on table 7.1. The table includes non-official parking demand consisting of overflow within and next to the existing Park & Ride sites, non-Park & Ride parking that people are using for Park & Rde purposes, and the parking next to the ENR train tracks along Station Ave in Langford.
The initial inventory of existing Park & Ride facilities in the area was compiled through site visits and review of images via Google Earth. Features such items as the number of parking stalls, gravel or paved surface treatment, approximate weekday usage, accommodation of cyclists and disabled drivers, and apparent spill over to surrounding areas were noted. The facilities surveyed ranged from Sooke Park & Ride in the south west to the Hwy 1 / Helmcken Interchange Park & Ride in the northeast. A total of 374 formal Park & Ride stalls were identified in the sites surveyed. In addition to the formal, structured parking spaces, a number of “informal” or “unofficial” parking spaces adjacent to and surrounding the structured Park & Ride facilities were observed. Including those figures in the total yielded and estimated total supply of 618 spaces. Because of the oversubscription of parking there is an estimated shortfall of structured Park & Ride stalls of 244.
Table 7.1 Existing Park & Ride Locations
| City | Name or Location | Park & Ride Stalls provided | Non-Park & Ride Stalls being used |
|---|---|---|---|
| Colwood | South Side of Ocean Blvd (across from Colwood Exchange on land designated for Colwood City Centre) | 115 | ~22-overflow on Ocean Blvd grass shoulder |
| Colwood | Colwood Exchange | 41 | |
| Colwood | Juan de Fuca Rec Centre (next to Colwood Exchange) | 39 | |
| View Royal | Galloping Goose Gravel Parking near Colwood Interchange | ~50-vehicle occupants may be cycling or travelling by bus | |
| View Royal | Helmcken Interchange | 52 | |
| Langford | Veterans Memorial Parkway Interchange (VMP) | 28 | |
| Langford | Parking along Station Ave. next to ENR train tracks | ~158-vehicle occupants may be working in vicinity or travelling by bus via Langford Exchange | |
| Sooke | Sooke Park & Ride | 99 | |
| Sooke | Gravel parking next to bus stop across Hwy 14 from 17 Mile House Pub | ~14-vehicle occupants likely travelling by bus |
7.2 Park & Ride Demand Forecast Model
Forecasting of Park & Ride demand was completed using the model described by equation 1. Equation 1 was provided by BC Transit and was previously used for the planning of the McTavish Interchange Park & Ride facility.
Equation 1: $$ \text{Demand} = \left( \frac{\left( \left( \left( P_o \times T_g \right) \times E \right) \times O \right) \times P_{nr}}{V_{or}} \right) / L \div T_o $$
Where: (typical values shown in brackets):
- O = One Way Travel Factor (0.5)
- Po = Population Base
- Tg = Transit Generation Rate (0.3)
- Vor = Vehicle Occupancy Rate (1.1)
- E = Trips Proceeding Outside the Service Area (65%)
- L = Parking Lot Efficiency Factor (0.95)
- To = Turnover Rate in Parking Lot (1.2)
- Pnr = Park ‘n’ Ride Trips Generated (15-20%)
The Park & Ride demand model was calibrated using
- The number of existing formal Park & Ride stalls provided, plus
- The existing observed number of “non-official, permitted” parking stalls being used
For the purpose of calibration Colwood and Langford were combined to account for people living in Langford parking in Colwood because of the limited parking available in Langford. A weekday survey of Park & Ride usage undertaken on a weekday in October 2017 at the Park & Ride facility located on Ocean Blvd near the Colwood Transit Exchange indicated that in the AM 43.9%, and in the PM 45%, of the users originated from Westshore municipalities other than Colwood. The results of the model calibration are summarized on Table 7.2.
Table 7.2 – Park & Ride Forecast Model Calibration
| Parameter | Colwood/Langford | View Royal | Sooke | Notes |
|---|---|---|---|---|
| Tg | 0.38 | 0.38 | 0.36 | Calibrated based on current demand |
| Vor | 1.30 | 1.30 | 1.10 | Based on CRD Household Travel Survey |
| E | 0.35 | 0.40 | 0.35 | Assumed that 60% of trips are outside of the bus service area |
| L | 0.95 | 0.90 | 0.95 | Parking lot factor based on site visit observations |
| To | 1.20 | 1.20 | 1.20 | Standard value used |
| Pnr | 0.175 | 0.175 | 0.175 | This is the mid-point of the 2 standard values |
| O | 0.50 | 0.50 | 0.50 | Standard value used |
| Calculated Park & Ride Capacity Demand (Stalls) | 410 | 99 | 114 | |
| Current Capacity | 403 | 102 | 113 |
7.3 Park & Ride Demand Estimates
Future Population Projections
The future populations of the municipalities in the study area were estimated using census data from Stats Canada. The growth rates from 2011 to 2016 were applied to the 2016 populations to estimate the populations in 2038. The population projections are presented in the table 7.3.
Table 7.3 – Park & Ride Forecast Model Calibration
| 2011 | 2016 | Annual % Growth Rate | Projected population base in 2038 | |
|---|---|---|---|---|
| View Royal | 9,381 | 10,408 | 2.10% | 16,103 |
| Colwood | 16,093 | 16,859 | 2.60% | 28,902 |
| Langford | 29,228 | 35,342 | 0.94% | 43,015 |
| Sooke | 11,435 | 13,001 | 3.87% | 28,858 |
Projected Park & Ride Demand
The projected municipal populations in 2028 and 2038 were used in the calibrated demand forecast model (equation 1) to develop the projected park & ride demand for 2028 and 2038. Table 7.4 summarizes the results
Table 7.4 – Projected Park & Ride Demand
| Park & Ride Location | 2018: Capacity Provided | 2018: Demand | 2018: Additional Required | 2028: Capacity Provided | 2028: Demand | 2028: Additional Required | 2038: Capacity Provided | 2038: Demand | 2038: Additional Required |
|---|---|---|---|---|---|---|---|---|---|
| View Royal | 52 | 99 | 47 | 52 | 124 | 72 | 52 | 153 | 101 |
| Sooke | 99 | 114 | 15 | 99 | 174 | 75 | 99 | 268 | 169 |
| Langford + Colwood | 223 | 410 | 187 | 223 | 483 | 260 | 223 | 565 | 342 |
| Total | 374 | 623 | 249 | 374 | 781 | 407 | 374 | 985 | 611 |
| Langford | 28 | 278 | 250 | 28 | 308 | 280 | 28 | 338 | 310 |
| Colwood | 195 | 132 | -63 | 195 | 176 | -19 | 195 | 227 | 32 |
As noted above, the demand projections account for the existing oversubscription to capture the existing demand that cannot access the formal parking stalls provided. The capacity provided includes only the formal parking stalls provided in the existing Park & Ride lots. The calculated “additional required” shows the projected shortfall between the demand and the existing formal Park & Ride stalls provided as at 2018.
Based on the projections, there is an existing shortfall of 249 Park & Ride stalls as of 2018. On the basis of the projected population increases the shortfall increased to 611 stalls if no new Park & Ride stalls are provided.
7.4 Identification and Evaluation of Potential Park & Ride Location Options
Potential future Park & Ride sites were identified by the project team through the following means:
- Municipal partners on the Technical Advisory Group identified potential sites within their municipalities which they identified as suitable candidates for future use as Park & Ride facilities
- The project team scanned available properties for sale within +/- 500 m of the proposed frequent transit corridors identified in the Transit Future Plan (BC Transit, 2011)
Figure 7.1 (next page) presents the potential Park & Ride locations identified for consideration. Twelve (12) candidate sites were identified for evaluation. The sites were divided into two groups:
- Near Term Options – Sites that were located closer to the more developed areas of the Westshore municipalities, and
- Long Term Options – Sites that were located further from the more developed areas of the Westshore and along the proposed frequent transit corridors.
Figure 7.1 Potential Park & Ride Locations
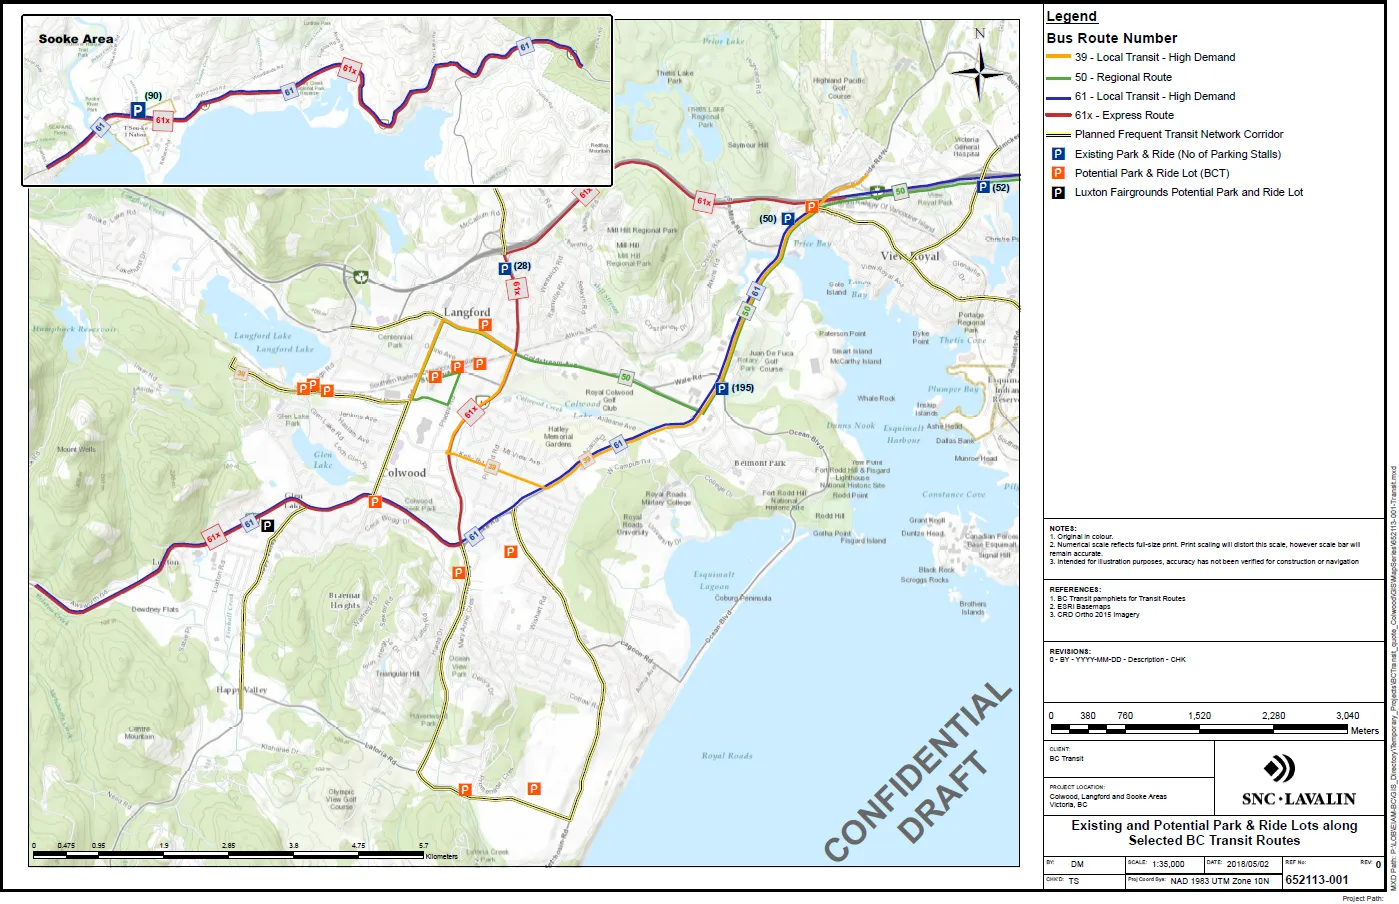
The near term options included:
- Langford Parkway
- Station Ave. near Veterans Memorial Parkway
- Station Ave. near Langford Transit Exchange
- Jacklin Rd. at Sooke Rd.
- Goldstream Ave. at Peatt Rd.
- Colwood Interchange
- NW ENR / Peatt Rd.
Long Term options included:
- Veteran’s Memorial Parkway and Sooke Rd.
- Latoria Rd and Wishart Rd.
- Latoria Rd. and Ryder Hesjedal Way
- Metchosin Rd. and Laren Rd.
- Luxton Fair Grounds
A qualitative evaluation was completed on the near term and long term options. The evaluation criteria used for the evaluation and their relative ranking are provided on table 7.5.
Table 7.5 – Criteria for Analysis of Potential Park & Ride Sites
| Criteria | Relative Weight |
|---|---|
| Park & Ride Capacity: * Preliminary estimate of the potential number of parking stalls that could be developed at the potential Park & Ride lot: |
4 |
| Connectivity to Bus Routes: * Number of bus routes served * Connectivity to Regional Bus Routes |
4 |
| Walking Distance to Bus Stops: * Distance from the Park & Ride lot to the bus stops (<200 m or >200 m & <400 m) * Ease of bus passenger access, including disabled persons: |
2 |
| Nature of Park & Ride Site: * Topographic, geotechnical and environmental constraints * Vehicular accessibility to/from major road system * Relative Cost of construction * Potential Impacts caused during construction |
3 |
| Impact on Neighbourhood Land Uses: * Potential benefits or impacts to adjacent land uses * Effects on mobility and safety of all modes of traffic local to the area |
2 |
| Regional Context: * Strategic relevance within the BC Transit Victoria Region Frequent Transit Network system |
4 |
Each of the options were rated qualitatively as More Favourable (●), Favourable (◕) or Less Favourable (○) in comparison with other options. The evaluation of each of the options is provided in Appendix F. Table 7.6 presents the overall results for the evaluation of the near term options. Table 7.7 presents the results for the long term options.
Table 7.6 Evaluation of Potential Near Term Park & Ride Locations
| Langford Pkwy | Station Ave. near Veterans Memorial Pkwy | Station Ave. near Langford Transit Exchange | Jacklin Rd at Sooke Rd | Goldstream Ave. at Peatt Rd | Colwood Interchange | NW ENR/ Peatt | |
|---|---|---|---|---|---|---|---|
| Park & Ride Capacity | ○ | ● | ○ | ◕ | ● | ● | ◕ |
| Number of Park & Ride Spots | 53 | 161 | 56 | 73 | 157 | 152 | 97 |
| Connectivity to Bus Routes | ◕ | ● | ● | ● | ● | ● | ● |
| Walking Distance to Bus Stops | ● | ● | ● | ● | ● | ◕ | ● |
| Nature of Park & Ride Site | ● | ● | ● | ○ | ● | ◕ | ◕ |
| Impact on Neighbourhood Land Uses | ○ | ● | ● | ● | ○ | ● | ● |
| Regional Context | ◕ | ● | ● | ● | ● | ● | ● |
| Overall Rating | 7th | 1st | 5th | 6th | 2nd | 3rd | 4th |
Table 7.7 Evaluation of Potential Long Term Park & Ride Locations
| Veteran’s Memorial Parkway and Sooke Rd. | Latoria Rd. and Wishart Rd. | Latoria Rd. and Ryder Hesjedal Way | Metchosin Rd. and Laren Rd. | Luxton Fairgrounds | |
|---|---|---|---|---|---|
| Park & Ride Capacity | ● | ● | ● | ● | ● |
| Number of Park & Ride Spots | 829 | 220 | 575 | 1458 | 545 |
| Connectivity to Bus Routes | ● | ○ | ○ | ● | ● |
| Walking Distance to Bus Stops | ◕ | ● | ● | ◕ | ● |
| Nature of Park & Ride Site | ○ | ○ | ◕ | ◕ | ● |
| Impact on Neighbourhood Land Uses | ● | ● | ◕ | ● | ● |
| Regional Context | ● | ◕ | ◕ | ● | ● |
| Overall Rating | 3rd | 5th | 4th | 2nd | 1st |
The results summarized in Tables 7.6 and 7.7 were reviewed with BC Transit and the Technical Advisory Group. Based on the feedback from BC Transit and the TAG as well as other factors including a preferred minimum Park & Ride capacity of 100 stalls, the preferred locations for Park & Ride facilities are:
- 6-Mile Rd. / Colwood Interchange – estimated capacity of 239 stalls
- Station Ave. near Veterans Memorial Parkway – estimated capacity of 145 stalls
- Modified Luxton option - 93
7.5 Conceptual Park & Ride Layout & Construction Cost
Conceptual geometric layouts were developed for the preferred Park & Ride locations. Drawings of the conceptual layouts are provided in Appendix G. Based on the conceptual layouts an order of magnitude budget was developed. Table 7.8 (next page) presents the order of magnitude budget for the preferred options. Property costs are not included in the construction cost estimate for the Park & Ride layouts. A detailed breakdown of the construction cost estimate is provided in Appendix H.
The design and cost estimate for Luxton Fairgrounds option has been developed based off of the concept design completed by the Ministry of Transportation and Infrastructure. BC Transit requested that SNCL identify potential options to stage development of the parking capacity and identify potential measure to reduce the estimated cost. The conceptual layout presented in Appendix G provides a reduced implementation of the MOTI concept that provides the required number of stalls to meet the forecast demand up to 2028. The conceptual cost estimate developed is for the revised Luxton concept.
Table 7.8 – Proposed Park & Ride Location Order of Magnitude Budget
| Proposed Park & Ride Location | Direct Costs: Rmovals & Utility Work | Direct Costs: Grading & Drainage | Direct Costs: Paving & Concrete Flatwork | Direct Costs: Traffic Signalling & Lighting | Sub-Total Direct Costs | Indirect Costs: Mobilization | Indirect Costs: Traffic Management | Indirect Costs: Risk & Contingency | Construction Cost (excluding Risk & Contingency) | Total Constuction Including Risk & Contingency | Engineering | Project Total |
|---|---|---|---|---|---|---|---|---|---|---|---|---|
| Luxton | $ 10,595 | $ 197,195 | $ 469,461 | $ 236,000 | $ 913,251 | $ 36,530 | $ 45,663 | $ 73,060 | $ 995,444 | $ 1,068,504 | $ 73,060 | $ 1,141,564 |
| Station Ave. | $ 29,210 | $ 139,640 | $ 637,572 | $ 56,000 | $ 862,422 | $ 34,497 | $ 43,121 | $ 68,994 | $ 940,040 | $ 1,009,034 | $ 68,994 | $ 1,078,028 |
| 6-Mile / Colwood Interchange | $ 46,705 | $ 467,940 | $ 1,035,606 | $ 296,000 | $ 1,846,251 | $ 73,850 | $ 92,313 | $ 147,700 | $ 2,012,414 | $ 2,160,114 | $ 147,700 | $ 2,307,814 |
| Totals | $ 86,510 | $ 804,775 | $ 2,142,639 | $ 588,000 | $ 3,621,924 | $ 144,877 | $ 181,096 | $ 289,754 | $ 3,947,897 | $ 4,237,651 | $ 289,754 | $ 4,527,405 |