Appendix C - Sanitary Calculations / Relevant Sewer Master Plan Information
Calculations and excerpts from the Sanitary Master Plan regarding sewage capacity for the proposed building.
Appendix C
- Sanitary Calculations
- Relevant Sewer Master Plan Information
Glentanna Developments - 298 Island Highway - Servicing Report
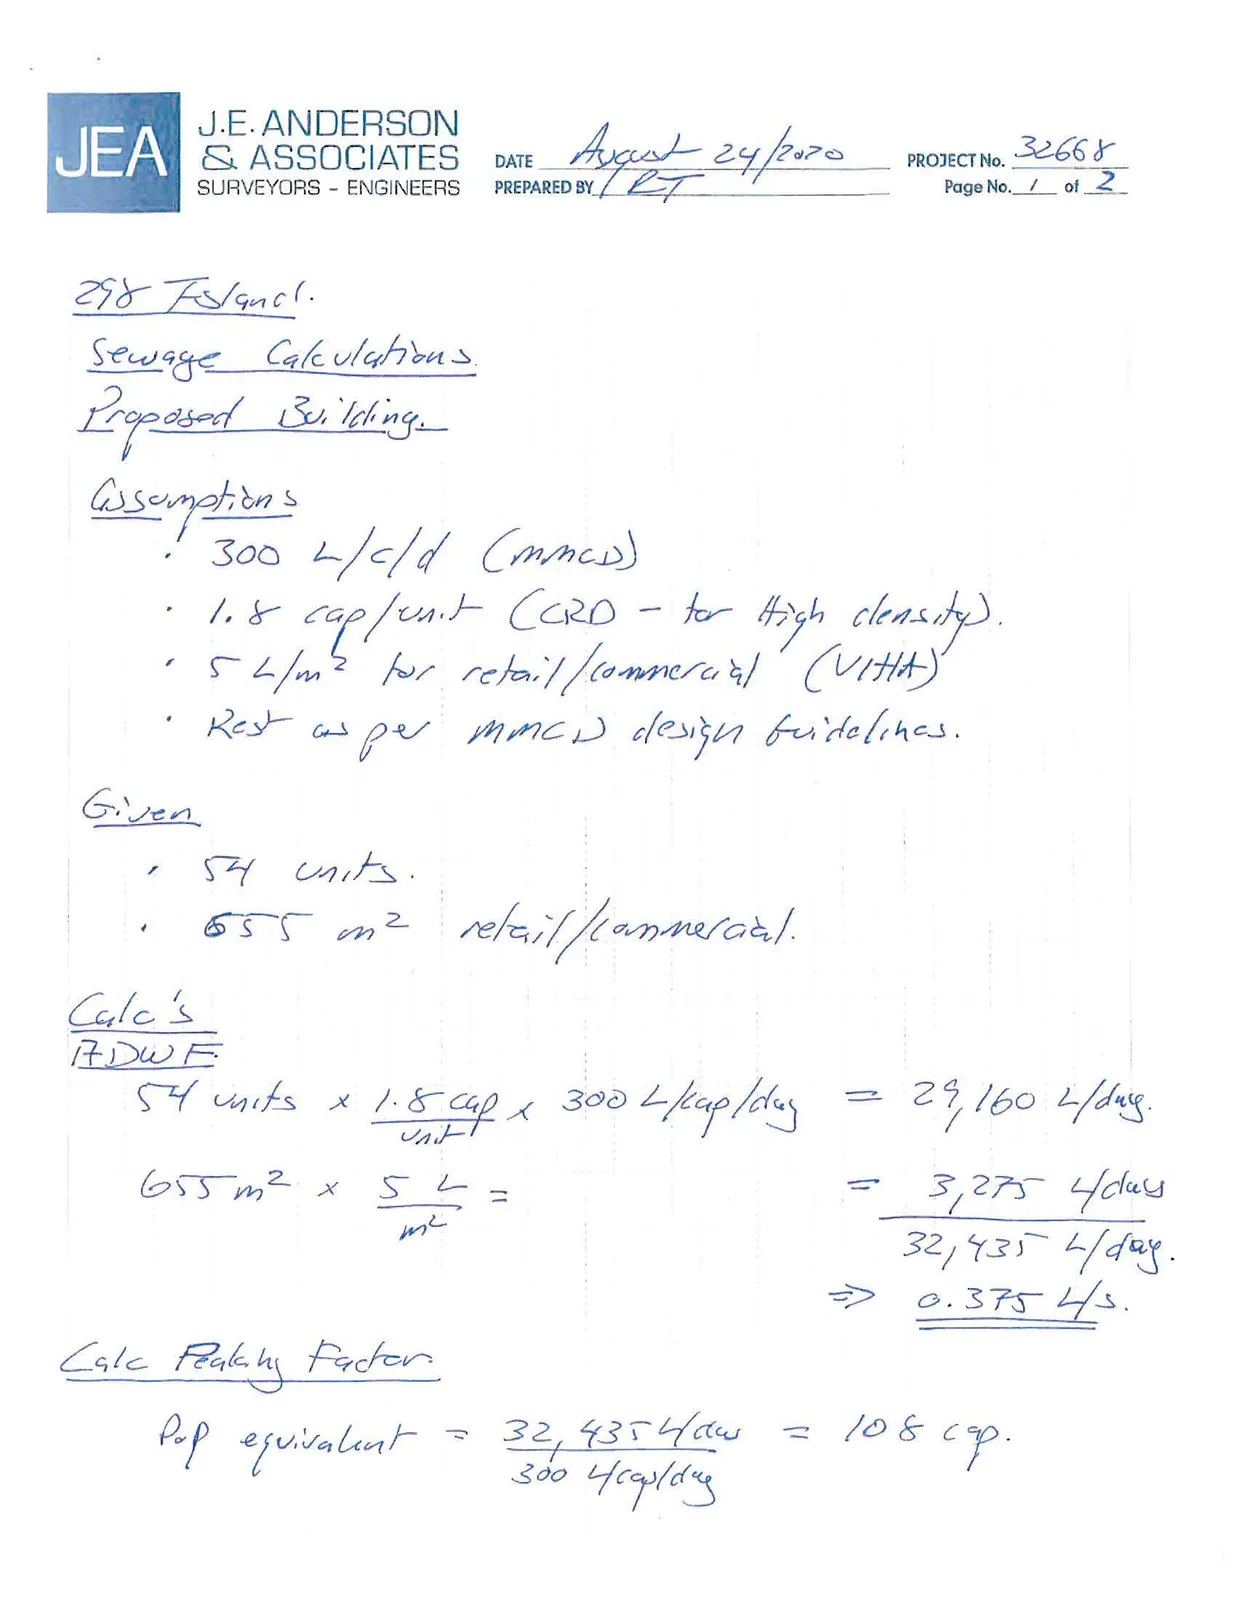
Sewage Calculations - Proposed Building
Project No. 32668 Date: August 24, 2020 Prepared by: RT
Assumptions
- 300 L/c/d (MMCD)
- 1.8 cap/unit (CRD - for High density)
- 5 L/m² for retail/commercial (VIHA)
- Rest as per MMCD design guidelines
Given
- 54 units
- 655 m² retail/commercial
Calc's ADWF
- 54 units x 1.8 cap/unit x 300 L/cap/day = 29,160 L/day
- 655 m² x 5 L/m² = 3,275 L/day
- Total = 32,435 L/day
- $\Rightarrow$ 0.375 L/s
Calc Peaking Factor
- Pop equivalent = 32,435 L/day / 300 L/cap/day = 108 cap
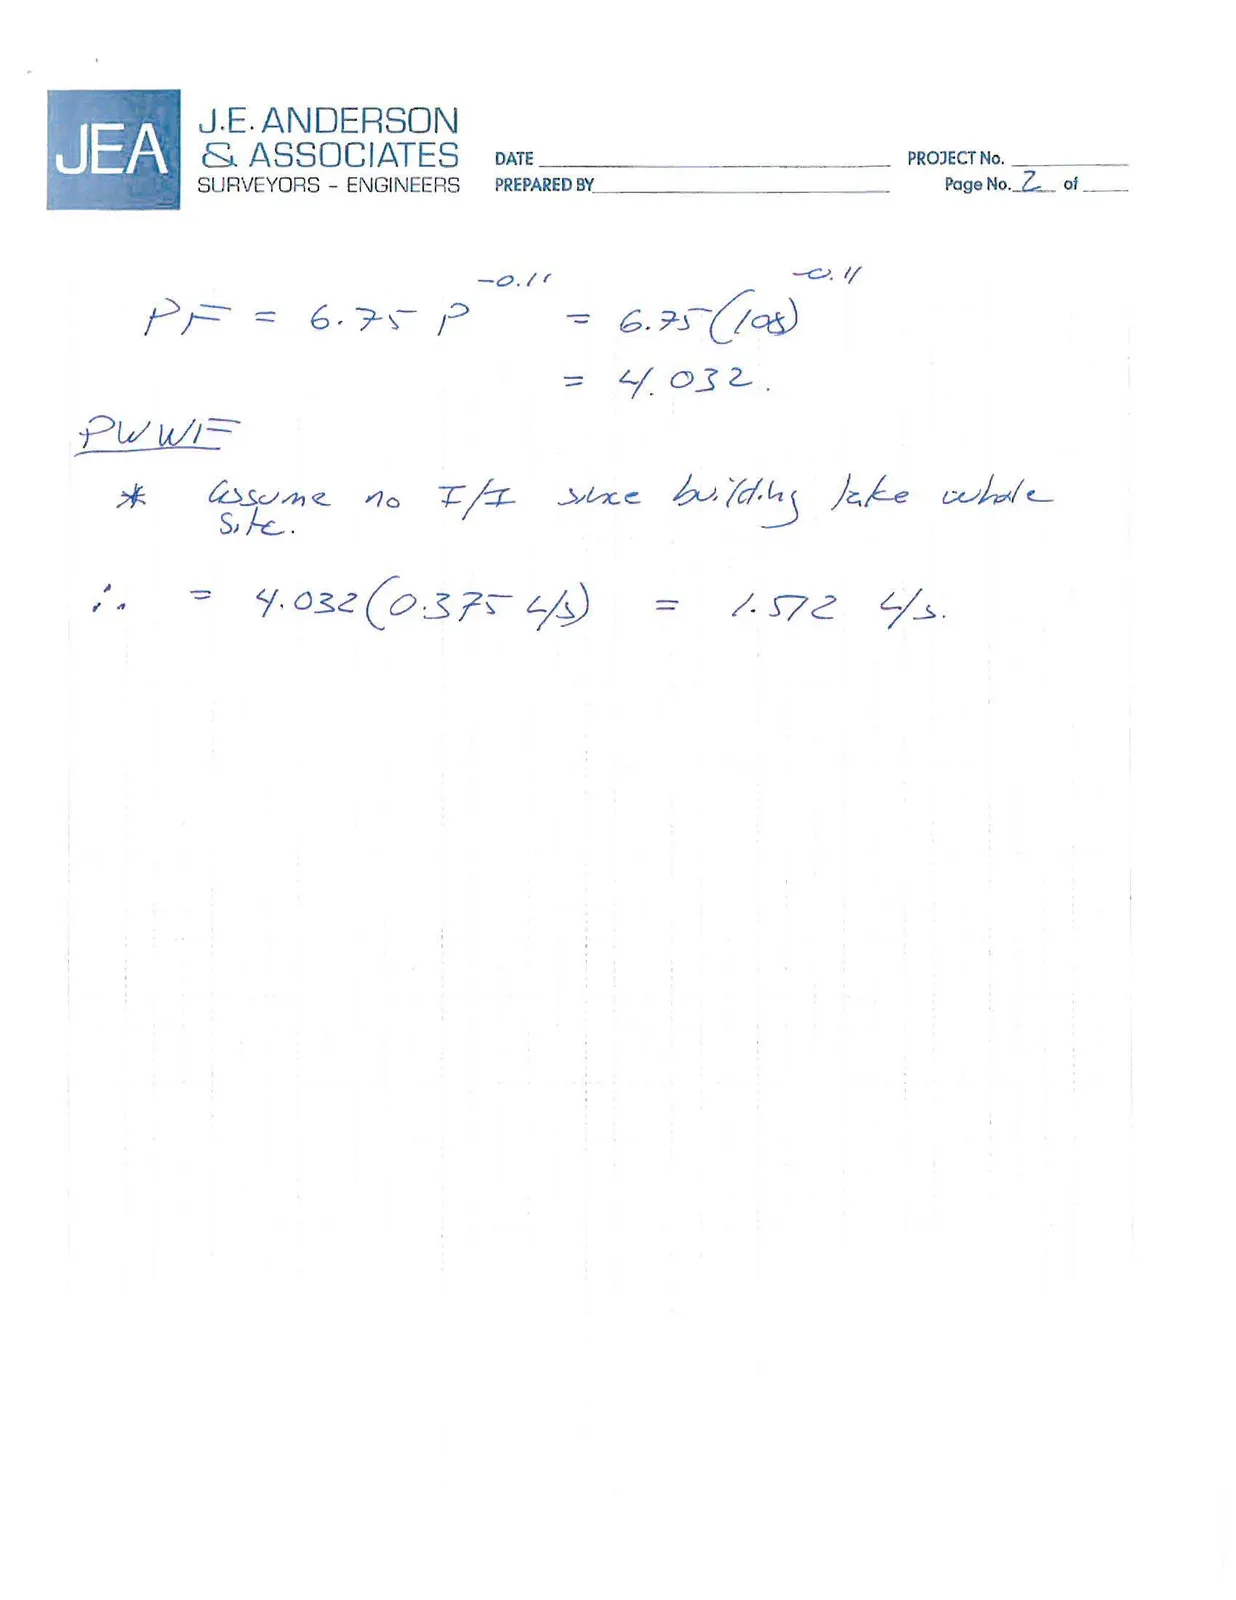
$PF = 6.75 \cdot P^{-0.11} = 6.75(108)^{-0.11} = 4.032$
PWWF
- Assume no I/I since building take whole site.
- $\therefore = 4.032(0.375\text{ L/s}) = 1.512\text{ L/s}$
Compare to Sewer Master Plan
Given
- Site area = 1,853 m²
- Section 4.3 indicates mixed use properties used a FSR of 1.2 - 1.5
- $\rightarrow$ assume 298 Island highway has FSR of 1.5 in sewer model
Assumptions
- Proposed sewage is proportional to FSR/gross area.
Calculations
- Proposed Gross area = 5,559 m²
- Master sewer plan = $1.5 \times 1,853 = 2,779.5\text{ m}^2$
- $\therefore \frac{5,559}{2,779.5} = 2$
Master Sewer Plan should have assumed approximately 1/2 the sewage flow based on floor area. $\therefore$ approximately 0.756 L/s more flow (1/2 PWWF)
DRAFT View Royal Sanitary Master Plan
Working Draft | 16 October 2017 Prepared for Town of View Royal
or Floor Space Ratios (FSR) for these areas. A range of FSRs were provided (e.g. 1.2 - 1.5) and the lowest value was used to estimate the size of the dwelling during the model build. These future land use areas were the first to receive population changes in the model; if the population did not reach 16,900 after these changes, the remaining difference was spread out evenly throughout the Town.
After receiving this information and inputting these changes into the model, the residential population summed to 20,488. This increased value (compared to the original estimate of 16,900) may be due to the future model using the existing population density values, as these values were calculated with the 2016 Census data and may not match with future conditions. This may lead to an overestimation, for example, if an existing neighbourhood that is predominantly single-family homes with a population density of 3-4 people/dwelling changes to a multi-family property in the future where the population density most likely reduces to 1-2 people/dwelling. Although the future PC-SWMM model accounts for the increased number of dwellings, the 2016 population density is still used, which may inflate the total number of people in this location for some of the catchment areas.
4.4. Existing Conditions
4.4.1. Existing System
Refer to Figures 1 and 2, showing the Town's existing sanitary infrastructure and the existing pump station catchment areas respectively.
4.4.2. Population
Existing cadastral shape files were received from the Town. Once imported into the model, each parcel was assigned a number of dwellings for single family homes and multi-family residences, while the ICI locations calculated equivalent populations based on the lot area or other factors as described in Section 2.2.1. The number of dwellings were then multiplied by the catchment-specific population density to yield the total population for that parcel.
Refer to Figure 3 for the Town's current land use map.
4.4.3. System Age
The Town's sanitary infrastructure ranges from 5 to 46 years old, with the majority of it having been installed between 1971 and 1981. Figure 4 provides further details on the age of the Town's sanitary sewers.
Sanitary Master Plan
Model Results with Upgrades - Future Population with 100 Figure 12 Project No. 2243-17101-00 Date: Oct 13, 2017
Legend
Force Main
- Velocity <= 3m/s
- Velocity > 3m/s
Junctions
- No Surcharge
- Surcharge Locations
Wet Well Depth
- <= 0.3m Above Lag Pump Start Depth
- > 0.3m Above Lag Pump Start Depth
Gravity Main - Max/Full Depth
- 0.0 - 0.5
- 0.5 - 0.7
- 0.7 - 1
- 1
Document Images
(1)