Schedule 3 - Proposed Sign Plan
Detailed specifications and location maps for proposed pylon, fascia, and monument signage at the casino.
MAP 2: SALISH SEA
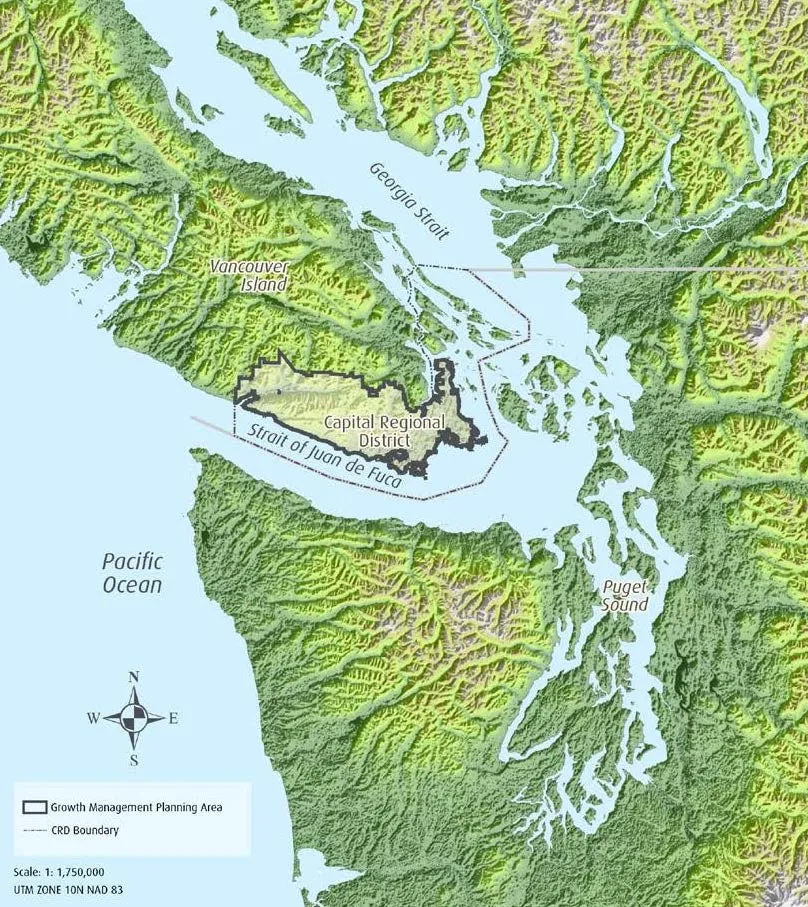
TABLE 1: POPULATION, DWELLING UNIT AND EMPLOYMENT PROJECTIONS
| 2011 | 2038 | Population Change | ||||||
|---|---|---|---|---|---|---|---|---|
| Population | Dwellings | Employment | Population | Dwellings | Employment | Total | Percentage | |
| Core | ||||||||
| Esquimalt | 16,600 | 8,300 | 11,100 | 18,300 | 9,500 | 12,200 | 1,700 | 10.2% |
| Oak Bay | 18,200 | 8,000 | 7,300 | 15,300 | 8,400 | 7,200 | -2,900 | -15.9% |
| Saanich | 112,100 | 46,600 | 42,300 | 128,600 | 56,300 | 55,500 | 16,500 | 14.7% |
| Victoria | 82,400 | 44,400 | 76,400 | 99,500 | 56,500 | 84,100 | 17,100 | 20.8% |
| View Royal | 9,600 | 4,100 | 4,800 | 15,000 | 6,700 | 5,900 | 5,400 | 56.3% |
| Total | 238,900 | 111,400 | 141,900 | 276,700 | 137,400 | 164,900 | 37,800 | 15.8% |
| Saanich Peninsula | ||||||||
| Central Saanich | 16,100 | 6,500 | 8,900 | 21,600 | 8,300 | 10,700 | 5,500 | 34.2% |
| North Saanich | 11,100 | 4,400 | 5,300 | 13,800 | 6,000 | 6,600 | 2,700 | 24.3% |
| Sidney | 11,200 | 5,200 | 6,100 | 11,900 | 6,600 | 7,600 | 700 | 6.3% |
| Total | 38,400 | 16,100 | 20,300 | 47,300 | 20,900 | 24,900 | 8,900 | 23.2% |
| West Shore | ||||||||
| Colwood | 16,600 | 6,100 | 4,000 | 31,100 | 12,200 | 6,800 | 14,500 | 87.3% |
| Highlands | 2,100 | 800 | 400 | 2,600 | 1,000 | 2,300 | 500 | 23.8% |
| Juan de Fuca EA | 4,400 | 1,900 | 800 | 6,200 | 2,700 | 1,100 | 1,800 | 40.9% |
| Langford | 29,900 | 11,600 | 12,200 | 48,000 | 19,200 | 22,700 | 18,100 | 60.5% |
| Metchosin | 4,900 | 1,800 | 1,400 | 5,200 | 2,200 | 6,500 | 300 | 6.1% |
| Sooke | 11,700 | 4,500 | 2,700 | 24,700 | 9,300 | 3,300 | 13,000 | 111.1% |
| Total | 69,600 | 26,700 | 21,500 | 117,800 | 46,600 | 42,700 | 48,200 | 69.3% |
| Totals | 346,900 | 154,200 | 183,700 | 441,800 | 204,900 | 232,500 | 94,900 | 27.4% |
Source: Urban Futures, 2014
Please note that First Nations populations are not included in Table 1, as First Nations Reserves are outside the GMPA.
Please note that projections were prepared using 2011 Census data. Implementation Measure I-6 identifies the need to update the projections using the most recent census data at the time of the first update to the 2018 Regional Growth Strategy.
From a 2011 base of approximately 346,900, the region’s population is forecast to increase by approximately 94,900 people to 441,800 in 2038, an approximate 1% average annual population increase. The slow aging of the region’s population continues as a significant trend, with the proportion of residents 65 years and older expected to rise from 18% in 2011 to 26% by 2038. Further, although the workforce (ages 15 to 64) is projected to grow by 31,900, the proportion of workforce to total population is projected to decline from 69% to 61% by 2038. Serving the needs of an aging population in the context of a proportionately smaller workforce will affect all aspects of the region’s social, economic and physical development.
It continues to be clear, however, that even modest population growth would undermine the regional vision if it were accommodated as it has been since the 1950s, through further urban expansion into farms, forests and countryside. Further, an expanded regional footprint would significantly contribute to increased greenhouse gas emissions. Achieving the regional vision requires a concerted effort to largely shift to policies that encourage investment and development in complete communities within the designated growth area. Paramount to success is coordinated and consistent decision-making that focuses on how people, land use, transportation, infrastructure and technology can mitigate and adapt to a changing climate.
The Regional Growth Strategy supports the regional vision by making this policy shift, through objectives that aim to: significantly reduce community-based greenhouse gas emissions; keep urban settlement compact; protect the integrity of rural communities; protect, conserve and manage ecosystem health; deliver services consistent with RGS objectives; build safe and complete communities; improve housing affordability; increase transportation choice; strengthen the regional economy; and, foster a resilient food and agriculture system. Realising these objectives is critically important for successfully reducing climate action.
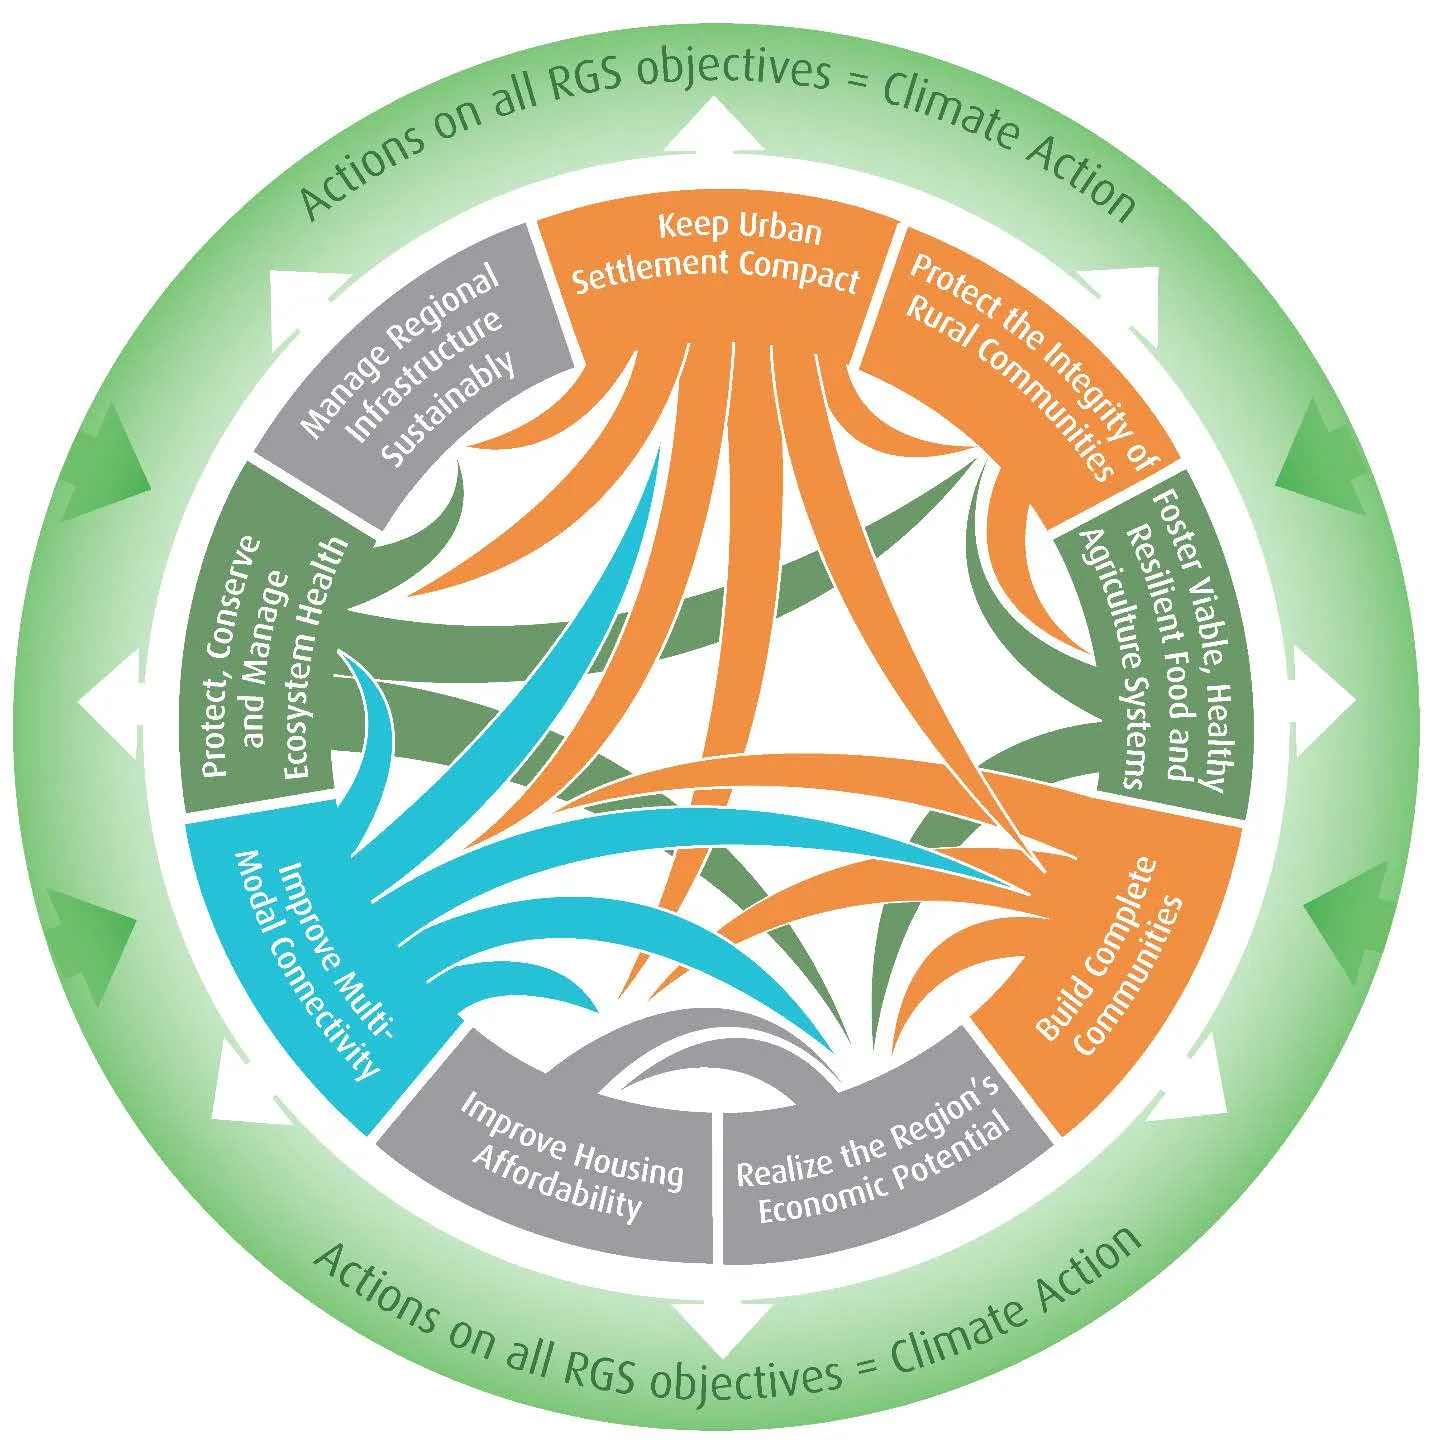
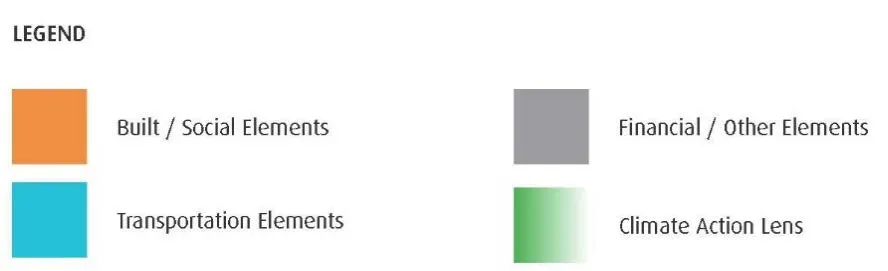
Figure 1 illustrates the interconnections among the Regional Growth Strategy objectives and between these objectives and climate change. The objectives are colour-coded to reflect how different elements of sustainability are represented in the Regional Growth Strategy and how together, these elements provide for a climate action lens. Keeping urban settlement compact and increasing transportation choice have a high degree of interdependence with other objectives. These strong links illustrate that achieving these two objectives will be particularly important for the realization of the regional vision. Further, the graphic illustrates that the Regional Growth Strategy objectives will support climate action and that taking action on climate change will, in turn, impact each objective.
FIGURE 1: REGIONAL GROWTH STRATEGY INTERCONNECTIONS
LEGEND
Objectives
The Regional Growth Strategy includes integrated objectives, incorporating policies, targets, maps and guidelines that together express a program of joint action by the Capital Regional District and local municipalities to achieve the regional vision.
- Objectives define a desired future on matters of regional interest.
- Policies are provided under the “policy” heading for each objective. The Capital Regional District will implement policies and undertake actions for regionally-delivered services and programs. Local municipalities will identify how their Official Community Plan aligns to each policy in a Regional Context Statement.
- Maps showing the Growth Management Concept Plan [Map 3(a)], the Urban Settlement Concept [Map 3(b)], and details of the Renewable Resource Lands (Map 4), and the Juan de Fuca Water Service Area (Map 5) provide spatial definition for policy.
- Targets for each objective are provided in Table 2 at the end of the document. Targets are aspirational in nature. It is unlikely that they will be achieved by the CRD and municipalities alone. Achieving the targets will require concerted effort on the part of the CRD and municipalities as well as senior governments, local residents and businesses, utilities, community groups and others.
- Targets are intended to be achieved at a regional level. Given the diversity of geographic and demographic conditions that exist among member municipalities, it is not intended that progress towards all targets would be equal in each municipality.
- Actions for the Capital Regional District to implement the Regional Growth Strategy are provided in the Implementation Measures section.
Subject to the Local Government Act and the articulation of policies in the Regional Growth Strategy document, the CRD and local municipalities recognize that the Regional Growth Strategy is intended as a planning policy document to serve as a guide for future decision making.
1. Managing and Balancing Growth
1.1 Keep Urban Settlement Compact
A designated Urban Containment Policy Area aims to keep urban areas compact and to keep growth largely contained within its boundaries. Fundamental to growth management are four related approaches that aim to increase the capacity of urban areas, particularly in the Core Municipalities and the urban West Shore, to accommodate new growth.¹
Approaches
I. Establish a strong mix of uses focused around Victoria’s downtown core area as the primary regional employment, business and cultural centre; II. Focus employment and population growth primarily in complete communities, located in areas that meet criteria described in Objective 3.1, that will encourage the development of walkable, bikeable and transit–focused areas with a dense mix of housing, employment, services and public open space; III. Increase the proportion of apartments, row houses and other attached housing types within the Urban Containment Policy Area, especially within complete communities; and, IV. Locate a minimum of 95% of the region’s new dwelling units to 2038 within the Urban Containment Policy Area.
The aim of keeping urban settlement compact is to concentrate growth within a firm Urban Containment Policy Area Boundary that will over time result in the creation of centres and connecting corridors that can be effectively served by express-bus transit. This lays the foundation to achieve a longer term objective of connecting the downtown Victoria–Douglas Street–Uptown corridor with Colwood and Langford by high–capacity public transit running in a dedicated right–of–way.
To support quality of life and community character in rural areas, urban containment directs growth into complete communities to reduce development pressures in the Saanich Peninsula, rural West Shore, Sooke and the Juan de Fuca Electoral Area. Growth outside the growth boundary is to be kept to 5% or less of the regional total.
A Growth Management Concept Plan and four land use policy designations will help keep urban settlement compact. Map 3(a) sets out the Growth Management Concept Plan, Map 3(b) provides detail on a settlement concept within the Urban Containment Policy Area and Map 4 provides additional detail for the Renewable Resource Lands Policy Area.
Land Use Designations
Capital Green Lands Policy Area: Includes Ecological Reserves, Capital Regional District Water lands, national parks and historic sites, provincial parks, regional parks, and lands used by municipalities and electoral areas as Parks. Local governments retain legislative authority related to parkland without requiring an amendment to the Regional Growth Strategy. The Regional Growth Strategy sets out in policy 2.1(1) the continued long–term use of these lands for these purposes.
Renewable Resource Lands Policy Area: Includes lands within the Agricultural Land Reserve (ALR), the Private Managed Forest Lands and Crown Forest Lands. The Regional Growth Strategy sets out in policy 5.1(4) the continued long–term use of these lands as renewable resource working landscapes.
Urban Containment Policy Area: Includes residential, general employment, commercial and industrial lands, as well as other associated land uses. The Urban Containment Policy Area is intended to accommodate 95% of the region’s new dwelling units. Within the Urban Containment Policy Area, planned growth and major new transportation infrastructure investments will be encouraged to align with the settlement concept shown on Map 3(b). Municipalities will determine the precise land use, intensification, density, servicing and connectivity requirements through local planning and regulatory processes. The settlement concept is comprised of three components:
- Node: Scale and intensity of development supports local-serving employment, commercial and community services and serves as a destination for residents proximate to the node. Surrounding areas feature residential uses of varying densities.
- Sub-Regional Node: Scale and intensity of development supports the area as a sub-regional employment, commercial and community destination and serves as a commuter destination from within the sub-region. Surrounding areas feature a mix of uses and higher density residential development.
- Metropolitan Core: Scale and intensity of development supports the area as a regional employment, business and cultural destination and serves as a significant commuter destination across modes from all parts of the region. Surrounding areas feature a dense mix of residential, employment and cultural uses.
¹ Table 1 provides projections, for information only, of population, dwelling units and employment in 2038 that could be expected under the Regional Growth Strategy.
The Regional Growth Strategy restricts extension of urban–standard sanitary sewerage services beyond the Urban Containment Policy Area Boundary as set out under policy 2.2(5).
Within the Urban Containment Policy Area, employment and population growth is to be accommodated in complete communities, as per the criteria set out in Objective 3.1. Complete communities are intended to accommodate housing, jobs and services at densities that will support transit. Accommodating growth in complete communities is central to reducing community-based greenhouse gas emissions, reducing development pressure on rural and resource lands and keeping infrastructure affordable.
Where Capital Green Lands and Renewable Resource Lands Policy Areas overlap with the Urban Containment Policy Area, the land use policy for the Capital Green Lands and Renewable Resource Lands Policy Areas shall take precedence. Liquid waste service may be provided to such lands within the Urban Containment Policy Area provided it is for a purpose consistent with the land use designations for the Capital Green Lands and Renewable Resource Lands Policy Areas.
Rural/Rural Residential Policy Area: Includes lands to be used for rural and rural residential purposes and the Victoria International Airport (with development potential as established through approved Memorandum of Understanding). The Regional Growth Strategy sets out in policy 1.1(1) and 1.2(1) that Rural/Rural Residential lands are not intended to become future urban areas requiring extensive services. Residential uses are of a form, density and character that support rural working landscapes. Commercial uses are local serving and such uses and other employment opportunities result in minimal impact to the surrounding community and to the environment. Low-impact tourism uses complement rural character. The policy area also includes lands with ecosystem benefits to be identified and protected through means such as development permit areas, conservation covenants, or acquisition and designation as a park or ecological reserve.
Municipal Boundary Adjustment Area: Includes approximately 380 acres of land, as shown in Map 3: Growth Management Concept Plan and Map 5: Municipal Boundary Adjustment - Detail, in the northwest portion of the District of Metchosin. The land within the Municipal Boundary Adjustment Area is designated as Rural/Rural Residential Policy Area, as per the land use designation set out in Objective 1.1. The Municipal Boundary Adjustment Area land is part of a municipal boundary adjustment proposal that, if approved, would result in the land being removed from the District of Metchosin and included within the City of Langford. In the event that the Province of British Columbia amends by Letters Patent the boundaries of the District of Metchosin and the City of Langford to include all or part of the Municipal Boundary Adjustment Area within the City of Langford, the land within the City of Langford will be designated Growth Policy Area, as per the land use designation set out in Objective 1.1, within the Growth Policy Area Boundary.