Staff Report
2025 BUILDING REPORT / 2025 HOUSING SUMMARY - JULY
September 9, 2025Pages 135–1362 sections
Statistical reports detailing building permit activity and housing unit completions for the month of July 2025.
July 2025Total permit value for July: $520,000.00195 multi-family units completed
2025 BUILDING REPORT
JULY
PART 9 PERMITS
| Permit Types | Constr. Value | Permit Fee | # of Permits |
|---|---|---|---|
| New Construction | |||
| Minor Projects - Residential | |||
| Minor Project - Commercial | |||
| Retaining Structures | |||
| Accessory Structures | $125,000.00 | $1,588.00 | 1 |
| Deck, Dock & Stairs | $45,000.00 | $737.50 | 2 |
| Woodburning Appliance | |||
| Pool | |||
| Building Move | |||
| Demolition | $300.00 | 3 | |
| Renewals | $100.00 | 1 | |
| Total | $170,000.00 | $2,725.50 | 6 |
PART 3 PERMITS
| Permit Types | Constr. Value | Permit Fee | # of Permits |
|---|---|---|---|
| New Construction | |||
| Minor Projects | $350,000.00 | $4,163.00 | 2 |
| Retaining Structures | |||
| Accessory Buildings | |||
| Deck, Dock & Stairs | |||
| Pool | |||
| Demolitons | |||
| Renewals | $2,000.00 | 4 | |
| Total | $350,000.00 | $6,163.00 | 2 |
Building Month Totals
| Constr. Value | Permit Fee | # of Permits | |
|---|---|---|---|
| Part 9 Permits | $170,000.00 | $2,725.50 | 6 |
| Part 3 Permits | $350,000.00 | $6,163.00 | 2 |
| Total | $520,000.00 | $8,888.50 | 8 |
Plumbing
| Permit Fee | # of Permits | |
|---|---|---|
| Part 9 Plumbing | $460.00 | 2 |
| Part 3 Plumbing | ||
| Renewals | ||
| Total | $460.00 | 2 |
Totals to Date
| Constr. Value | Permit Fee | # of Permits | |
|---|---|---|---|
| Part 9 | 1,533,395.00 | 18,540.30 | 29 |
| Part 3 | 658,885.35 | 9,973.69 | 7 |
| Plumbing | 3,065.00 | 15 | |
| Building & Plumbing | $2,192,280.35 | $31,578.99 | 51 |
Permit Type Comparison
Part 9 Permits Residential & Small Commercial
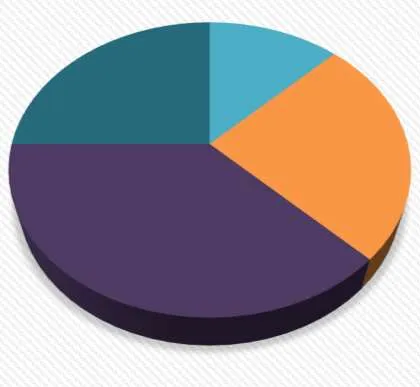
Part 3 Permits Apartment / Mixed Use & Large Commercial

Monthly Permit Revenue Comparison
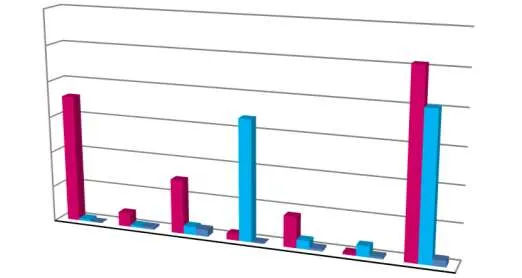
3yr Comparison of Issued Dwelling Units by Type
Annual Permit Revenue Comparison
Page 135–136
2025 HOUSING SUMMARY
JULY
Dwelling Units by Type
| Issued | Demolished | Completed | Net Units | |
|---|---|---|---|---|
| Single Family Dwelling | 1 | 5 | 0 | -5 |
| Secondary Suite | 0 | 0 | 0 | 0 |
| Garden Suite | 1 | 0 | 0 | 0 |
| Duplex | 0 | 0 | 0 | 0 |
| Houseplex (3-6 units) | 0 | 0 | 0 | 0 |
| Townhouses | 0 | 0 | 11 | 11 |
| Multi-family | 0 | 0 | 195 | 195 |
| Mixed Use | 0 | 0 | 55 | 55 |
| TOTALS | 2 | 5 | 261 | 256 |
Dwelling Units by Size
| Issued | Demolished | Completed | Net Units | |
|---|---|---|---|---|
| Studio | 0 | 0 | 8 | 8 |
| 1 Bedroom | 1 | 0 | 111 | 110 |
| 2 Bedroom | 0 | -4 | 111 | 107 |
| 3 Bedroom | 1 | -1 | 34 | 31 |
| 4+ Bedroom | 0 | 0 | 0 | 0 |
Dwelling Units By Tenure & Affordability
| TENURE | Issued | Demolished | Completed | Net Units |
|---|---|---|---|---|
| Rental Units | 1 | 0 | 195 | 195 |
| Owned Units | 1 | 5 | 66 | 61 |
| AFFORDABILITY | ||||
| Market | 2 | 5 | 261 | 256 |
| Below-Market | 0 | 0 | 0 | 0 |
| Below-Market w/ Onsite Support | 0 | 0 | 0 | 0 |
Completed Dwelling Units Comparison by Type
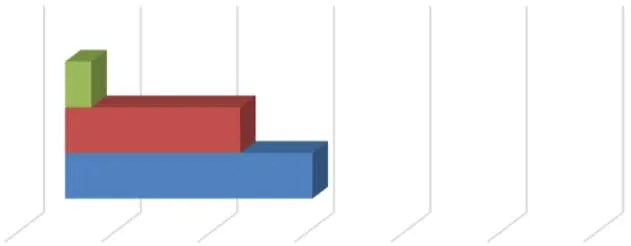
3yr Comparison of Net Units
Page 135–136
Extracted from: 2025 09 09 Committee of the Whole Agenda - Agenda - Pdf