Staff Report
2025 BUILDING REPORT / 2025 HOUSING SUMMARY - AUGUST
September 9, 2025Pages 137–1382 sections
Statistical reports detailing building permit activity and housing unit completions for the month of August 2025.
August 2025Total permit value for August: $720,000.00243 multi-family units completed
2025 BUILDING REPORT - AUGUST
PART 9 PERMITS
| Permit Types | Constr. Value | Permit Fee | # of Permits |
|---|---|---|---|
| New Construction | |||
| Minor Projects - Residential | $720,000.00 | $5,748.00 | 2 |
| Minor Project - Commercial | |||
| Retaining Structures | |||
| Accessory Structures | |||
| Deck, Dock & Stairs | |||
| Woodburning Appliance | |||
| Pool | |||
| Building Move | |||
| Demolition | |||
| Renewals | |||
| Total | $720,000.00 | $5,748.00 | 2 |
PART 3 PERMITS
| Permit Types | Constr. Value | Permit Fee | # of Permits |
|---|---|---|---|
| New Construction | |||
| Minor Projects | |||
| Retaining Structures | |||
| Accessory Buildings | |||
| Deck, Dock & Stairs | |||
| Pool | |||
| Demolitons | |||
| Renewals | |||
| Total | $0.00 | $0.00 | 0 |
Building Month Totals
| Constr. Value | Permit Fee | # of Permits | |
|---|---|---|---|
| Part 9 Permits | $720,000.00 | $5,748.00 | 2 |
| Part 3 Permits | $0.00 | $0.00 | 0 |
| Total | $720,000.00 | $5,748.00 | 2 |
Plumbing
| Permit Fee | # of Permits | |
|---|---|---|
| Part 9 Plumbing | $200.00 | 2 |
| Part 3 Plumbing | ||
| Renewals | ||
| Total | $200.00 | 2 |
Totals to Date
| Constr. Value | Permit Fee | # of Permits | |
|---|---|---|---|
| Part 9 | 2,253,395.00 | 24,288.30 | 31 |
| Part 3 | 658,885.35 | 9,973.69 | 7 |
| Plumbing | 3,265.00 | 17 | |
| Building & Plumbing | $2,912,280.35 | $37,526.99 | 55 |
Permit Type Comparison
Part 9 Permits: Residential & Small Commercial
Part 3 Permits: Apartment / Mixed Use & Large Commercial
(No data for August)
Monthly Permit Revenue Comparison
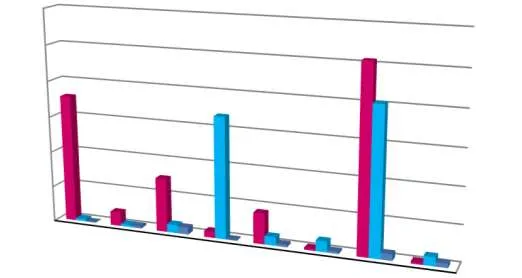
3yr Comparison of Issued Dwelling Units by Type
| Dwelling Type | 2023 | 2024 | 2025 |
|---|---|---|---|
| Single Family Dwelling | 3 | 2 | 1 |
| Secondary Suite | 5 | 3 | 0 |
| Garden Suite | 1 | 0 | 1 |
| Duplex | 0 | 0 | 0 |
| Houseplex | 0 | 0 | 0 |
| Townhouse | 13 | 0 | 0 |
| Multifamily | 440 | 161 | 0 |
| Mixed Use | 55 | 0 | 0 |
Annual Permit Revenue Comparison
(Horizontal bar chart showing annual permit revenue from 2016 through 2025, with 2024 showing significantly higher revenue than other years and 2025 showing year-to-date figures.)
Page 137–138
2025 HOUSING SUMMARY - AUGUST
Dwelling Units by Type
| Issued | Demolished | Completed | Net Units | |
|---|---|---|---|---|
| Single Family Dwelling | 1 | 5 | 0 | -5 |
| Secondary Suite | 0 | 0 | 0 | 0 |
| Garden Suite | 1 | 0 | 0 | 0 |
| Duplex | 0 | 0 | 0 | 0 |
| Houseplex (3-6 units) | 0 | 0 | 0 | 0 |
| Townhouses | 0 | 0 | 13 | 13 |
| Multi-family | 0 | 0 | 243 | 243 |
| Mixed Use | 0 | 0 | 55 | 55 |
| TOTALS | 2 | 5 | 311 | 306 |
Dwelling Units by Size
| Issued | Demolished | Completed | Net Units | |
|---|---|---|---|---|
| Studio | 0 | 0 | 8 | 8 |
| 1 Bedroom | 1 | 0 | 111 | 135 |
| 2 Bedroom | 0 | -4 | 111 | 130 |
| 3 Bedroom | 1 | -1 | 36 | 33 |
| 4+ Bedroom | 0 | 0 | 0 | 0 |
Dwelling Units By Tenure & Affordability
| TENURE | Issued | Demolished | Completed | Net Units |
|---|---|---|---|---|
| Rental Units | 1 | 0 | 195 | 195 |
| Owned Units | 1 | 5 | 116 | 111 |
| AFFORDABILITY | Issued | Demolished | Completed | Net Units |
|---|---|---|---|---|
| Market | 2 | 5 | 311 | 306 |
| Below-Market | 0 | 0 | 0 | 0 |
| Below-Market w/ Onsite Support | 0 | 0 | 0 | 0 |
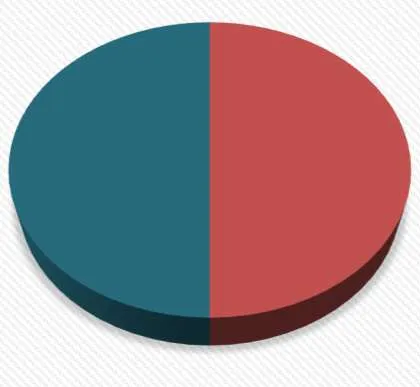
Completed Dwelling Units Comparison by Type
(Pie chart displaying the distribution of completed dwelling units by type, dominated by multi-family and rental units.)
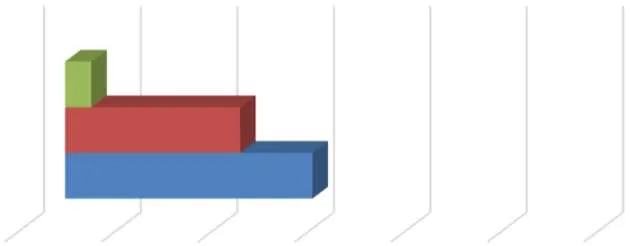
3yr Comparison of Net Units
Page 137–138
Extracted from: 2025 09 09 Committee of the Whole Agenda - Agenda - Pdf