Presentation
Presentation: 2025-2029 Financial Plan - Town of View Royal
January 14, 2025Pages 46–5813 sections
A slide deck presentation summarizing the financial projections, budget considerations, and requisition impacts for the 2025-2029 period.
Non-discretionary expense increase: $325,376Discretionary expense increase: $561,941Overall total expense increase: $1,040,696Presentation Date: January 14, 2025
2025 – 2029 FINANCIAL PLAN
Town of View Royal January 14, 2025
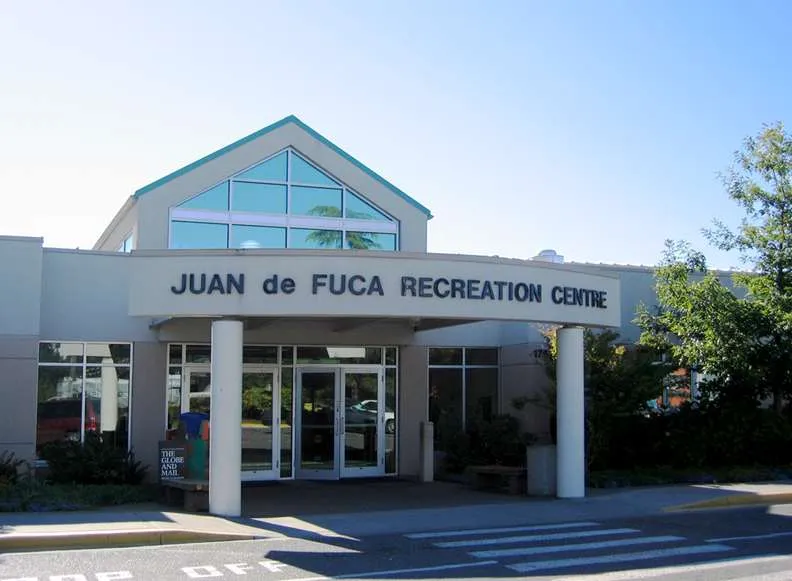
Page 46–58
Today’s presentation includes:
- 2024 financial projections and major variances
- 2025 budget considerations
- 2025 major expense increases
- 5-Year financial plan 2025-2029
- Summary of the 2025 capital projects
- 5-Year Capital Plan
- 5-Year Reserve Continuity
- Requisition impact to each municipality
Page 46–58
2024 Projection
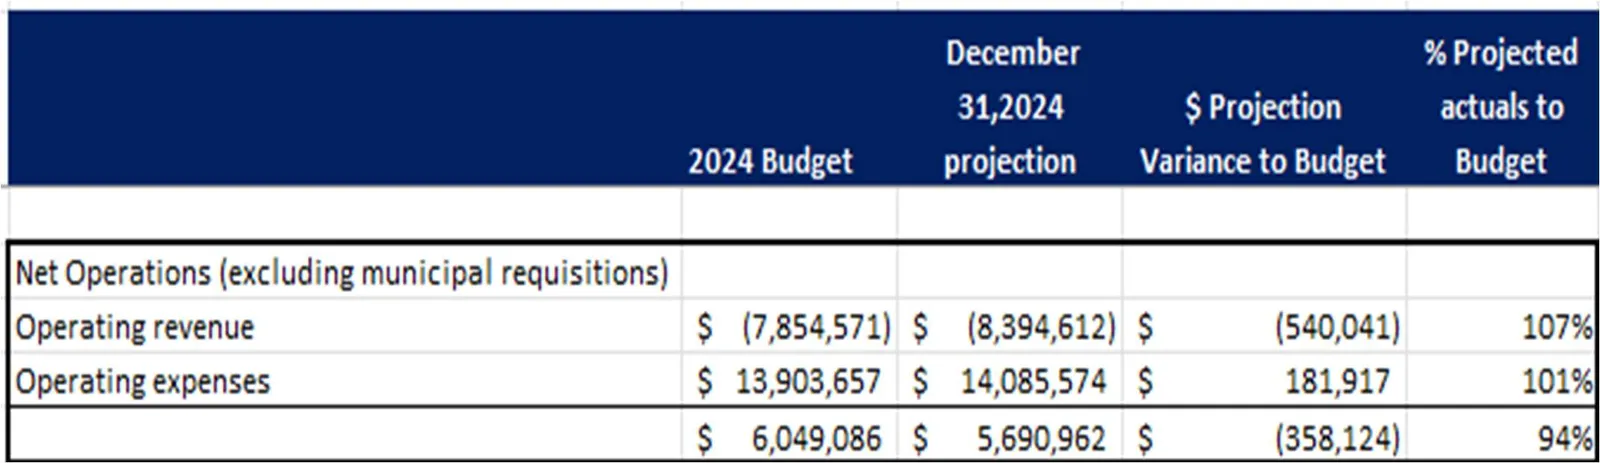
| Net Operations (excluding municipal requisitions) | 2024 Budget | December 31, 2024 projection | $ Projection Variance to Budget | % Projected actuals to Budget |
|---|---|---|---|---|
| Operating revenue | $ (7,854,571) | $ (8,394,612) | $ (540,041) | 107% |
| Operating expenses | $ 13,903,657 | $ 14,085,574 | $ 181,917 | 101% |
| Total | $ 6,049,086 | $ 5,690,962 | $ (358,124) | 94% |
Page 46–58
2024 Projection Major Variances
Revenues
| Revenues | Amount ($) | Comments |
|---|---|---|
| Finance | 257,578 | Higher interest income |
| Arena Programs | 76,916 | Youth hockey academies – daytime ice use |
| Indoor Sports Complex | 31,317 | Rentals |
| Fitness | 91,403 | Programs & weightroom admissions |
| Golf | 74,126 | Rounds played |
Expenses
| Expenses | Amount ($) | Comments |
|---|---|---|
| Wages | 52,296 | Support increased programming and facility use |
| Payment Processing | 18,260 | Increased sales |
| Insurance | 11,435 | |
| Supplies | 36,543 | Support increased programming and facility use |
| Service Contracts | 63,287 | Support increased programming and facility use, as well as contracted instruction (revenue sharing) |
Page 46–58
2025 Budget Considerations
- Collectively bargained 3% wage increase. A 1% wage increase has a value of $89,634 or a 1.40% requisition increase.
- 10% Insurance premium increase, market rate continues to increase for large insured properties.
- 5 – 10% Utility rate increases.
- Increased workload on staff to manage growing service delivery expectations and facility visits.
- Continuing annual increases to capital asset reserve contributions.
Page 46–58
2025 Major Expense Increases
- Non-discretionary - $325,376
- 3% wage increase
- Insurance premium increases
- Discretionary – $561,941
- Increased transfers to capital reserves
- 3 new regular positions:
- programmer in aquatics, parks maintenance worker & administration systems assistant
- Auxiliary roles converted to 2 regular positions:
- Program assistant in arenas & events and a facility maintenance worker at the Q Centre arena
- Overall, the total expense increase is $1,040,696 excluding the master plan project. We increased our fees, program offerings and performance expectations by $804,781.
- A requisition increase of $235,915 or 3.9% to compensate the difference. The 2024 increase was 4% or $232,657.
Page 46–58
5-Year Financial Plan 2025-2029
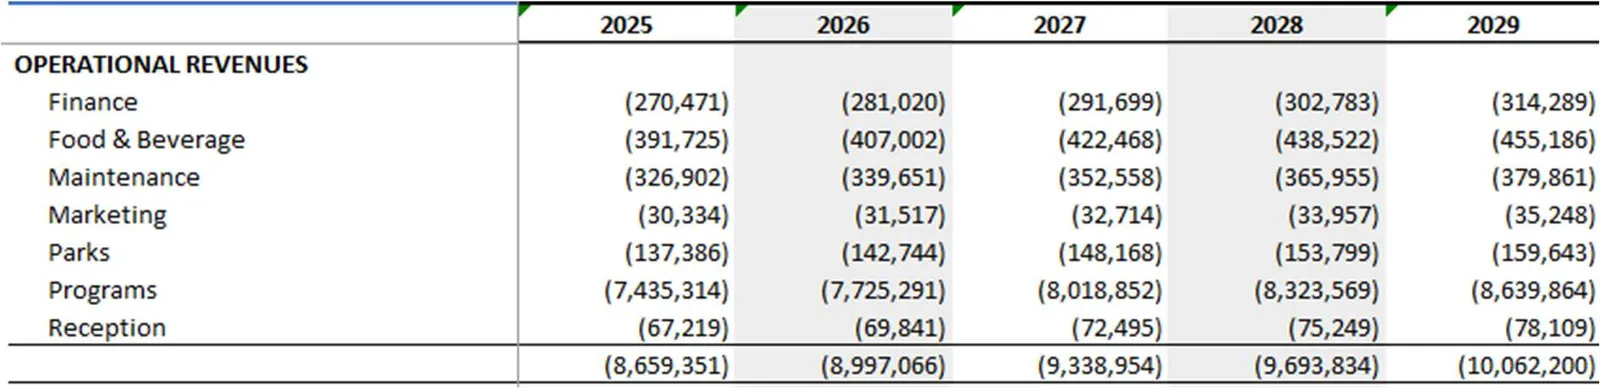
| OPERATIONAL REVENUES | 2025 | 2026 | 2027 | 2028 | 2029 |
|---|---|---|---|---|---|
| Finance | (270,471) | (281,020) | (291,699) | (302,783) | (314,289) |
| Food & Beverage | (391,725) | (407,002) | (422,468) | (438,522) | (455,186) |
| Maintenance | (326,902) | (339,651) | (352,558) | (365,955) | (379,861) |
| Marketing | (30,334) | (31,517) | (32,714) | (33,957) | (35,248) |
| Parks | (137,386) | (142,744) | (148,168) | (153,799) | (159,643) |
| Programs | (7,435,314) | (7,725,291) | (8,018,852) | (8,323,569) | (8,639,864) |
| Reception | (67,219) | (69,841) | (72,495) | (75,249) | (78,109) |
| Total | (8,659,351) | (8,997,066) | (9,338,954) | (9,693,834) | (10,062,200) |
- 2025 revenue budget is $804,781 or 10.2% higher than 2024’s $7,854,572.
- Includes an average fee increase of 4% on programs, rentals and admissions
- 3.8% increase year over year in future years
Page 46–58
5-Year Financial Plan 2025-2029 (Continued)
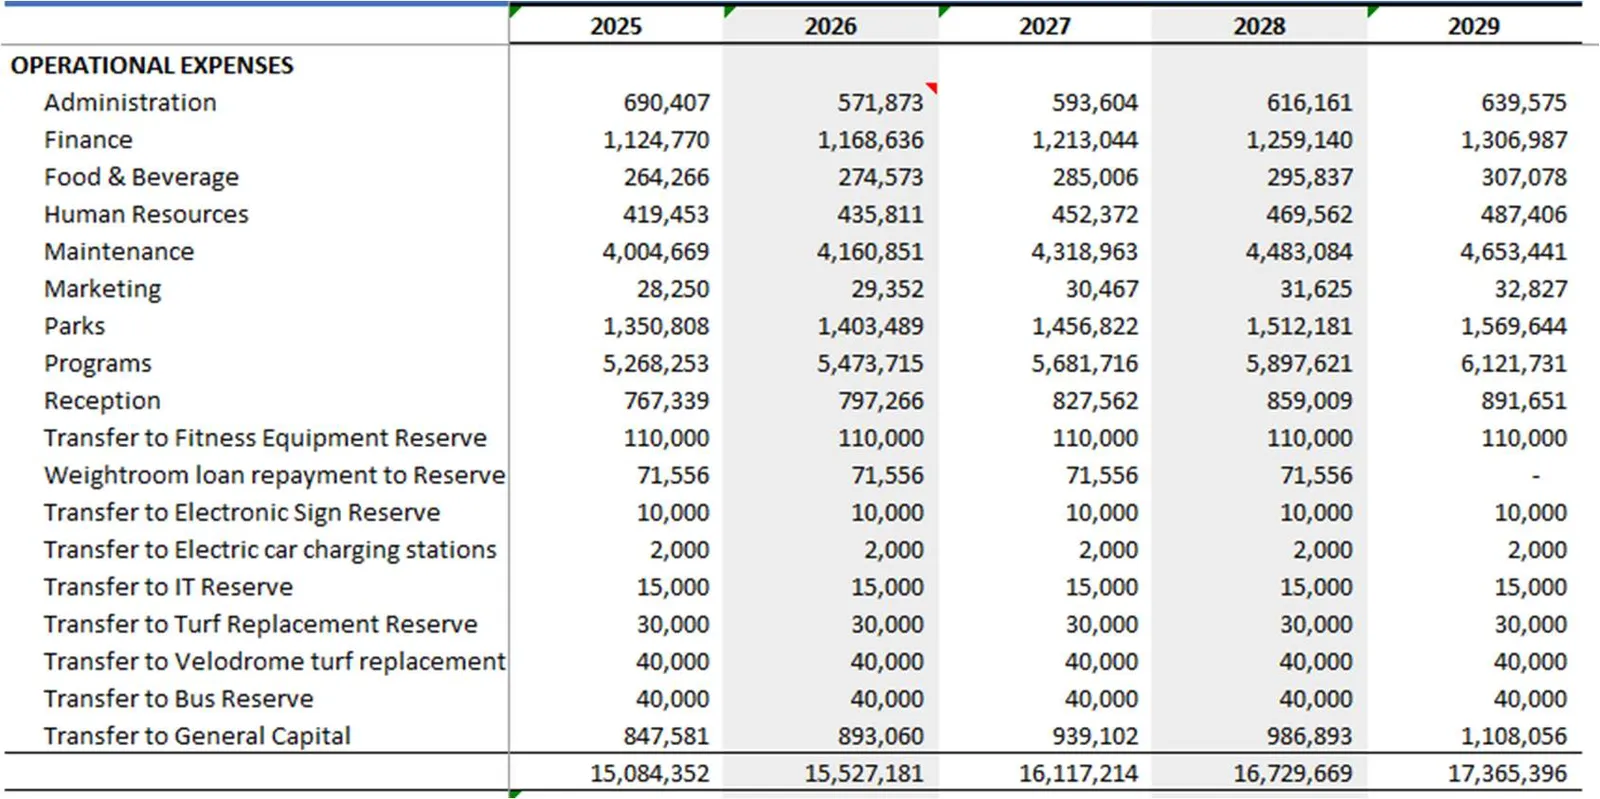
| OPERATIONAL EXPENSES | 2025 | 2026 | 2027 | 2028 | 2029 |
|---|---|---|---|---|---|
| Administration | 690,407 | 571,873 | 593,604 | 616,161 | 639,575 |
| Finance | 1,124,770 | 1,168,636 | 1,213,044 | 1,259,140 | 1,306,987 |
| Food & Beverage | 264,266 | 274,573 | 285,006 | 295,837 | 307,078 |
| Human Resources | 419,453 | 435,811 | 452,372 | 469,562 | 487,406 |
| Maintenance | 4,004,669 | 4,160,851 | 4,318,963 | 4,483,084 | 4,653,441 |
| Marketing | 28,250 | 29,352 | 30,467 | 31,625 | 32,827 |
| Parks | 1,350,808 | 1,403,489 | 1,456,822 | 1,512,181 | 1,569,644 |
| Programs | 5,268,253 | 5,473,715 | 5,681,716 | 5,897,621 | 6,121,731 |
| Reception | 767,339 | 797,266 | 827,562 | 859,009 | 891,651 |
| Transfer to Fitness Equipment Reserve | 110,000 | 110,000 | 110,000 | 110,000 | 110,000 |
| Weightroom loan repayment to Reserve | 71,556 | 71,556 | 71,556 | 71,556 | - |
| Transfer to Electronic Sign Reserve | 10,000 | 10,000 | 10,000 | 10,000 | 10,000 |
| Transfer to Electric car charging stations | 2,000 | 2,000 | 2,000 | 2,000 | 2,000 |
| Transfer to IT Reserve | 15,000 | 15,000 | 15,000 | 15,000 | 15,000 |
| Transfer to Turf Replacement Reserve | 30,000 | 30,000 | 30,000 | 30,000 | 30,000 |
| Transfer to Velodrome turf replacement | 40,000 | 40,000 | 40,000 | 40,000 | 40,000 |
| Transfer to Bus Reserve | 40,000 | 40,000 | 40,000 | 40,000 | 40,000 |
| Transfer to General Capital | 847,581 | 893,060 | 939,102 | 986,893 | 1,108,056 |
| Total | 15,084,352 | 15,527,181 | 16,117,214 | 16,729,669 | 17,365,396 |
- 2025 expense budget is $1.04 million or 7.5% higher than 2024’s $13,903,656.
- 3.8% increase year over year in future years
Page 46–58
2025 Capital Projects
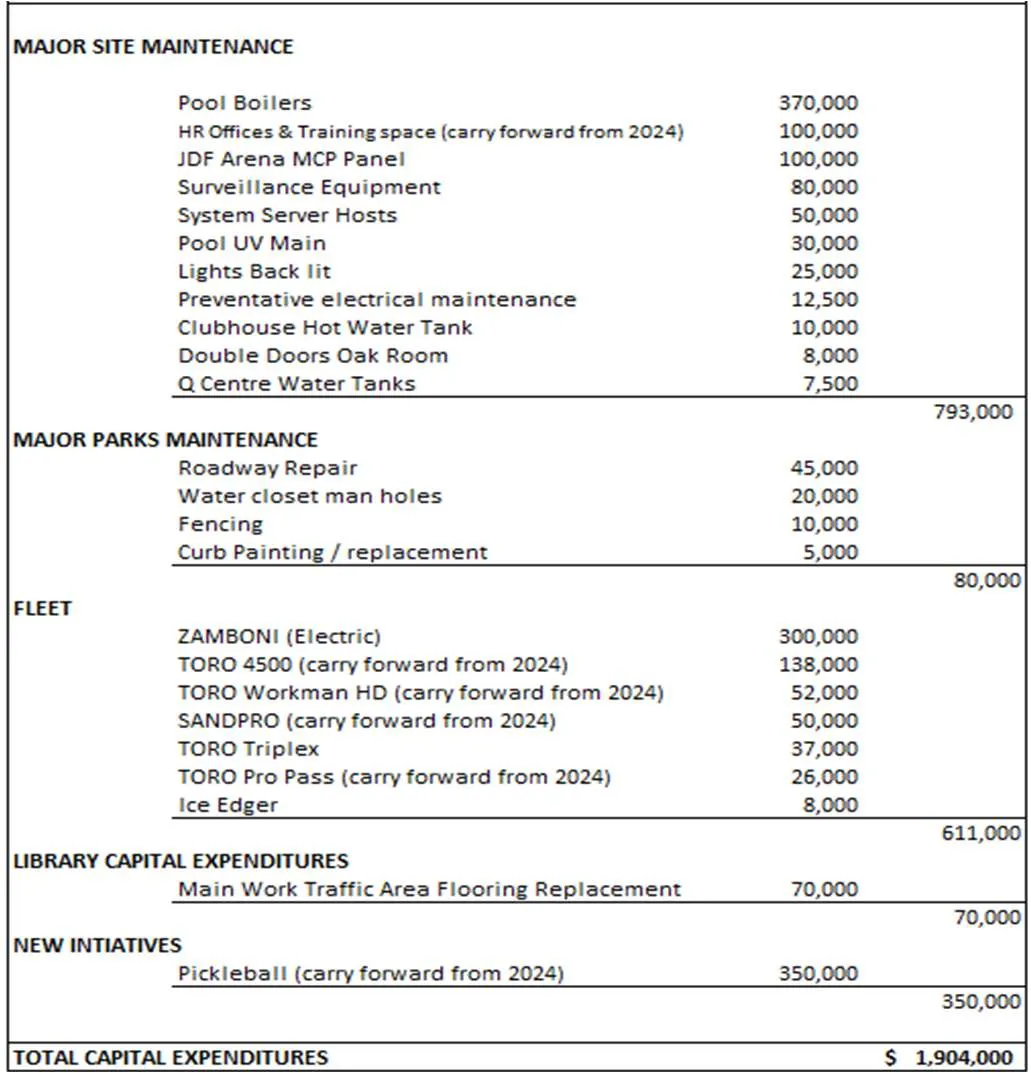
MAJOR SITE MAINTENANCE
- Pool Boilers: 370,000
- HR Offices & Training space (carry forward from 2024): 100,000
- JDF Arena MCP Panel: 100,000
- Surveillance Equipment: 80,000
- System Server Hosts: 50,000
- Pool UV Main: 30,000
- Lights Back lit: 25,000
- Preventative electrical maintenance: 12,500
- Clubhouse Hot Water Tank: 10,000
- Double Doors Oak Room: 8,000
- Q Centre Water Tanks: 7,500
- Total Major Site Maintenance: 793,000
MAJOR PARKS MAINTENANCE
- Roadway Repair: 45,000
- Water closet man holes: 20,000
- Fencing: 10,000
- Curb Painting / replacement: 5,000
- Total Major Parks Maintenance: 80,000
FLEET
- ZAMBONI (Electric): 300,000
- TORO 4500 (carry forward from 2024): 138,000
- TORO Workman HD (carry forward from 2024): 52,000
- SANDPRO (carry forward from 2024): 50,000
- TORO Triplex: 37,000
- TORO Pro Pass (carry forward from 2024): 26,000
- Ice Edger: 8,000
- Total Fleet: 611,000
LIBRARY CAPITAL EXPENDITURES
- Main Work Traffic Area Flooring Replacement: 70,000
- Total Library Capital Expenditures: 70,000
NEW INITIATIVES
- Pickleball (carry forward from 2024): 350,000
- Total New Initiatives: 350,000
TOTAL CAPITAL EXPENDITURES: $ 1,904,000
CAPITAL FUNDING
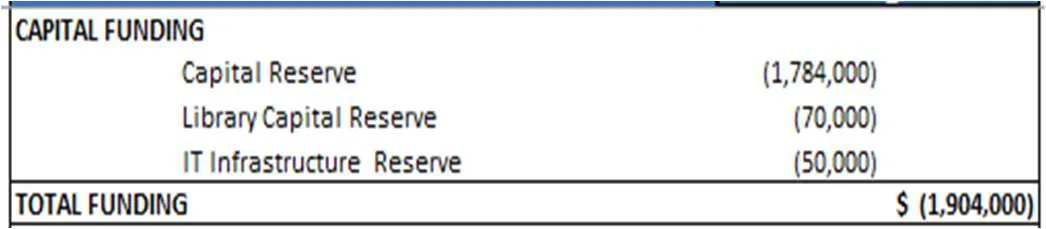
| CAPITAL FUNDING | Amount |
|---|---|
| Capital Reserve | (1,784,000) |
| Library Capital Reserve | (70,000) |
| IT Infrastructure Reserve | (50,000) |
| TOTAL FUNDING | $ (1,904,000) |
Note: approved projects not completed in 2024 are noted as carried forward for 2025.
Page 46–58
5-Year Capital Plan
| Category | 2025 | 2026 | 2027 | 2028 | 2029 |
|---|---|---|---|---|---|
| Major site maintenance | $793,000 | $814,500 | $815,000 | $987,500 | $625,500 |
| Major parks maintenance | 80,000 | 152,000 | 135,000 | 84,000 | 263,000 |
| Fleet | 611,000 | 62,000 | 179,000 | 408,000 | 199,000 |
| New initiatives | 350,000 | ||||
| Total WSPR | 1,834,000 | 1,028,500 | 1,129,000 | 1,479,500 | 1,087,500 |
| Library | 70,000 | 50,000 | 20,000 | 40,000 | |
| Total incl. Library | $1,904,000 | $1,078,500 | $1,149,000 | $1,519,500 | $1,087,500 |
Page 46–58
Reserve Continuity
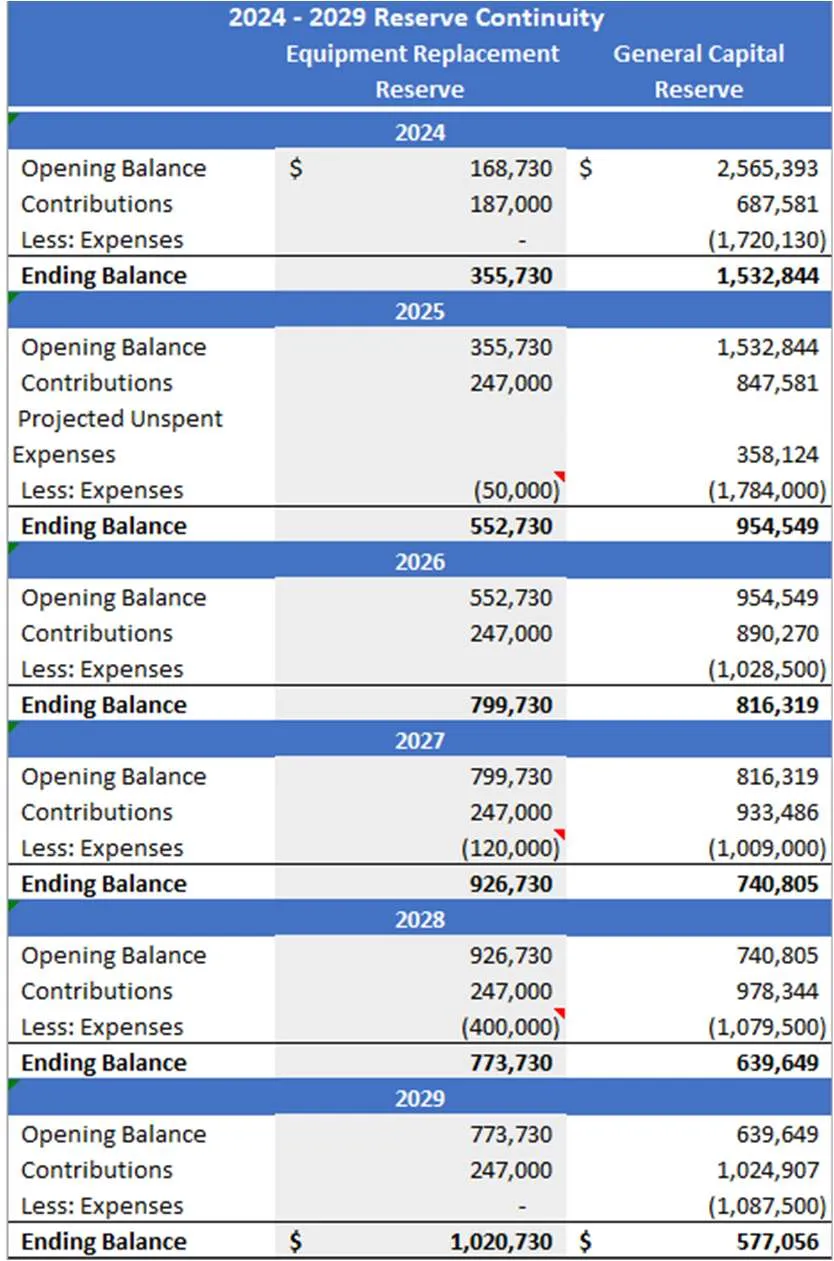
| 2024 - 2029 Reserve Continuity | Equipment Replacement Reserve | General Capital Reserve |
|---|---|---|
| 2024 | ||
| Opening Balance | $ 168,730 | $ 2,565,393 |
| Contributions | 187,000 | 687,581 |
| Less: Expenses | - | (1,720,130) |
| Ending Balance | 355,730 | 1,532,844 |
| 2025 | ||
| Opening Balance | 355,730 | 1,532,844 |
| Contributions | 247,000 | 847,581 |
| Projected Unspent Expenses | 358,124 | |
| Less: Expenses | (50,000) | (1,784,000) |
| Ending Balance | 552,730 | 954,549 |
| 2026 | ||
| Opening Balance | 552,730 | 954,549 |
| Contributions | 247,000 | 890,270 |
| Less: Expenses | - | (1,028,500) |
| Ending Balance | 799,730 | 816,319 |
| 2027 | ||
| Opening Balance | 799,730 | 816,319 |
| Contributions | 247,000 | 933,486 |
| Less: Expenses | (120,000) | (1,009,000) |
| Ending Balance | 926,730 | 740,805 |
| 2028 | ||
| Opening Balance | 926,730 | 740,805 |
| Contributions | 247,000 | 978,344 |
| Less: Expenses | (400,000) | (1,079,500) |
| Ending Balance | 773,730 | 639,649 |
| 2029 | ||
| Opening Balance | 773,730 | 639,649 |
| Contributions | 247,000 | 1,024,907 |
| Less: Expenses | - | (1,087,500) |
| Ending Balance | $ 1,020,730 | $ 577,056 |
Page 46–58
Converted Assessments
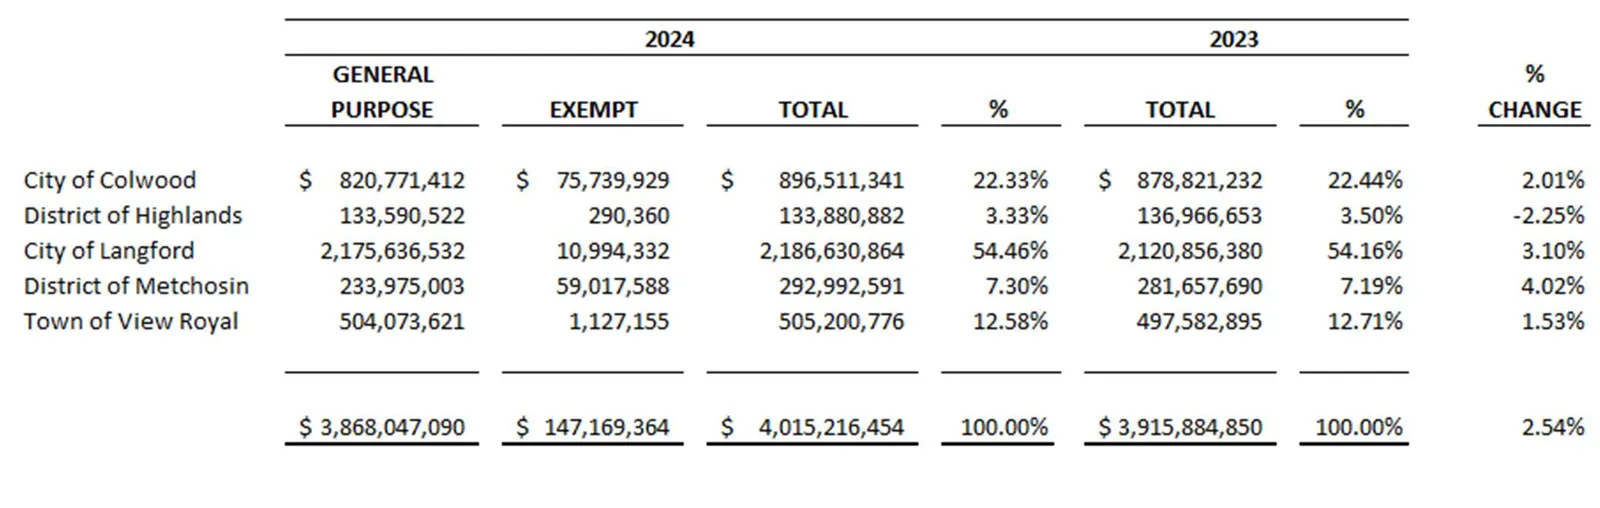
| Municipality | 2024 General Purpose | 2024 Exempt | 2024 Total | 2024 % | 2023 Total | 2023 % | % Change |
|---|---|---|---|---|---|---|---|
| City of Colwood | $ 820,771,412 | $ 75,739,929 | $ 896,511,341 | 22.33% | $ 878,821,232 | 22.44% | 2.01% |
| District of Highlands | 133,590,522 | 290,360 | 133,880,882 | 3.33% | 136,966,653 | 3.50% | -2.25% |
| City of Langford | 2,175,636,532 | 10,994,332 | 2,186,630,864 | 54.46% | 2,120,856,380 | 54.16% | 3.10% |
| District of Metchosin | 233,975,003 | 59,017,588 | 292,992,591 | 7.30% | 281,657,690 | 7.19% | 4.02% |
| Town of View Royal | 504,073,621 | 1,127,155 | 505,200,776 | 12.58% | 497,582,895 | 12.71% | 1.53% |
| Total | $ 3,868,047,090 | $ 147,169,364 | $ 4,015,216,454 | 100.00% | $ 3,915,884,850 | 100.00% | 2.54% |
Page 46–58
2025 Requisition
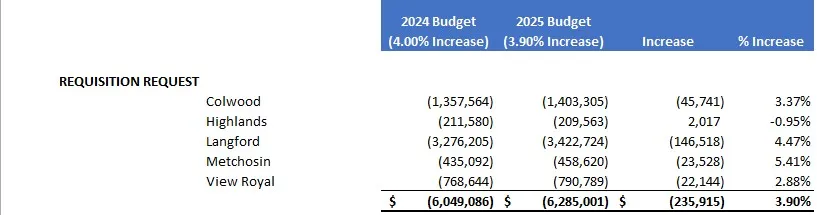
| REQUISITION REQUEST | 2024 Budget (4.00% Increase) | 2025 Budget (3.90% Increase) | Increase | % Increase |
|---|---|---|---|---|
| Colwood | (1,357,564) | (1,403,305) | (45,741) | 3.37% |
| Highlands | (211,580) | (209,563) | 2,017 | -0.95% |
| Langford | (3,276,205) | (3,422,724) | (146,518) | 4.47% |
| Metchosin | (435,092) | (458,620) | (23,528) | 5.41% |
| View Royal | (768,644) | (790,789) | (22,144) | 2.88% |
| Total | $ (6,049,086) | $ (6,285,001) | $ (235,915) | 3.90% |
- $235,915 or 3.9% increase proposed for 2025
- 0.26% or $15,915 for operating
- 3.64% or $220,000 for additional annual capital reserve contribution which includes the $60,000 annual increase requested by owners which began in 2021
- Requisition increases are in line with the approved 5-Year plan as presented last year
Page 46–58
Document Images
(1)
Extracted from: 2025 01 14 Committee of the Whole Agenda - Agenda - Pdf