Greater Victoria Public Library 2025 Budget and 2025-2029 Five Year Financial Plan
Comprehensive financial document detailing the library's operating and capital budgets and multi-year projections.
2025 Budget and 2025-2029 Five Year Financial Plan
Review / Approval Dates:
- Review - Finance Committee: August 20, 2024
- Review – Finance Committee: October 1, 2024
- Approval – Board of Trustees: October 22, 2024
Version: 2024-10-22
BUDGET AT A GLANCE
| 2025 | 2024 | |
|---|---|---|
| Operating Budget ¹ | $ 25,192,972 | $ 23,897,109 |
| Operating Budget Increase (Decrease) ² | 7.15% | 7.74% |
| Capital Budget | $ 2,035,749 | $ 1,794,952 |
| Capital Budget Increase (Decrease) | 13.42% | 5.86% |
| Total Budget - Funded ³ | $ 25,323,204 | $ 23,529,061 |
| Total Budget Increase (Decrease) | 7.63% | 7.60% |
| Municipal Contribution - Total | $ 21,846,722 | $ 20,707,793 |
| Municipal Contribution - Increase | $ 1,138,929 | $ 1,170,296 |
| Municipal Contribution - Increase (%) | 5.50% | 5.99% |
| Cost per Capita ⁴ | $ 57.58 | $ 56.00 |
| Cost per Capita Increase ⁵ | $ 3.00 | $ 3.17 |
| Population (Member Municipalities) ⁶ | 379,404 | 369,756 |
Note 1 – Operating budget consists of operating expenses only Note 2 – Net of Amortization Note 3 – Total budget funded is equal to Expenses (Operating budget) less amortization (non-funded expense) plus capital budget Note 4 – Municipal Contribution Total divided by Population Note 5 – Municipal Contribution Increase divided by Population Note 6 – As per BC Stats, 2023 Sub-Provincial Population Estimates
2025 Budget and Five-Year Financial Plan
| Revenues | 2024 | 2025 | Change | Change% | Notes | 2026 | 2027 | 2028 | 2029 |
|---|---|---|---|---|---|---|---|---|---|
| Municipal Contributions - Operating | $ 20,707,793 | 21,846,722 | $ 1,138,929 | 5.50% | 1 | $ 22,720,590 | $ 23,515,811 | $ 24,221,285 | $ 24,947,924 |
| Municipal Contributions - Start-up | - | - | - | 2 | - | - | - | - | |
| Provincial Grants | 676,339 | 712,372 | 36,033 | 5.3% | 3 | 678,372 | 678,372 | 678,372 | 678,372 |
| Fees and Misc. | 218,400 | 25,757 | (192,643) | -88.2% | 4 | 25,757 | 25,757 | 25,757 | 25,757 |
| Contracts for Service | 32,890 | 32,890 | - | 0.0% | 5 | 32,890 | 32,890 | 32,890 | 32,890 |
| Investment Income | 150,000 | 400,000 | 250,000 | 166.7% | 6 | 400,000 | 400,000 | 400,000 | 400,000 |
| Donations and Other Grants | 248,324 | 203,436 | (44,888) | -18.1% | 7 | 168,484 | 168,524 | 168,565 | 168,606 |
| Total Revenues | 22,033,746 | 23,221,176 | 1,187,430 | 5.4% | 24,026,094 | 24,821,354 | 25,526,869 | 26,253,549 | |
| Expenses (Operating Budget) | |||||||||
| Salaries and Benefits | 17,718,861 | 17,486,121 | (232,740) | -1.3% | 8 | 18,273,988 | 18,903,456 | 19,296,777 | 19,697,965 |
| Library Materials | 1,437,520 | 1,624,966 | 187,446 | 13.0% | 9 | 1,665,590 | 1,698,902 | 1,732,880 | 1,767,538 |
| Amortization | 2,163,000 | 1,905,517 | (257,483) | -11.9% | 10 | 1,905,517 | 1,905,517 | 1,905,517 | 1,905,517 |
| Supplies and Services | 1,238,620 | 2,229,537 | 990,918 | 80.0% | 11 | 1,701,950 | 1,609,487 | 1,640,676 | 1,672,490 |
| Building Occupancy | 913,972 | 1,271,002 | 357,030 | 39.1% | 12 | 1,250,277 | 1,274,282 | 1,248,768 | 1,273,743 |
| Other Expenses | 425,136 | 585,829 | 160,693 | 37.8% | 13 | 596,724 | 608,659 | 620,832 | 633,249 |
| Total Expenses | 23,897,109 | 25,102,972 | 1,205,863 | 5.0% | 25,394,045 | 26,000,302 | 26,445,450 | 26,950,501 | |
| Annual Surplus/(Deficit) | (1,863,363) | (1,881,795) | (18,433) | 1.0% | (1,367,952) | (1,178,948) | (918,582) | (696,953) | |
| Add back: Unfunded Amortization | 2,163,000 | 1,905,517 | (257,483) | -11.9% | 11 | 1,905,517 | 1,905,517 | 1,905,517 | 1,905,517 |
| 299,637 | 23,722 | (275,916) | 537,565 | 726,569 | 986,935 | 1,208,564 | |||
| Total Budget - Funded | 23,529,061 | 25,233,204 | 1,704,143 | 7% | 25,276,946 | 25,879,372 | 26,360,211 | 26,901,668 | |
| Municipal Contributions-Operating Increase | 5.95% | 5.50% | 4.00% | 3.50% | 3.00% | 3.00% | |||
| Municipal Contributions-Estimated Increase from prior year | 5.57% | 3.54% | 3.90% | 3.54% |
Capital Expenses and Transfers
| 2024 | 2025 | Change | Notes | 2026 | 2027 | 2028 | 2029 | |
|---|---|---|---|---|---|---|---|---|
| Balance forward from Page 1 | 299,637 | 23,722 | (275,916) | 537,565 | 726,569 | 986,935 | 1,208,564 | |
| Capital Expenses | ||||||||
| Library Materials - Operating | 1,427,352 | 1,364,249 | (63,103) | 9 | 1,398,355 | 1,426,322 | 1,454,849 | 1,483,946 |
| Hardware - Operating | 200,000 | 300,000 | 100,000 | 14 | 80,000 | 42,000 | 42,840 | 43,697 |
| Shelving - Operating | - | 80,000 | 80,000 | 14 | 82,000 | 83,640 | 85,313 | 87,019 |
| Furniture and Equipment - Operating | 105,800 | 216,000 | 110,200 | 14 | 150,675 | 153,689 | 156,762 | 159,898 |
| Building Improvement - Operating | 61,800 | 75,500 | 13,700 | 14 | 77,388 | 78,935 | 80,514 | 82,124 |
| Vehicles - Operating | - | - | - | - | - | - | - | |
| Branch Start-ups: Library Materials | - | - | - | - | - | - | - | |
| Total Capital Expenses | 1,794,952 | 2,035,749 | 240,797 | 1,788,418 | 1,784,586 | 1,820,278 | 1,856,683 | |
| Transfers | ||||||||
| Unrest. donations: Marketing Research | - | - | - | - | - | - | - | |
| Unrest. donations: Capital planning | - | - | - | - | - | - | - | |
| Transfer to Replacement Reserve | - | - | - | - | - | - | - | |
| Transfer from Replacement Reserve | - | (400,000) | (400,000) | (410,000) | (418,200) | (426,564) | (435,095) | |
| Transfer from Personnel Contingency Reserve | (600,000) | (481,041) | 118,959 | (318,041) | - | - | - | |
| Transfer from Library Materials Reserve | (495,315) | - | 495,315 | - | - | - | - | |
| Transfer in from ITS Reserve | - | (430,000) | (430,000) | - | (10,500) | (10,710) | (10,924) | |
| Transfer from Consulting Reserve | - | (200,000) | (200,000) | (100,000) | (100,000) | (50,000) | (50,000) | |
| Transfer from Contingency Reserve | (400,000) | (175,986) | 224,014 | (422,811) | (529,317) | (346,068) | (152,100) | |
| Transfer from Enhancement Reserve | - | (325,000) | (325,000) | - | - | - | - | |
| Transfer to/(from) Reserves | (1,495,315) | (2,012,027) | (516,712) | 15 | (1,250,852) | (1,058,017) | (833,342) | (648,119) |
| Financial Plan Balance | 0 | (0) | (0) | (0) | (1) | (1) | 1 | |
| Reserve Balance | 7,816,835 | 5,804,808 | 4,553,956 | 3,495,939 | 2,662,597 | 2,014,477 |
2025 MUNICIPAL CONTRIBUTIONS
| Municipality | Share 2024 | Total Requisition 2024 | Share 2025 | Operating Budget | Rent Adjustment ¹ | Total Requisition 2025 | Increase $ | Increase % |
|---|---|---|---|---|---|---|---|---|
| Central Saanich | 5.18% | $1,072,664 | 5.09% | $1,111,998 | $9,009 | $1,121,007 | $48,343 | 4.50% |
| Colwood | 5.30% | 1,097,513 | 5.33% | $1,164,430 | 7,155 | 1,171,585 | 74,072 | 6.70% |
| Esquimalt | 5.20% | 1,076,805 | 5.19% | $1,133,845 | -4,721 | 1,129,124 | 52,319 | 4.90% |
| Highlands | 0.74% | 153,238 | 0.76% | $166,035 | 1,022 | 167,057 | 13,819 | 9.00% |
| Langford | 12.67% | 2,623,677 | 13.38% | $2,923,091 | 18,119 | 2,941,210 | 317,533 | 12.10% |
| Metchosin | 1.48% | 306,475 | 1.52% | $332,070 | 2,020 | 334,090 | 27,615 | 9.00% |
| Oak Bay | 6.22% | 1,288,025 | 6.02% | $1,315,173 | -5,603 | 1,309,570 | 21,545 | 1.70% |
| Saanich | 32.63% | 6,756,953 | 31.91% | $6,971,289 | -25,659 | 6,945,630 | 188,677 | 2.80% |
| Victoria | 27.47% | 5,688,431 | 27.73% | $6,058,096 | -2,538 | 6,055,558 | 367,127 | 6.50% |
| View Royal | 3.11% | 644,012 | 3.07% | $670,694 | 1,196 | 671,890 | 27,878 | 4.30% |
| Total | 100% | $20,707,783 | 100% | $21,846,722 | $0 | $21,846,722 | $1,138,939 | 5.50% |
¹ The Rent Adjustment is calculated in accordance with Section 8.12 (a), (b) and (c) of the Library Operating Agreement and relates to portions of buildings used to benefit all member municipalities: the Collection and Technical Services section of the Juan de Fuca Branch building and the Administrative portion of the Central Branch building. Municipalities which did not contribute to the initial acquisition of such building or who did not subsequently purchase a portion of such building pays reasonable rent to those Municipalities that did.
2025 MUNICIPAL PER CAPITA CONTRIBUTIONS
| Municipality | Total Requisition 2025 | Population ¹ 2025 | Cost Per Capita 2025 | Increase per capita | increase |
|---|---|---|---|---|---|
| Central Saanich | $1,111,998 | 18,369 | 60.54 | $2.63 | $48,343 |
| Colwood | $1,164,430 | 21,403 | 54.41 | $3.46 | $74,072 |
| Esquimalt | $1,133,845 | 19,017 | 59.62 | $2.75 | $52,319 |
| Highlands | $166,035 | 2,894 | 57.37 | $4.78 | $13,819 |
| Langford | $2,923,091 | 55,069 | 53.08 | $5.77 | $317,533 |
| Metchosin | $332,070 | 5,295 | 62.71 | $5.22 | $27,615 |
| Oak Bay | $1,315,173 | 18,888 | 69.63 | $1.14 | $21,545 |
| Saanich | $6,971,289 | 125,380 | 55.60 | $1.50 | $188,677 |
| Victoria | $6,058,096 | 100,505 | 60.28 | $3.65 | $367,127 |
| View Royal | $670,694 | 12,584 | 53.30 | $2.22 | $27,878 |
| Total | $21,846,722 | 379,404 | $57.58 | $3.00 | $1,138,939 |
¹ Source of population figures - BC Stats website: https://www2.gov.bc.ca/gov/content/data/statistics/people-population-community/population/population-estimates, 2023, accessed July 2024
General note: Percentage share of costs by municipality are determined based on 50% property assessment value and 50% population estimate. More detailed information on assessment values and population are available on request.
Notes to the 2025 Budget and Five-Year Financial Plan
Approximately 90% of the GVPL operating budget is funded by our ten municipal partners. Consequently, a key objective is to balance and maintain municipal contribution increases within an acceptable range, typically based on rates of inflation and wage increases as negotiated through the Greater Victoria Labour Relations Association.
Because needs and opportunities change over time as we strive to best serve our communities within the Greater Victoria area, GVPL’s budget process allows reasonable flexibility for business areas to adapt and optimize their activities as events unfold, while still requiring system-wide financial planning and accountability.
While maintaining status quo is the ideal it is recognized that the Fiscal 2025 Budget will be impacted by a number of unknowns most notably: the current collective agreement expires on December 31, 2024. The Board’s strategic planning process will be completed at the end of 2024 and potential costs associated with a new plan cannot yet be projected. In addition, uncertainties related to the timing of branch development requirements may result in unanticipated costs. Costs for branches service delivery are budgeted in 2025 and future years at 2024 service levels. Support costs for providing library services continue to increase due to high inflation and escalating safety and security, facilities and system infrastructure costs.
GVPL is committed to operating efficiently and effectively to deliver library services to 10 municipalities. The library system leverages more than 100 active community partnerships to expand programs and lifelong learning opportunities for Greater Victoria residents.
Budget Methodology – Costs funded from Reserves The 2025 Budget utilizes Reserve balances including the newly created Enhancement Reserve. The explanations in each expense category break out the increase that is funded from Reserves versus the increase funded by Municipalities in the current budget year, 2025.
The Greater Victoria Public Library budget is allocated as illustrated below. The majority (69.52%) is attributed to salaries and benefits which are jointly negotiated through the Greater Victoria Labour Relations Association (GVLRA). Salaries and benefits are the key cost driver for GVPL.
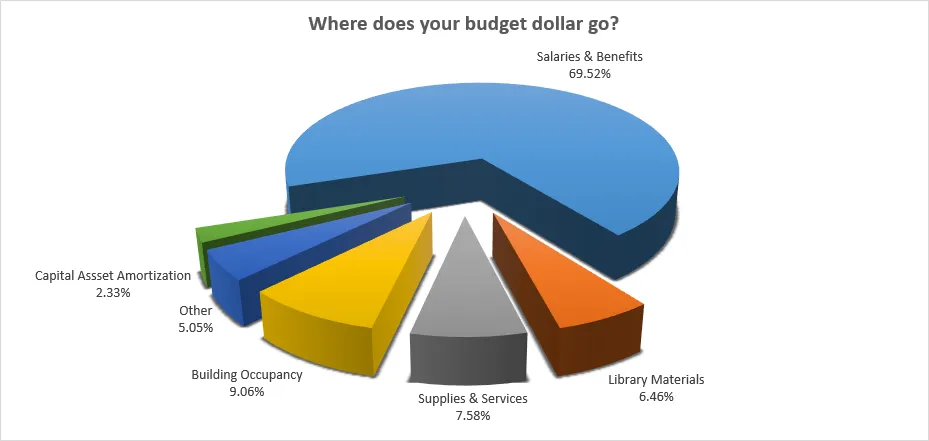
Components of the 2025 budget include the following:
1. Municipal Contributions – Operating Increase $1,138,929 or 5.5%
2. Municipal Contributions – Start-up Nil This line item represents any funds made available within the operating budget specifically identified for a new branch or relocation of an existing branch. No costs related to Nellie McClung relocation, or alternate service delivery have been included.
3. Provincial Grants Increase $36,033 Regular Provincial funding (operating) for public libraries in British Columbia is based on the base funding received in 2024. Enhancement Grant funding is not included as it is not guaranteed. The base funding increased in 2023.
4. Fees and Misc. (formerly Fines, Fees and Printing) Decrease $192,643 Historically this revenue category included revenue relating to fines, fees, meeting room rentals and printing. Overdue fines are no longer charged, and policies and procedures related to printing and meeting room rentals are under review, so the category has been renamed. Projected revenue for fees associated with lost and paid for materials has been reduced based on 2024 forecasts.
5. Contracts for Service No Change This is an annual payment from the Capital Regional District for service delivery relating to the Juan de Fuca Electoral District. (Willis Point, Durrance, Malahat).
6. Investment Income Increase $250,000 Investment revenue is conservatively estimated to reflect projected continuation of modest earnings in the Municipal Finance Authority bond fund and an increase in returns for secured GIC’s and operating bank interest that reflects increased interest rates. Investment revenue in 2023 was $600K. Investment revenue in 2024 is estimated to be $450K.
7. Donations and Other Grants Decrease $44,888 Donations and grants can vary from year to year and are dependent on specific funded programs and services planned during the year. New funding opportunities will continue to be explored.
8. Salaries and Benefits Decrease $232,740 Labour is budgeted at full scheduled hours. Sunday services will continue to be reviewed based on staff availability. Staff gapping or an estimation of vacancies is included in the budget.
- Decreases for:
- An increase to Staff Gapping to a 10% expected vacancy rate from 5% results in savings - ($908K) including benefits
- Strategic Bridging Plan positions budgeted in 2024 not included in 2025 – ($620K) including benefits
- Increases for:
- Contractually negotiated increases (estimated) - $603K including benefits
- Additional budgeted positions due to planned FTE increases and a reconciliation between standard schedules and budgeted - $618K including benefits.
- Personnel Reserve is being utilized to partially fund the cost increase in 2025 and 2026 - $363K
This budget includes employee benefit costs and payroll withholding costs such as EI and CPP. A detailed benefit review is completed as part of the annual budget development process. As a result of this year’s analysis, we have determined that a decrease of 0.5% in the rate of benefits is more accurate.
9. Library Materials (Expensed and Capital) Increase Expense – eResources and Digital Assets $232,740 Decrease Capital – Physical Materials ($63,103) The library materials budget is split between Expenses for periodicals and eResources and Capital for books, audio visual and electronic materials which are capitalized as assets and amortized over 7 years. Demand for digital resources continues to increase. As a result, funds are being allocated from capital to expenses. The overall increase is 4.3%.
10. Amortization Decrease $257,483 This is the estimated amortization expense for tangible capital assets, in accordance with the Board’s Tangible Capital Asset policy. Since this is an unfunded expense, it is added back to the budgeted annual surplus, and does vary year over year depending on capital asset purchases and disposals. GVPL has seen a trend of funding capital assets less than amortization. This trend is changing with increased capital spending planned for 2025.
11. Supplies and Services Increase $990,918 The majority of the increase is for specific one-time initiatives, funded from Reserves. Ongoing supplies and services costs that are funded by Municipalities include general and office supplies, telephone, networks, subscription and licensing, professional fees, advertising, printer paper, moving costs and shuttle fuel. This category also includes furniture, computer and other equipment and peripherals under $1000. The primary drivers for the increase to ongoing costs in this category are related to higher network and licensing costs.
Additionally, a change in the capital budgeting process to be consistent with accounting practices results in a one-time increase of $60K to the Supplies and Services category and a reduction in the Capital category.
Increase to Municipal funded costs $196,157 or 16% Funding from Reserves for specific one-time initiatives - $794,761
12. Building Occupancy Increase $357,030 Building occupancy includes building maintenance, security, recycling and refuse collection and utilities. The main cost driver in this category is security services. Increased security services, $138K are required to provide a secure safe place for both staff and patrons. The 2024 Budget represents one security guard at CE, both inside the branch in in the courtyard. The 2025 Budget represents two security guards, as well as costs for added security at other branches. Increase to Municipal funded costs, $157,030 Funding from Reserves – $200,000
13. Other Expenses Increase $160,693 Other expenses include insurance, employee recruitment costs, training, and business travel expenses. Printer lease, copy costs and paper are also included in this category. The increase is primarily a result of higher costs associated with increased public printing. Training and professional development costs are expected to increase as a result of a new professional development framework. Increase to Municipal funded costs $85,693 Funding from Reserves – $75,000
14. Capital Expenditures (Hardware, Furniture and Equipment, Shelving, Building Improvement) Increase $240,797 Capital expenditures increases are primarily due to increased IT hardware replacement costs, mainly funded from Reserves. A change in the capital budgeting process to be consistent with accounting practices results in a one-time increase to Capital expenditures that represents Facility Project costs funded from the Replacement Reserve and a re-allocation from Capital to other categories that represent facility projects costs considered expenses, for example: fabric or electrical repairs. Decrease to Municipal funded costs $194,203 Funding from Reserves – $410,000 Grant funding - $25,000
15. Transfer to/(from) Reserves Change in Net Transfer From Reserves ($516,712) The 2025 budget utilizes Reserve balances to augment funding for facility upgrades, increased security costs and information technology infrastructure; as well as new initiatives relating to Occupational Health and Safety compliance, EDIA related recommendations and an updated website/virtual branch infrastructure. The Enhancement Reserve balance must be spent by December 31, 2025. Any transfers to and from reserves are approved by the Board of Trustees through the Budget approval process or specific briefing notes.
Appendix 1 - Reserve Fund Balances
| Reserve Fund | Dec 2023 Balance | 2023 Surplus Alloc | June 1/24 Balance | Planned 2024 | 2025 Budget | Planned 2026-2029 | Forecasted Balance 2029 |
|---|---|---|---|---|---|---|---|
| Replacement | 1,584,611 | 353,425 | 1,938,036 | (243,000) | (400,000) | (1,689,859) | (394,823) |
| Personnel | 1,429,462 | - | 1,429,462 | (100,000) | (481,041) | (318,041) | 530,380 |
| Library Material | 546,141 | 166,044 | 712,185 | - | - | - | 712,185 |
| ITS Replacement | 508,053 | 350,000 | 858,053 | (173,823) | (430,000) | (32,134) | 222,096 |
| Consulting Reserve | 958,559 | - | 958,559 | (75,000) | (200,000) | (300,000) | 383,559 |
| Contingency | 1,187,363 | 1,000,000 | 2,187,363 | - | (175,986) | (1,450,296) | 561,081 |
| Enhancement Reserve (2023 Province of BC Enhancement Grants) | - | 1,453,065 | 1,453,065 | (1,128,065) | (325,000) | - | - |
| Total Reserve Funds | 6,214,189 | 3,322,534 | 9,536,723 | (1,719,888) | (2,012,027) | (3,790,330) | 2,014,478 |