Staff Report: FINANCIAL PLAN REVIEW – ENVIRONMENTAL, PARKS, AND RECREATION & CULTURAL SERVICES
A financial review of various municipal services to build groundwork for the 2024-2028 Financial Plan development.
FINANCE & ADMINISTRATION REPORT
TO: Committee of the Whole
DATE: January 3, 2024
FROM: D. Christenson, Director of Finance & Technology
MEETING DATE: January 9, 2024
FINANCIAL PLAN REVIEW – ENVIRONMENTAL, PARKS, AND RECREATION & CULTURAL SERVICES
RECOMMENDATION:
THAT the report titled “Financial Plan Review – Environmental, Parks, and Recreation & Cultural Services” by the Director of Finance & Technology be received for information.
PURPOSE:
To provide information about Environmental, Parks, and Recreation & Cultural Services as a part of the financial planning cycle in advance of the 2024-2028 Financial Plan development.
TIME CRITICAL:
On June 20, 2023, Council approved the proposed 2024-2028 Financial Planning Calendar (attached) that lists the activities and opportunities for public engagement that will culminate in the adoption of the five-year financial plan for those years. The schedule includes a systematic review of each functional division’s financial plans early in the process to build the groundwork for subsequent activities.
EXECUTIVE SUMMARY:
The Environmental Services function, administered by the Engineering Department, is responsible for the collection and disposal of solid waste (garbage and kitchen scraps) and liquid waste management (sanitary sewer). Both solid and liquid waste services are funded completely from user fees, which are based on dwelling units for solid waste collection and water consumption for liquid waste services. User fees are adjusted each year to recover the projected costs for the year. Operating revenue directly attributable to Environmental Services averages between 12% and 19% of total operating revenue (2020-2023). In total, Environmental Services comprise about 15% of total municipal operating costs on average (2020-2023).
The Parks Services function is responsible for the maintenance and development of over eighty parks and associated connective trails in View Royal. Parks Services comprise about 5% of the total municipal operating costs on average. Parks Services do not generate any direct revenue and are supported entirely through property taxation.
View Royal provides recreation and library services through its partnership with other municipalities in the West Shore Parks and Recreation Society and the Greater Victoria Public Library system. The recreation service is fully funded by casino revenue, and the 2023-2027 Financial Plan includes a gradual transition away from sole reliance on casino revenue for funding recreation services, starting in 2024, by introducing a 0.5% tax increase annually specifically for the West Shore Parks and Recreation requisition. Library services are 100% funded from taxation.
BACKGROUND:
The five-year financial plan includes estimates of revenue and expense to maintain View Royal services, categorized by functional division. This report provides a historical look at the financial results of Environmental, Parks, and Recreation & Cultural Services in the context of the overall budget and highlights significant components.
DISCUSSION:
ENVIRONMENTAL SERVICES
Services
The Environmental Services function, administered by the Engineering Department, is responsible for the collection and disposal of solid waste (garbage and kitchen scraps) and liquid waste management (sanitary sewer).
Collection and delivery of solid waste to the landfill is provided under contract by a third-party contractor (Waste Management).
View Royal’s sanitary sewer system consists of gravity pipe, pressure pipe, and seventeen pump stations, collecting sewer and discharging to the Capital Regional District’s (CRD’s) regional trunk system. While staff manage the overall operations of the system, they rely on third party contractors to provide the regular maintenance.
Operating revenue and expense
Schedule A Environmental Services Operating Revenue (attached) details the budgeted and actual revenue for 2019-2023 (year-to-date). Prior to 2020, the cost to operate and maintain the CRD’s regional trunk system was relatively small and was included in the CRD requisition directly on the property tax notice. With the new regional wastewater treatment plant coming online, these costs became more significant and drove the change to transition the method of cost recovery away from taxation (based on assessment values) to user fees (based on metered water consumption) as a more equitable means of funding.
Since 2020, both solid and liquid waste services are funded completely from user fees, which means that only users who have the services available to them pay for the service. Rates are established on a basis relative to the deemed use of the service, such as number of dwelling units for garbage and kitchen scrap user fees and water consumption for sewer user fees. Each year, these rates are adjusted to recover the estimated costs to provide the services and to factor in changes in user metrics. Operating revenue directly attributable to Environmental Services averages between 12% and 19% of total operating revenue (2020-2023).
Schedule B Environmental Services Operating Expense (attached) details the budgeted and actual expense for 2019-2023 (year-to-date) and shows that Environmental Services comprise about 15% of total municipal operating costs on average (2020-2023). Costs to operate and maintain the sanitary sewer system, including the costs apportioned by the CRD, represent about 75% and garbage collection costs are about 25% of the total Environmental Services budget.
Unlike taxation-funded services, Environmental Services are allocated a portion of centralized support services costs, such as general administration, finance, information technology, human resources, and communication. Doing so ensures that these functions are included in the cost-recovery calculation of user fees.
Sanitary sewer user fees also include a component that represents an annual contribution to the sewer capital reserve. This reserve funds the renewal or replacement of the assets, such as pump stations, that ensure uninterrupted delivery of sewer collection and disposal services.
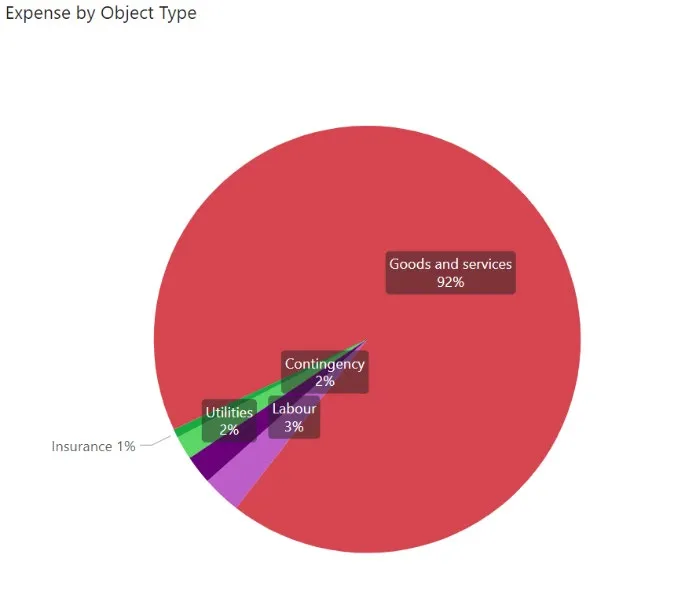
Most of the Environmental Services operating budget is allocated to the cost of goods and services (92%) since these services are primarily delivered under contract. Fifty percent (0.5 full-time equivalent) of the Engineering Technologist’s labour cost is allocated to the sanitary sewer budget and represents 3% of the total Environmental Services operating budget. Expenses for the service by various component costs are shown in the diagram above.
PARKS SERVICES
Services
The Parks Services function, administered by the Engineering Department, is responsible for the maintenance and development of over eighty parks in View Royal, including manicured and natural green spaces, trails, beach accesses, sports fields, and seasonal decorations. The Parks department also maintains the grounds at View Royal’s Town Hall, oversees building and fleet maintenance, and provides after hours emergency call out duties.
Operating revenue and expense
Schedule C Parks Services Operating Expense (attached) details the budgeted and actual expense for 2019-2023 (year-to-date) and shows that Parks Services comprise about 5% of the total municipal operating costs on average. Parks Services do not generate any direct revenue and are supported entirely through property taxation.
It is important to understand that centralized support services costs, such as general administration, Engineering department administration, finance, information technology, human resources, and communication, are not generally allocated to Parks Services.
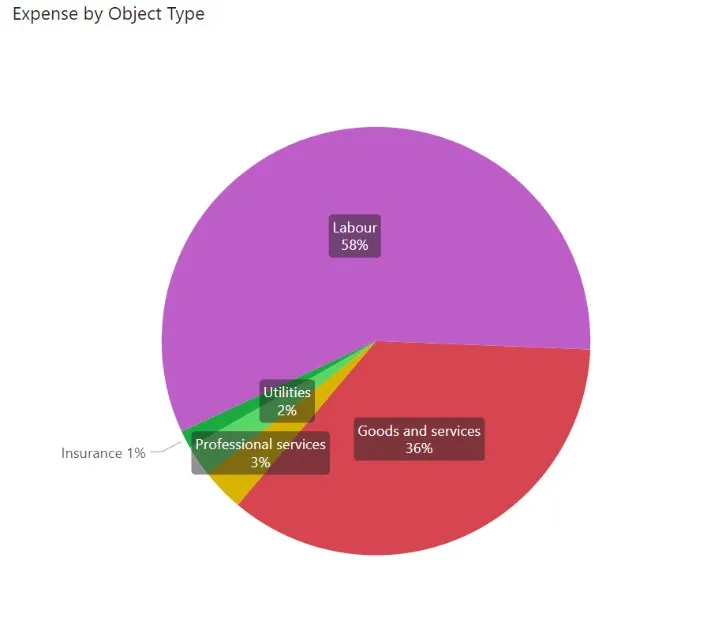
Most of Parks Services budget is allocated to labour costs (58%), as primarily the work is delivered through in-house staff. The Parks crew, managed by the Engineering Department, comprises five full-time staff and up to two summer students (total 0.62 full-time equivalents), which represents about 12% of View Royal’s total personnel. Purchased goods and contracted services account for 36% of the total parks budget. Expenses for the service by various component costs are shown in the diagram at left.
RECREATION & CULTURAL SERVICES
Services
View Royal provides recreation and library services through its partnership with other municipalities in the West Shore Parks and Recreation Society and the Greater Victoria Public Library system.
The West Shore Parks and Recreation Society, owned by the municipalities of View Royal, Colwood, Langford, Metchosin, and Highlands, manages the Juan de Fuca Recreation Centre.
View Royal participates in the Greater Victoria Public Library system and shares in the cost of maintaining the Central Branch.
Operating revenue and expense
Schedule D Recreation & Cultural Services Operating Expense (attached) details the budgeted and actual expense for 2019-2023 (year-to-date) and shows that Recreation & Cultural Services comprise about 9% of the total municipal operating costs on average. Recreation & Cultural Services do not generate any direct revenue to View Royal. Net costs to deliver the services are requisitioned each year.
The recreation component of the Recreation & Cultural Services budget historically has been funded through an allocation of gaming revenue from the casino. While the 2023 budget continued to fund recreation services from casino revenue, the 2023-2027 Financial Plan proposed to begin a gradual transition away from sole reliance on casino revenue for funding recreation services, starting in 2024, by introducing a 0.5% tax increase annually specifically for the West Shore Parks and Recreation requisition.
The library component of the Recreation & Cultural Services budget also was historically funded through an allocation of gaming revenue from the casino; however, the transition away from casino revenue funding for this service was completed in 2017, and library services are now 100% tax funded.
On average, recreation services, delivered through West Shore Parks and Recreation Society, represent about 59% of the total, while library services, delivered through the Greater Victoria Public Library, represent about 41% of the total Recreation & Cultural Services budget.
As with View Royal’s other tax-funded services, centralized support services costs, such as general administration, finance, information technology, human resources, and communication, are not allocated to Recreation & Cultural Services. The Recreation & Cultural Services budget does not include any labour costs, as no internal staff are involved in delivering these services. Each budget for both recreation and library services comprise the requisition from the respective agency.
SUSTAINABILITY/CLIMATE CHANGE IMPACTS:
The proportion of annual or frequently recurring expense that is funded from annually recurring or predictable revenue sources, such as taxation or user fees, is a measure of financial sustainability. Except for the recreation service delivered through West Shore Parks and Recreation Society, the services described in this report are primarily funded from taxation revenue or user fees and are financially sustainable to the extent that the service can maintain its existing financial obligations without increasing the funding burden relative to the local economy.
FINANCIAL IMPLICATIONS:
There are no significant financial implications associated with the proposed recommendation.
ALTERNATIVES:
None.
CONCLUSION:
The Environmental, Parks, and Recreation & Cultural Services deliver solid and liquid waste management, parks, recreation, and cultural services in View Royal. Together, these services comprise nearly a third (29%) of View Royal’s operational budget. Environmental services are funded exclusively through user fees, while parks and library services are funded through taxation. Recreation services, provided by West Shore Parks and Recreation, are funded through use of casino revenue.
| CONCURRENCE: | Initials | Comments |
|---|---|---|
| Acting Chief Administrative Officer | SJ | Support receipt |
| REVIEWED BY: | Initials |
|---|---|
| Director of Finance | DLC |
| Director of Engineering | IL |
ATTACHMENTS:
- 2024-2028 Financial Planning Calendar
- Schedule A Environmental Services Operating Revenue
- Schedule B Environmental Services Operating Expense
- Schedule C Parks Services Operating Expense
- Schedule D Recreation & Cultural Services Operating Expense
Document Images
(1)