Financial Plan Review – Transportation Services
Historical and prospective review of Transportation Services' budget, revenue, and expenses as part of the five-year planning cycle.
TOWN OF VIEW ROYAL FINANCE & ADMINISTRATION REPORT
TO: Committee of the Whole DATE: October 3, 2023 FROM: D. Christenson, Director of Finance MEETING DATE: October 10, 2023
FINANCIAL PLAN REVIEW – TRANSPORTATION SERVICES
RECOMMENDATION:
THAT the report titled “Financial Plan Review – Transportation Services” by the Director of Finance be received for information.
PURPOSE:
To provide information about Transportation Services as a part of the financial planning cycle in advance of the 2024-2028 Financial Plan development.
TIME CRITICAL:
On June 20, 2023, Council approved the proposed 2024-2028 Financial Planning Calendar (attached) that lists the activities and opportunities for public engagement that will culminate in the adoption of the five-year financial plan for those years. The schedule includes a systematic review of each functional division’s financial plans early in the process to build the groundwork for subsequent activities. Accordingly, this report provides a review of Transportation Services financial plans.
EXECUTIVE SUMMARY:
Transportation Services encompasses a wide range of activities that maintain View Royal’s transportation systems for its citizens and visitors. The 6 full-time and 1 part-time staff work with contractors and others to deliver year-round road maintenance and other support services such as development servicing, engineering permitting, mapping, fleet maintenance and several capital projects scheduled year to year. Staff also share responsibilities with the Parks Department, Environmental Services and building maintenance.
While most (2023 – 93%) of the services provided by the Transportation Services division are funded through property taxes, View Royal receives revenue for services provided to external entities. Revenue attributed to Transportation Services comprises less than 1% of total 2023 View Royal operational revenue.
Transportation Services expense comprises 19% of View Royal’s total operating expense on average, with most (71%) allocated to maintenance of the transportation and drainage systems and 29% to administration. The costs of goods and services represent 65% of total service expense, including significant contracted services for road and boulevard maintenance. On average, labour costs account for 22% of Transportation Services operating expense.
The Transportation Services component of View Royal’s budget is generally financially sustainable, since most recurring expenses are funded by recurring or predictable revenue.
BACKGROUND:
The five-year financial plan includes estimates of revenue and expense to maintain View Royal services, categorized by functional division. This report provides a historical look at the financial results of Transportation Services in the context of the overall budget and highlights significant components.
DISCUSSION:
Services
Transportation Services, delivered through View Royal’s Engineering Department, provides maintenance of View Royal’s transportation systems for View Royal’s citizens and visitors. Most maintenance services, such as snow and ice removal, are provided under contract rather than through in-house personnel and equipment. The Transportation Services budget also includes general administrative, geographic information services (GIS), and operational fleet services; this work supports other View Royal services; however, the value of this work is not internally allocated to benefiting services.
The services provided by the Transportation Services division include:
- Roads, streets, and bridges maintenance
- Line painting and traffic calming maintenance
- Boulevards and sidewalks maintenance
- Bus shelters maintenance
- Drainage systems maintenance
- Signals, signs, and street lighting maintenance
- Lawn and garden waste collection and disposal
- Snow and ice removal and winter roads maintenance
- Transportation related capital projects
- Streets, utility and underground servicing and permitting
- Development servicing
Operating revenue and expense
Schedule A Operating Revenue (attached) details the budgeted and actual revenue for 2019-2023 (year-to-date). Primarily, revenue arises from work done on behalf of others, such as where boulevards span both public and private property, through developer service agreements, and under an operating agreement with Fortis BC. In total, revenue directly attributable to Transportation Services averages less than 1% of total operating revenue.
Schedule B Operating Expense (attached) details the budgeted and actual expense for 2019-2023 (year-to-date) and shows that Transportation Services comprise about 19% of total municipal operating costs on average. Of total Transportation Services expense, maintenance of the transportation system comprises 62% of the service’s budget, administration 29%, and drainage system maintenance 9%. It is important to understand that centralized support services costs, such as general administration, finance, information technology, human resources, and communication, are not generally allocated to Transportation Services. Likewise, not all administrative costs included in the Transportation Services budget are directly related to transportation, since there is some overlap in personnel between Engineering, Parks, and Environmental Services.
The Transportation Services budget includes labour costs for 5.5 full-time and 1 part-time personnel with additional funding for an engineering student in the summer months. Transportation Services comprises about 14% of View Royal’s total personnel. All Transportation Services labour costs are attributed to the Transportation administrative budget.
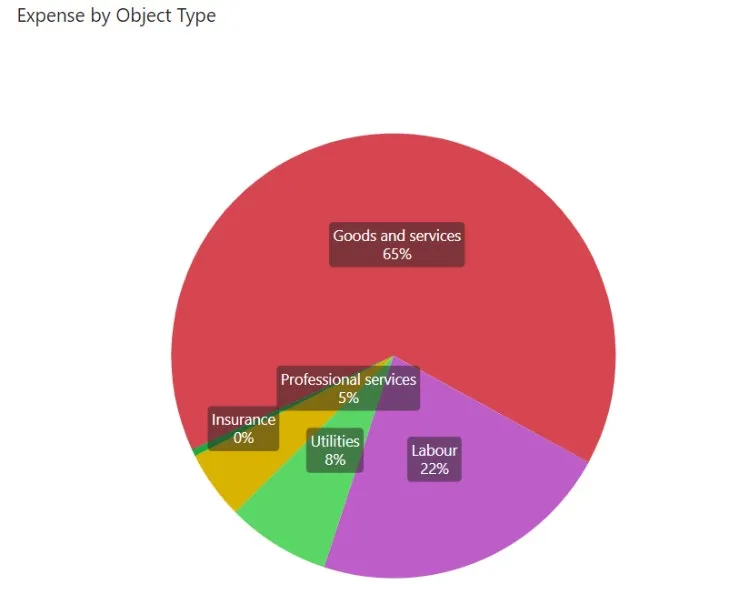
The greater portion (65%) of Transportation Services budget is allocated to contracts for goods and services such as those for road and boulevard maintenance. This component also includes costs to maintain the operations fleet vehicles. In-house labour costs comprise 22% of the total budget, on average. Utilities, such as the cost of water, sewer, and electricity, comprise 8% of the service budget. As previously noted, indirect costs, such as those for general administration, finance, and information technology, are not allocated to this budget, but instead, are described in the General Administration budget.
SUSTAINABILITY/CLIMATE CHANGE IMPACTS:
The proportion of annual or frequently recurring expense that is funded from annually recurring or predictable revenue sources, such as taxation or user fees, is a measure of financial sustainability. Transportation Services is primarily funded from taxation revenue (93%) and is financially sustainable to the extent that the service can maintain its existing financial obligations without increasing the tax burden relative to the local economy.
FINANCIAL IMPLICATIONS:
There are no significant financial implications associated with the proposed recommendation.
It should be noted that the Engineering department is a lean department in that some staff are also responsible for some aspects of other departments. This includes but is not limited to:
- Environmental Services (Liquid Waste) – Sanitary Sewer Maintenance and Capital Projects
- Environmental Services (Solid Waste) – Coordination and administration of garbage collection and yard and garden waste
- Parks – permitting, and coordination of Town intitives (Greater Victoria Green Teams, Resident Tree Planting program, etc)
- Building and fleet maintenance
ALTERNATIVES:
None.
CONCLUSION:
The Transportation Services division maintains View Royal’s transportation systems for View Royal’s citizens and visitors through in-house staff and contracted services. This division represents about 18% of the total operating budget, funded primarily by taxation.
| CONCURRENCE: | Initials | Comments |
|---|---|---|
| Chief Administrative Officer | KA | Recommend Approval |
| REVIEWED BY: | Initials |
|---|---|
| Director of Finance | DLC |
| Director of Engineering and Parks | IL |
ATTACHMENTS:
- 2024-2028 Financial Planning Calendar
- Schedule A Operating Revenue
- Schedule B Operating Expense
Document Images
(1)