A presentation from the Capital Regional District (CRD) providing a jurisdictional overview, organizational structure, board priorities, and a detailed 2023 financial requisition for the Town of View Royal.
CRD Region population: 439,950 (2022)Jurisdiction includes 13 Member Municipalities, 3 Electoral Areas, and 11 First Nations with ReservesCRD 2023 Operating Budget: $398MCRD 2023 Capital Budget: $292MTown of View Royal 2023 Total Requisition: $2,289,000 (a 3.9% increase from 2022)Cost per household for View Royal: $482.02 (approx. $1.32 per day)View Royal Requisition breakdown: Hospital District (28%), Debt Service (23%), Regional Parks (17%), Other (15%), Leg & Gen (12%), and Arts & Grants (5%)
Jurisdictional Overview
Municipalities
CRD
Province
• Police services
Regional
• Provincial parks
• Local roads
• Regional Emergency Program
• Highways and ferries
• Local planning and development
• Solid Waste & Recycling
• Healthcare and Hospitals
• Animal control
• Housing
• Homelessness
• Trees
• Parks & Trails
• Groundwater
• Building regulations
• Climate Action
• BC Building Code
• Business regulation
• Regional Planning
• Education
• Public spaces
Sub-regional
• Driver’s licenses
• Other services specific to each municipality
• Fire Dispatch
• Gaming
• Water Supply & Wastewater
• Landlord tenant relations
• Recreation, Arts & Culture
• Property Assessments
• Animal Care
• Liquor laws
Electoral Area
• Fire Protection
• Building Inspection
• Grants-in-Aid
• Water & Wastewater
• Other bespoke local services
Page 22–38
Capital Regional District
Page 22–38
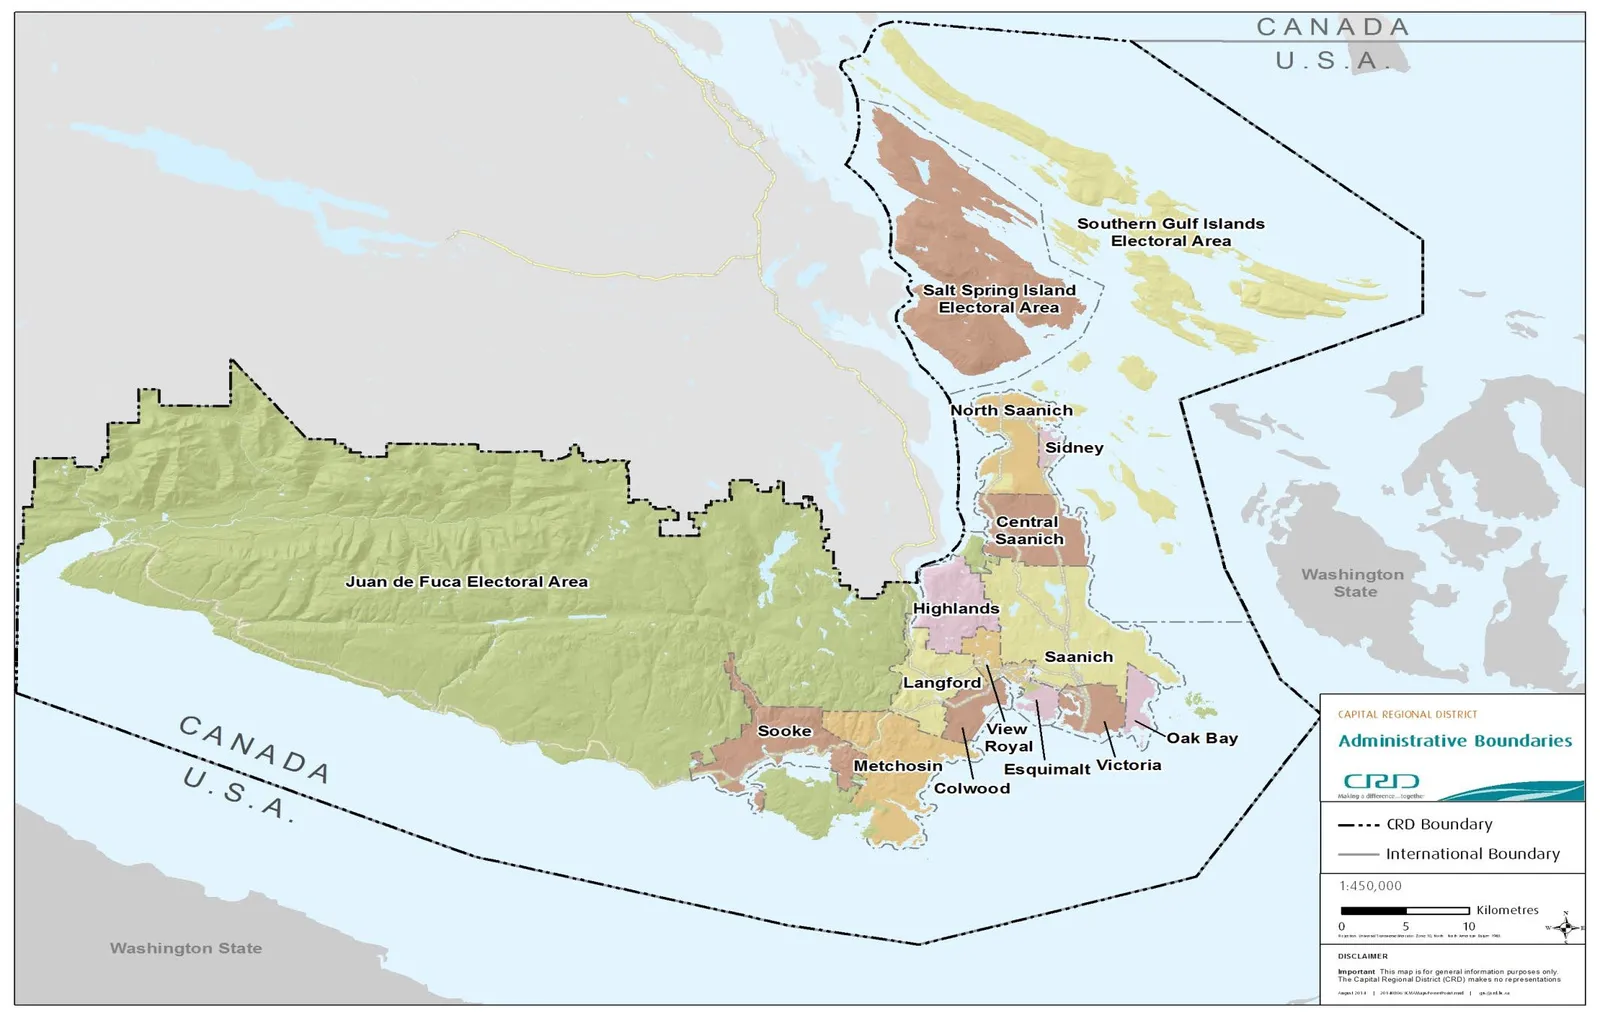
The Region
237,000 ha. including 70 Islands
13 Member Municipalities
3 Electoral Areas
11 First Nations with Reserves
Population 439,950 (2022)
Map of administrative boundaries
Page 22–38
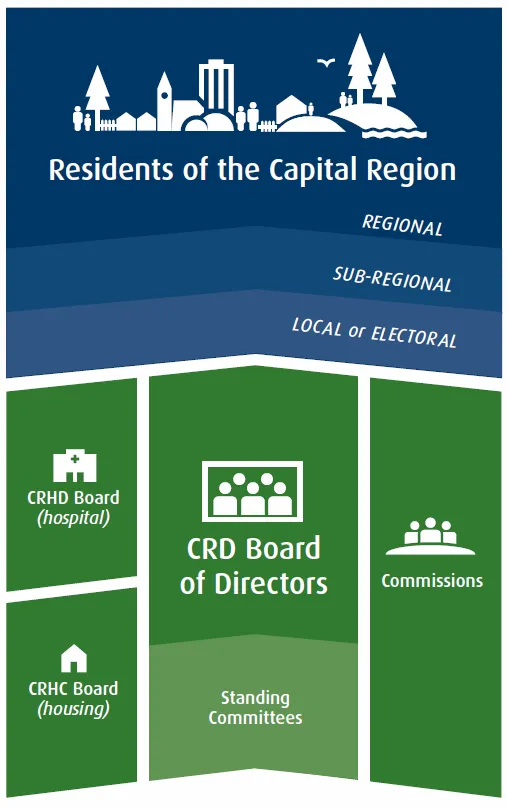
Our Structure
Governance
Governance structure diagram
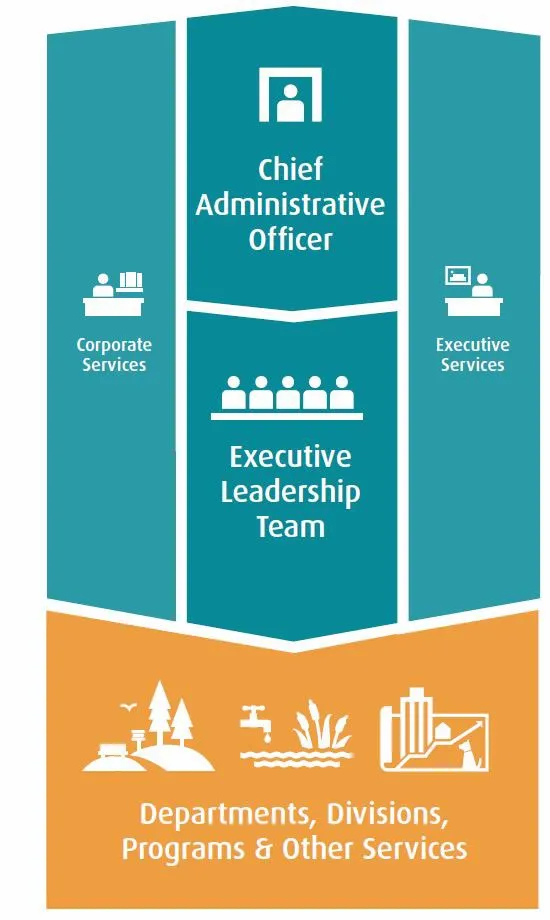
Administration
Administration structure diagram
Page 22–38
Board of Directors
Group photo of Board of Directors
Directors
Marianne ALTO, Victoria
Paul BRENT, Southern Gulf Islands EA
Susan BRICE, Saanich
Judy BROWNOFF, Saanich
Jeremy CARADONNA, Victoria
Chris COLEMAN, Victoria
Zac DE VRIES, Saanich
Barbara DESJARDINS, Esquimalt
Scott GOODMANSON, Langford
Gary HOLMAN, Salt Spring Island EA
Peter JONES, North Saanich
Doug KOBAYASHI, Colwood
Marie-Térèse LITTLE, Metchosin
Cliff MCNEIL-SMITH, Sidney
Kevin MURDOCH, Oak Bay
Dean MURDOCK, Saanich
Colin PLANT, Saanich
Lillian SZPAK, Langford
Dave THOMPSON, Victoria
Sid TOBIAS, View Royal
Maja TAIT, Sooke
Al WICKHEIM, Juan de Fuca EA
Ken WILLIAMS, Highlands
Ryan WINDSOR, Central Saanich
CRD
Chair Colin PLANT, Saanich
Vice-Chair Maja TAIT, Sooke
CRHC
Chair Zac DE VRIES, Saanich
Vice-Chair Maja TAIT, Sooke
CRHD
Chair Kevin MURDOCH, Oak Bay
Acting Chair Cliff MCNEIL-SMITH, Sidney
Page 22–38
Board Priorities
TransportationTransportation icon
Residents have access to convenient, green and affordable multi-modal transportation systems that enhance livability
HousingHousing icon
Residents have access to affordable housing that enhances livability
Climate Action & EnvironmentClimate Action & Environment icon
Progress on adaptation, reduced greenhouse gas emissions and triple-bottom line solutions that consider social, environmental and economic impacts
First NationsFirst Nations icon
Strong relationships with First Nations based on trust and mutual respect, partnerships and working together on shared goals
GovernanceGovernance icon
Effective advocacy, coordinated and collaborative governance, and leadership in organizational performance and service delivery
Page 22–38
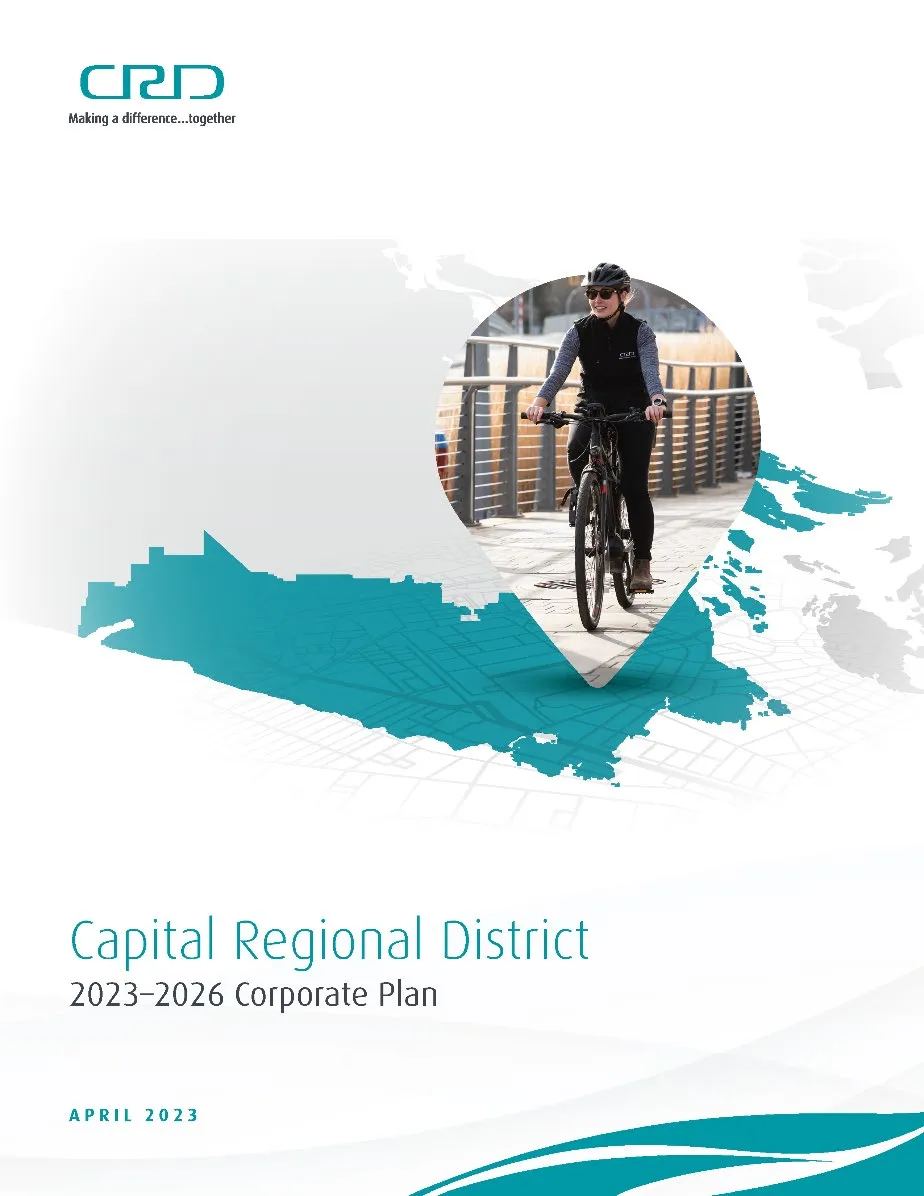
2023 – 2026 Corporate Plan
Corporate Plan cover
Community Needs
Utility Services
Community Services
Corporate Services
Government Relations
Local Government
Page 22–38
CRD Services & Financials
Page 22–38
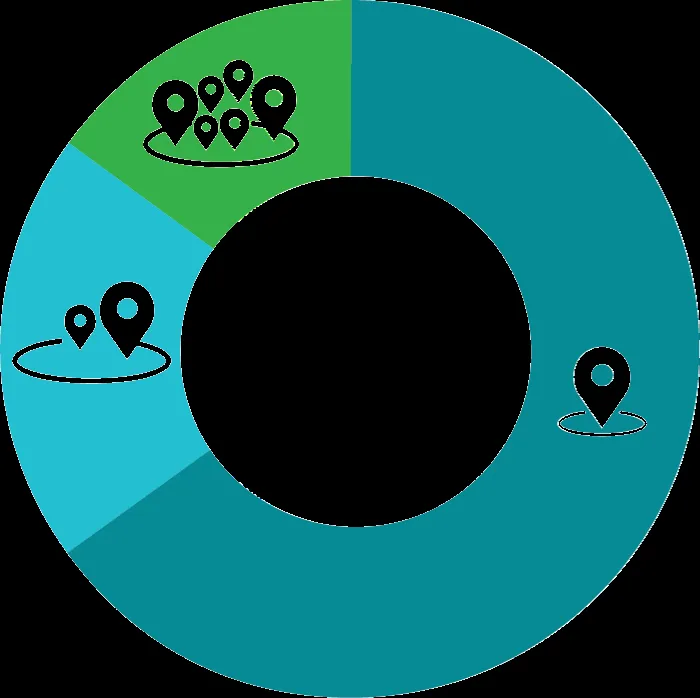
Distribution of Services
Distribution of Services chart
Regional: 15% of services, 55% of budget
Sub-Regional: 20% of services, 35% of budget
Local: 65% of services, 10% of budget
200+ Services
Page 22–38
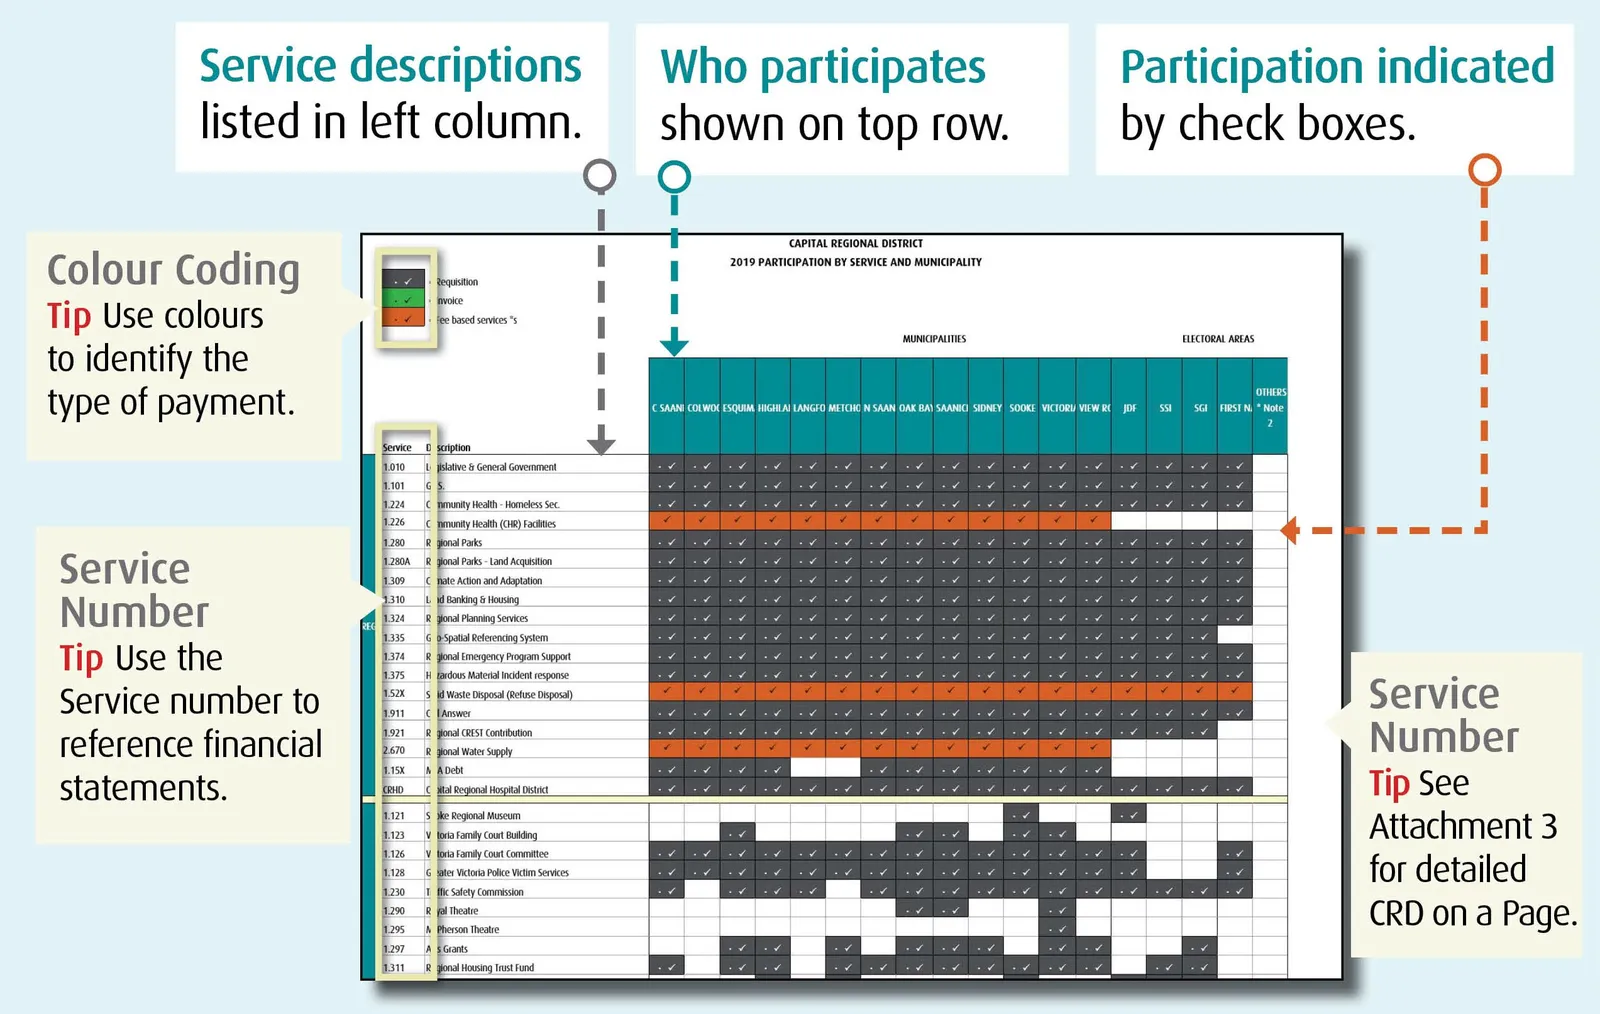
Get to know ‘CRD on a page’
CRD on a page guide
Service descriptions listed in left column.
Who participates shown on top row.
Participation indicated by check boxes.
Colour Coding Tip: Use colours to identify the type of payment.
Service Number Tip: Use the service number to reference financial statements.
Service Number Tip: See Attachment 3 for detailed CRD on a Page.
Page 22–38
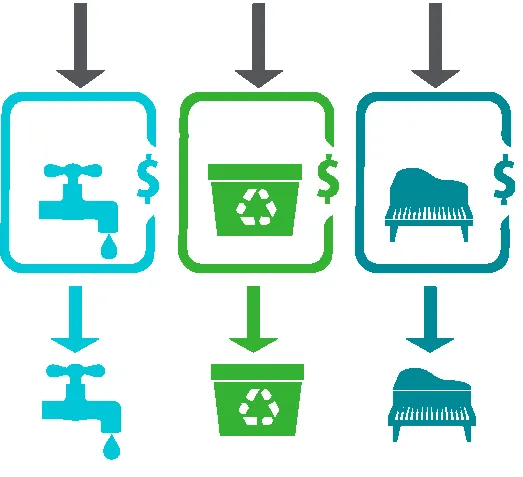
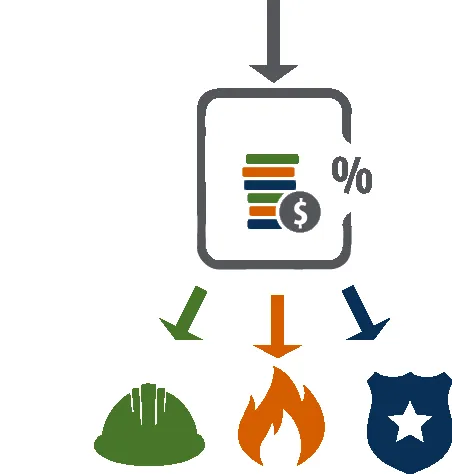
Budget Comparison
REGIONAL DELIVERY
Water Sales | Tipping Fees | Requisition
Regional Delivery icons
Water Service | Recycling Service | Arts & Culture Service
VS
MUNICIPAL DELIVERY
Tax
Municipal Delivery icons
Service | Service | Service
Page 22–38
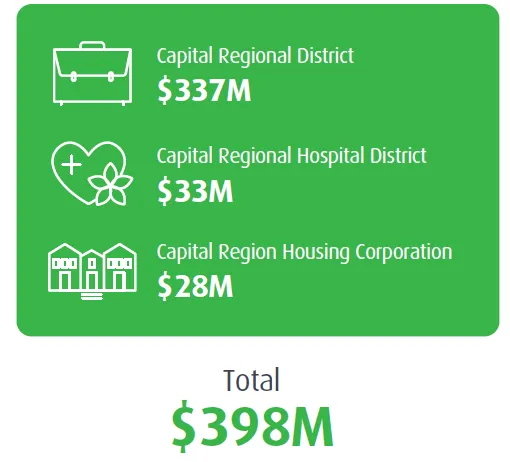
Consolidated Financial Budget 2023
OPERATING
Operating Budget summary
* Capital Regional District: $337M
* Capital Regional Hospital District: $33M
* Capital Region Housing Corporation: $28M
* **Total: $398M**
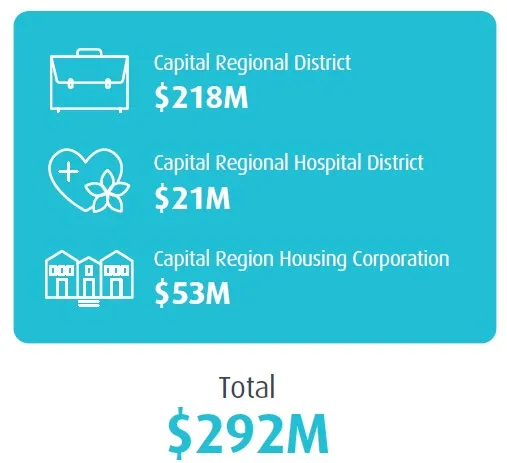
CAPITAL
Capital Budget summary
* Capital Regional District: $218M
* Capital Regional Hospital District: $21M
* Capital Region Housing Corporation: $53M
* **Total: $292M**
Page 22–38
Requisition by participant 2023
Column labels
**A + B = C D E**
Municipalities & EAs
A: Impact of Cost Apportionment
B: All Other CRD
C: CRD Final (Base)
D: CRD, CRHD & Municipal Debt (Base)
E: Cost per HH CRD & CRHD & Muni Debt
Central Saanich
0.0%
3.1%
3.1%
2.4%
3.1%
Colwood
3.7%
3.8%
7.5%
3.4%
(1.4%)
Esquimalt
0.5%
12.5%
13.0%
4.2%
2.9%
Highlands
(1.1%)
2.1%
1.0%
1.0%
2.1%
Langford
1.8%
5.0%
6.8%
6.3%
3.4%
Metchosin
1.2%
5.0%
6.2%
3.7%
3.5%
North Saanich
0.4%
3.1%
3.5%
5.6%
5.1%
Oak Bay
0.0%
0.0%
0.0%
(0.7%)
(0.6%)
Saanich
(0.3%)
5.2%
4.9%
4.6%
4.6%
Sidney
1.3%
2.5%
3.8%
3.0%
(1.3%)
Sooke
0.5%
3.5%
4.0%
3.7%
0.8%
Victoria
(2.5%)
4.9%
2.4%
(0.9%)
0.1%
View Royal
2.1%
5.4%
7.5%
3.9%
3.2%
Juan de Fuca
(0.1%)
4.6%
4.5%
3.6%
2.0%
Salt Spring Island
(0.4%)
6.8%
6.4%
5.6%
5.9%
Southern Gulf Islands
0.9%
3.6%
4.5%
3.7%
3.8%
Total
-
5.1%
5.1%
3.4%
2.8%
Page 22–38
2023 Municipal Requisition
Town of View Royal
2023 (in thousands)
2022 (in thousands)
%
Cost per HH
%
CRD Requisition
$1,126
$1,047
7.5%
$237.13
6.8%
CRHD Requisition
$630
$623
1.1%
$132.72
0.5%
MFA Municipal Debt
$533
$533
0.0%
$112.18
(0.7%)
Total Requisition
$2,289
$2,203
3.9%
$482.02
3.2%
$482.02/HH ($1.32 per day)
Hospital District: 28%
Debt Service - MFA: 23%
Regional Parks: 17%
Other: 15%
Leg & Gen: 12%
Arts & Grants: 5%
Page 22–38
CRD Major Projects
Page 22–38
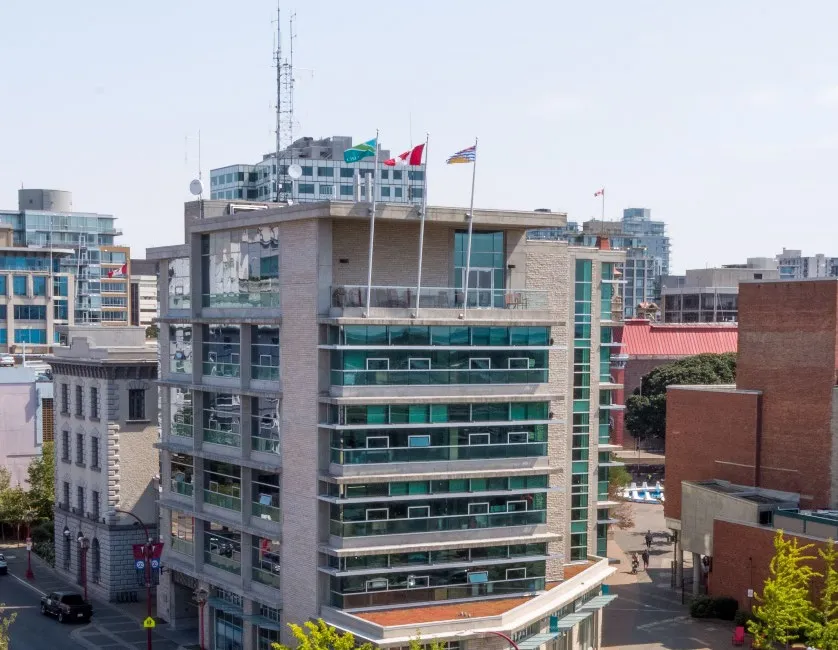
Executive Services
Portrait of Ted Robbins
**Ted Robbins**
Executive Administration
Corporate Communications
Human Resources & Corporate Safety
Salt Spring Island Electoral Area Administration
2023 – 2026 CRD Corporate Plan
Organizational Vision
Employee Experience Survey
Alternative Work Options
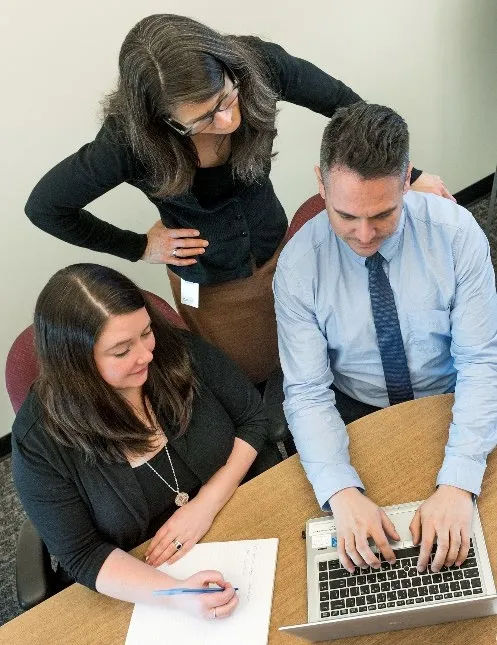
Photo of CRD buildingPhoto of staff working
Page 22–38
Finance and IT Services
Portrait of Nelson Chan
**Nelson Chan**
Financial Services
Information Technology & GIS
Asset Management
Arts & Culture Support Service
Implementation of Corporate Asset Management Strategy and associated policies
Major upgrade and migration of end-of-life corporate Enterprise Resource Management software
Implementation of new Corporate Project Management system
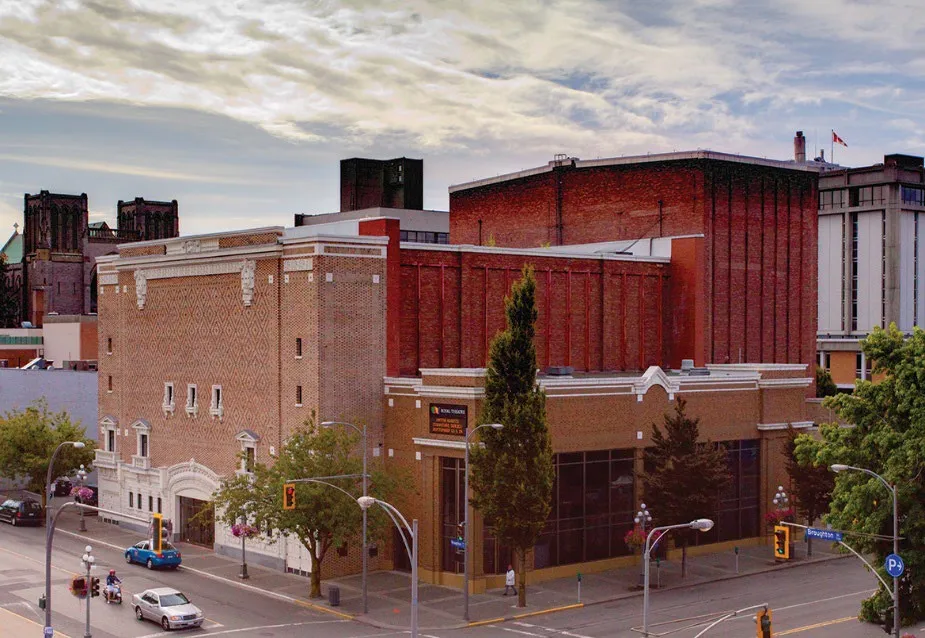
Upgrades and renewals to McPherson Theatre and Royal Theatre
Photo of Royal TheatrePhoto of people jumping off a dock