Appendix A: Stormwater Calculation - Runoff Coefficients and IDF Curve
Technical calculations for stormwater runoff, including pre- and post-development coefficients and rainfall intensity data.
APPENDIX A: STORMWATER CALCULATION - RUNOFF COEFFICIENTS AND IDF CURVE
Underground Utilities Brief | Prepared for Boardwalk REIT 339 / 341 / 345 Island Highway, View Royal, BC
RUNOFF COEFFICIENTS & IDF CURVE
Project Name: 3339 Island Hwy Project File #: 2241-22149 Date: 1/19/2023 Area: View Royal IDF Curve: Victoria Gonzales # 1018611
Calculate Post Development C
| Description of Area | Runoff Coefficients Range | Runoff Coeff Selected | Pre-Development Contributing Area (m²) | Pre-Development C x A | Post Development Contributing Area (m²) | Post Development C x A | Notes / Comments |
|---|---|---|---|---|---|---|---|
| Business | |||||||
| Downtown Areas | 0.70 - 0.95 | 0 | 0 | ||||
| Neighborhood Areas | 0.50 - 0.70 | 0 | 0 | ||||
| Residential | |||||||
| single family areas | 0.30 - 0.50 | 0 | 0 | ||||
| multiunits, detached | 0.40 - 0.60 | 0 | 0 | ||||
| multiunits, attached | 0.60 - 0.75 | 0 | 0 | ||||
| Residential (suburban) | 0.25 - 0.40 | 0 | 0 | ||||
| Apartment dwelling areas | 0.50 - 0.70 | 0 | 0 | ||||
| Industrial | |||||||
| light areas | 0.50 - 0.80 | 0 | 0 | ||||
| heavy areas | 0.60 - 0.90 | 0 | 0 | ||||
| Parks, cemeteries | 0.10 - 0.25 | 0 | 0 | ||||
| Playgrounds | 0.20 - 0.35 | 0 | 0 | ||||
| Railroad yard areas | 0.20 - 0.40 | 0 | 0 | ||||
| Unimproved areas | 0.10 - 0.30 | 0 | 0 | ||||
| Streets | |||||||
| Asphaltic | 0.70 - 0.95 | 0.95 | 2385 | 2266 | 2820 | 2679 | as/conc/dw/sw |
| Concrete | 0.80 - 0.95 | 0 | 0 | ||||
| Brick | 0.70 - 0.85 | 0 | 0 | ||||
| Gravel (from LEED) | 0.75 | 0 | 0 | ||||
| Drives and walks | 0.75 - 0.85 | 0 | 0 | ||||
| Roofs | 0.75 - 0.95 | 0.95 | 1205 | 1145 | 4250 | 4038 | |
| Lawns, sandy soil | |||||||
| Flat, < 2% | 0.05 - 0.10 | 0 | 0 | ||||
| Average, 2-7% | 0.10 - 0.15 | 0 | 0 | ||||
| steep, > 7% | 0.15 - 0.20 | 0.15 | 3150 | 473 | 0 | ex. Steep lawns 10% | |
| Lawns, heavy soil | |||||||
| Flat, < 2% | 0.13 - 0.17 | 0 | 0 | ||||
| Average, 2-7% | 0.18 - 0.22 | 0 | 0 | ||||
| steep, > 7% | 0.25 - 0.32 | 0.50 | 0 | 5150 | 2575 | landscape above parkade, limit infil. | |
| **MoTI Section 1020 | |||||||
| Mnt >30% (imp, for, rur, Urb) | 1.00-0.90-x-x | 0 | 0 | ||||
| Steep 20-30% (imp, for, rur, Urb) | 0.95-0.80-x-x | 0 | 0 | ||||
| Mod 10-20% (imp, for, rur, Urb) | 0.90-0.65-0.75-0.85 | 0 | 0 | ||||
| Roll 5-10% (imp, for, rur, Urb) | 0.85-0.50-0.65-0.80 | 0.45 | 5480 | 2466 | 0 | ex. Forested varies up to 15% | |
| flat <5% (imp, for, rur, Urb) | 0.80-0.40-0.55-0.75 | 0 | 0 | ||||
| 0 | 0 | ||||||
| 0 | 0 |
Contributing Area (ha) = 1.22200 (Pre-Development), 1.22200 (Post Development) Pre-Dev C = 0.520 Post-Dev C = 0.760 pre vs post areas match
*Table from "Water Supply and Pollution Control, Seventh Edition, Viessman & Hammer" **See also MoT Section 1020, Supplement to TAC Geometric Guide, Table 1020.A
Rainfall Intensity Interpolation Eq Weather Station: Victoria Gonzales # 1018611
I = aT^b where i in mm/hr, T in h
| 2 year | 5 year | 10 year | 25 year | 50 year | 100 year | |
|---|---|---|---|---|---|---|
| Coefficient (A) | 7.6 | 10.2 | 11.8 | 13.9 | 15.5 | 17 |
| Exponent (B) | -0.418 | -0.422 | -0.423 | -0.425 | -0.425 | -0.426 |
| 24hr rate (mm/day) | 48 | 64 | 74 | 86 | 96 | 105 |
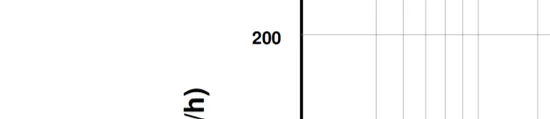
Short Duration Rainfall Intensity-Duration-Frequency Data
Données sur l’intensité, la durée et la fréquence des chutes de pluie de courte durée
VICTORIA GONZALES CS BC 1018611
1925 - 2021 69 years / ans
Latitude: 48° 25'N Longitude: 123° 19'W
Elevation / Altitude: 61 m
Intensity (mm/h) / Intensité (mm/h)
Duration / Durée Minutes / Hours / Heures
Return Periods / Périodes de retour (Years / ans) 100, 50, 25, 10, 5, 2
Graph Grid Details
Document Images
(29)
Title text segment
Title text segment
Date and partial title 2022/10/31
Weather station name and ID number
Data record period and length
Geographic coordinates
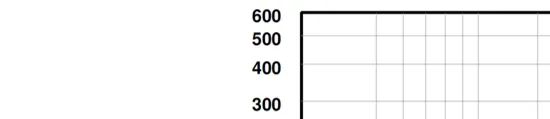
Intensity axis upper scale 300-600
Intensity axis value 200
Intensity axis mid scale 40-100
Log-log data plot showing rainfall intensity curves
Intensity axis values 5-10
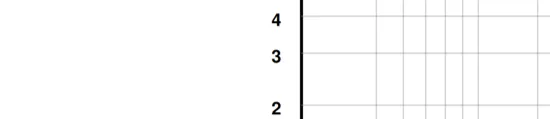
Intensity axis values 2-4
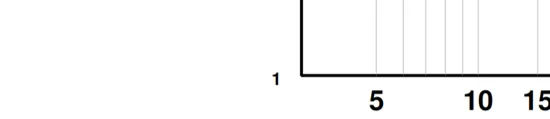
Intensity axis base value 1 and duration axis start 5-10
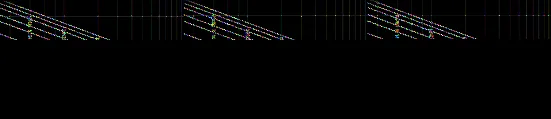
Segment of the IDF curve data plot
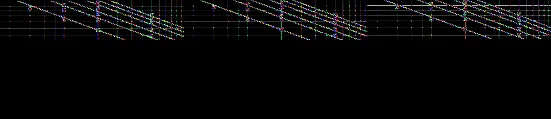
Segment of the IDF curve data plot
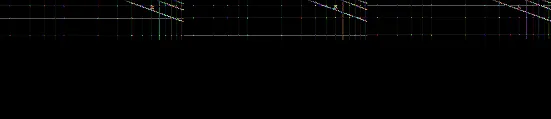
Segment of the IDF curve data plot
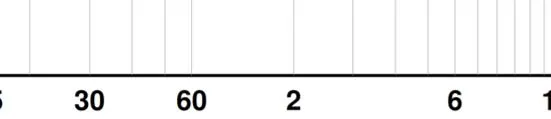
Duration axis values 30, 60 minutes and 2, 6 hours
Duration axis label
Duration axis values 12 and 24 hours
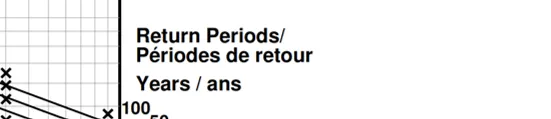
Return period legend header and 100-year curve indicator
Legend for 2 to 50 year return periods
Chart grid segment
Chart grid segment
Chart grid segment

Chart grid segment