339 / 341 / 345 ISLAND HIGHWAY Traffic Impact Assessment
A draft Traffic Impact Assessment (TIA) report by Watt Consulting Group evaluating the traffic effects of a proposed 260-unit multi-family residential development.
339 / 341 / 345 ISLAND HIGHWAY
Traffic Impact Assessment
MJ Oh – Transportation Technologist Author
Andy Kading, P.Eng., P.E. – Transportation Engineer Reviewer
WATT VICTORIA #302, 740 Hillside Avenue Victoria, BC V8T 1Z4 (250) 388-9877
Prepared For: Boardwalk REIT Date: 28 November 2022 Our File No: 3425.B01
TABLE OF CONTENTS
1.0 INTRODUCTION ................................................................................................... 1 1.1 Study Area ..................................................................................................................... 1
2.0 EXISTING CONDITIONS ..................................................................................... 2 2.1 Land Use ......................................................................................................................... 2 2.2 Road Network ............................................................................................................... 2 2.3 Traffic Volumes ............................................................................................................. 3 2.4 Traffic Modelling – Background Information ....................................................... 4 2.5 2022 Existing Traffic Conditions ............................................................................. 5
3.0 POST DEVELOPMENT ........................................................................................ 6 3.1 Proposed Land Use ..................................................................................................... 6 3.2 Site Access ..................................................................................................................... 6 3.3 Trip Generation ............................................................................................................. 7 3.4 Trip Assignment ........................................................................................................... 8 3.5 2025 Opening Day Background Conditions ....................................................... 9 3.6 Opening Day Post Development Conditions ................................................... 11
4.0 2035 10-YEAR HORIZON TRAFFIC CONDITIONS .................................... 13 4.1 2035 Background Conditions ............................................................................... 14 4.2 2035 Post Development Analysis Results ........................................................ 15
5.0 OPERATIONAL CONSIDERATIONS .............................................................. 17 5.1 Signal Warrant Review ........................................................................................... 17 5.2 Improvements for Island Highway / Prince Robert Drive ............................. 18 5.3 Left Turn Lane ............................................................................................................ 19 5.4 FEASIBILITY Review of On-street Parking ....................................................... 20 5.5 Vehicle Turning Movement Review .................................................................... 21
6.0 ACTIVE TRANSPORTATION ........................................................................... 22 6.1 Pedestrians and Cycling Facilities ....................................................................... 22 6.2 Transit ........................................................................................................................... 23
7.0 CONCLUSION ..................................................................................................... 23
8.0 RECOMMENDED IMPROVEMENTS ............................................................... 24
APPENDICES Appendix A: Synchro Information
LIST OF FIGURES
Figure 1: Study Area and Site Location ............................................................................................. 1 Figure 2: 2022 Existing Volumes ........................................................................................................ 4 Figure 3: Site Plan and Access ............................................................................................................. 7 Figure 4: Trip Assignment ..................................................................................................................... 9 Figure 5: 2025 Opening Day Background Volumes ................................................................... 11 Figure 6: Opening Day Post Development Volumes .................................................................. 13 Figure 7: 2035 Ten-year Horizon Background Volumes .......................................................... 13 Figure 9: Left Turn Lane Warrant Review ..................................................................................... 20 Figure 10: Vehicle Turning Movement Review ............................................................................ 22
LIST OF TABLES
Table 1: 2022 Existing Conditions ...................................................................................................... 6 Table 2: Peak Hour Trip Generation Rates ....................................................................................... 8 Table 3: Estimated Development Trips .............................................................................................. 8 Table 4: Distribution Percentages of Site Trips .............................................................................. 8 Table 5: 2025 Opening Day Background Conditions ................................................................ 10 Table 6: 2025 Opening Day Post Development Conditions .................................................... 12 Table 7: 2035 Background Conditions ........................................................................................... 14 Table 8: 2035 Post Development Conditions ............................................................................... 16 Figure 8: 2035 Post Development Volumes ................................................................................. 17
1.0 INTRODUCTION
Watt Consulting Group was retained by Boardwalk REIT to conduct a traffic impact assessment for a proposed residential development at 339, 341, and 345 Island Highway in the Town of View Royal. This study assesses traffic impacts of the proposed multi-family residential buildings, reviews the site access, and assesses the need for any mitigation measures. The study reviews the existing traffic operations along with the post development and long-term conditions for all modes of transportation.
1.1 STUDY AREA
See Figure 1 for the study area and location. The study area includes the following intersections:
- Island Highway / Prince Robert Drive
- Island Highway / Burnett Road
- Island Highway / Jedburgh Road
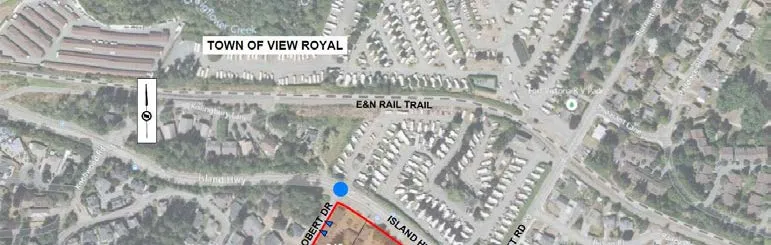
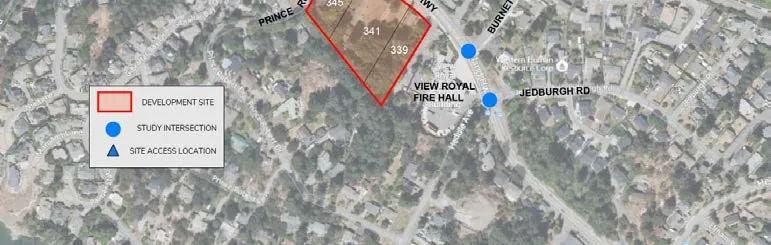
Figure 1: Study Area and Site Location
2.0 EXISTING CONDITIONS
2.1 LAND USE
The proposed development site is composed of three residential lots (339 / 341 / 345 Island Highway) and the existing land use is multi-family residential rental units. The surrounding area of the development is mostly residential along Island Highway and Prince Robert Drive. The View Royal Fire Department buildings were recently constructed just east of the proposed site on Island Highway. To the north, across from the development, there is the Fort Victoria RV Park.
2.2 ROAD NETWORK
The proposed development is located on the south side of Island Highway between Prince Robert Drive and View Royal Fire Department. Island Highway is under the jurisdiction of the Ministry of Transportation and Infrastructure. Burnett Road and Jedburgh Road are under the jurisdiction of the Town of View Royal. All roads within the study area have a maximum speed limit of 50 km/h. A description of all relevant roads in the area is provided below.
Island Highway is a two-lane highway with a functional classification as a Major Road. There are many private property accesses present, and the turning movements associated with them cause conflict and delay along the corridor. There are bike lanes on both sides, but limited sidewalks along most of the roadway (new sidewalk installed along the View Royal Fire Department frontage).
Prince Robert Drive is a two-lane local road (site access road), which faces the west side of the development. There is no sidewalk and limited shoulders provided along the roadway.
The intersection of Island Highway / Prince Robert Drive is stop-controlled with no separate turn lanes. Sight distance for northbound left turning traffic (looking to the left along the highway) from Prince Robert Drive is limited due to the horizontal curvature and vegetation.
Burnett Road is a two-lane local road connecting to Island Highway from just south of Highway 1 and the Fort Victoria RV Park. At the intersection of Island Highway / Burnett Road, there is a separate eastbound left turn lane in front of the Fire Department. During the AM peak period left turning vehicles (turning from Burnett Road onto Island Highway) were observed finding refuge in the painted median area before merging into the extensive eastbound queues. A new pedestrian activated signal was installed at the Fire Department frontage on Island Highway and the previous pedestrian signal at the bus stops east of Prince Robert Drive was removed.
Jedburgh Road is a two-lane local road providing a connection between Island Highway and Helmcken Road. The intersection at Island Highway is a right-in / right-out access and is spaced just 60m from the Burnett Road intersection.
2.3 TRAFFIC VOLUMES
Traffic counts were undertaken during the AM and PM peak hours on Tuesday November 15, 2022, at three study intersections on Island Highway: Prince Robert Drive, Burnett Road, and Jedburgh Road. 2022 counts were compared to 2021 counts which were undertaken during the COVID-19 pandemic (measured in April 2021), results showed that 2022 measured volumes are 11 % higher for the AM peak hour than 2021 volumes and 4.7% higher for the PM peak hour. The 2022 measured volumes are considered as the normal level before the COVID-19 pandemic. 2022 measured volumes were used for the existing conditions analysis without applying a scaling factor due to the pandemic. However, turning volumes at the side streets were chosen with higher values of 2021 and 2022 counts for a conservative analysis. Figure 2 shows the existing volumes used in this study.
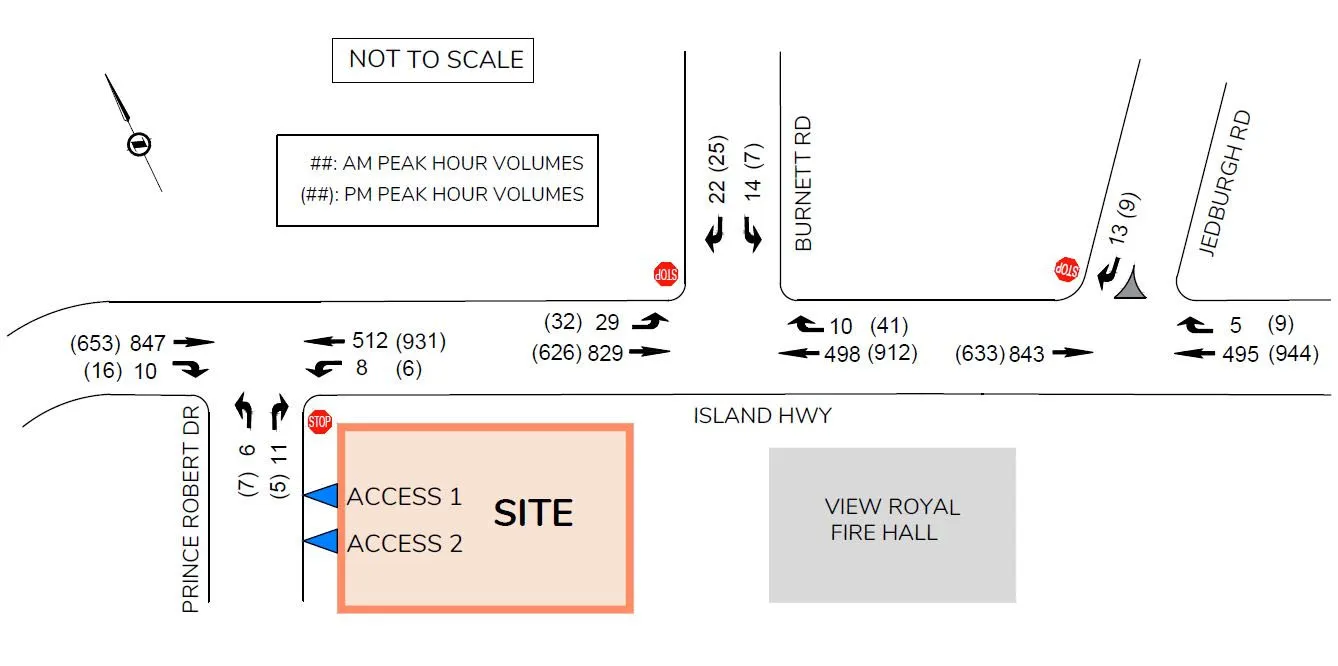
Figure 2: 2022 Existing Volumes
2.4 TRAFFIC MODELLING – BACKGROUND INFORMATION
Analysis of the traffic conditions at the intersections within the study area were undertaken using Synchro traffic analysis software.
Synchro / SimTraffic is a two-part traffic modelling software that provides analysis of traffic conditions based on traffic-control, geometry, volumes, and traffic operations. Synchro software (Synchro 9/10) provides analysis using the Highway Capacity Manual (2010) methodology, while SimTraffic integrates established driver behaviors and characteristics to simulate actual conditions by randomly “seeding” vehicles travelling throughout the network. Outputs of the Synchro software include Level Of Service (LOS), delay (seconds per vehicle), and 95th percentile queue length (in vehicles, assuming 7.5m per vehicle).
LOS is broken down into six letter grades, with LOS A being excellent operations, and LOS F being unstable / failure operations. LOS C is generally considered to be an acceptable LOS by most municipalities. LOS D is generally considered to be on the threshold between acceptable and unacceptable operations. A description of LOS and Synchro is provided in Appendix A.
Volume-to-Capacity ratios are also considered in assessing the roadway network or determining required traffic control improvements. According to the city’s guidelines, for individual movements, the minimum acceptable V/C ratio is 0.95 used as a general threshold for mitigation.
2.5 2022 EXISTING TRAFFIC CONDITIONS
The existing traffic conditions were analyzed at the three study intersections. It was observed that significant congestion occurred, particularly for the Island Highway eastbound in the AM peak hour. At Island Highway / Prince Robert Drive, the stop-controlled northbound movement operates at LOS D in the AM / PM peak hour while movements along Island Highway operate at LOS A/B. The westbound left 95th percentile queue length was estimated at 12m during the AM / PM peak hour. It was observed that the eastbound through traffic (moving slow due to congestion) on Island Highway mostly stopped to yield to westbound left turn vehicles at Prince Robert Drive in the AM peak hour.
At Island Highway / Burnett Road, the stop-controlled southbound movement operates at LOS D in the AM and PM peak hours. The estimated eastbound left queues (15m or less) stay within the existing storage length (20m).
The intersection of Island Highway / Jedburgh Road operates at LOS C or better for all movements in the AM and PM peak hours. See Table 1 for the results of the analysis.
TABLE 1: 2022 EXISTING CONDITIONS
| INTERSECTION | MOVEMENT | AM Peak Hour | PM Peak Hour | ||||||
|---|---|---|---|---|---|---|---|---|---|
| LOS | Delay (s) | v/c Ratio | Queue (m)* | LOS | Delay (s) | v/c Ratio | Queue (m)* | ||
| ISLAND HWY / PRINCE ROBERT DR (EB/WB=ISLAND HWY) | EBTR | A | 0.0 | - | 5.3 | A | 0.0 | - | 2.4 |
| WBLT | B | 10.3 | 0.02 | 11.5 | A | 9.1 | 0.01 | 12.0 | |
| NBLR | D | 29.8 | 0.16 | 12.1 | D | 31.6 | 0.15 | 8.9 | |
| ISLAND HWY / BURNETT RD (EB/WB=ISLAND HWY) | EBL | A | 8.8 | 0.04 | 10.8 (20) | B | 10.5 | 0.07 | 15.2 (20) |
| EBT | A | 0.0 | - | 7.9 | A | 0.0 | - | 4.6 | |
| WBTR | A | 0.0 | - | 4.6 | A | 0.0 | - | 8.3 | |
| SBLR | D | 29.5 | 0.29 | 13.4 | D | 32.7 | 0.28 | 15.8 | |
| ISLAND HWY / JEDBURGH RD (EB/WB=ISLAND HWY) | EBT | A | 0.0 | - | 5.5 | A | 0.0 | - | 9.8 |
| WBTR | A | 0.0 | - | 3.6 | A | 0.0 | - | 11.0 | |
| SBR | B | 12.5 | 0.05 | - | C | 17.9 | 0.04 | - |
*Note: 95th Queues based on SimTraffic results (averaged from five simulation runs); (##) = Existing Storage Length
3.0 POST DEVELOPMENT
3.1 PROPOSED LAND USE
The proposed development is three multi-family residential buildings (mid-rise) with a maximum of 260 dwelling units. See Figure 3 for the site plan and access.
3.2 SITE ACCESS
The existing site (3 lots) currently has driveways that connect to Island Highway. For the new development, the two proposed accesses are located on Prince Robert Drive, 35 m and 45 m south of Island Highway, while the current accesses onto Island Highway would be closed. The proposed access locations satisfy the Transportation Association of Canada (TAC) suggested minimum corner clearance (15m) to an access at stop-controlled major intersections for local roads. It is assumed that all site trips use the intersection of Island Highway / Prince Robert Drive for entering / exiting.
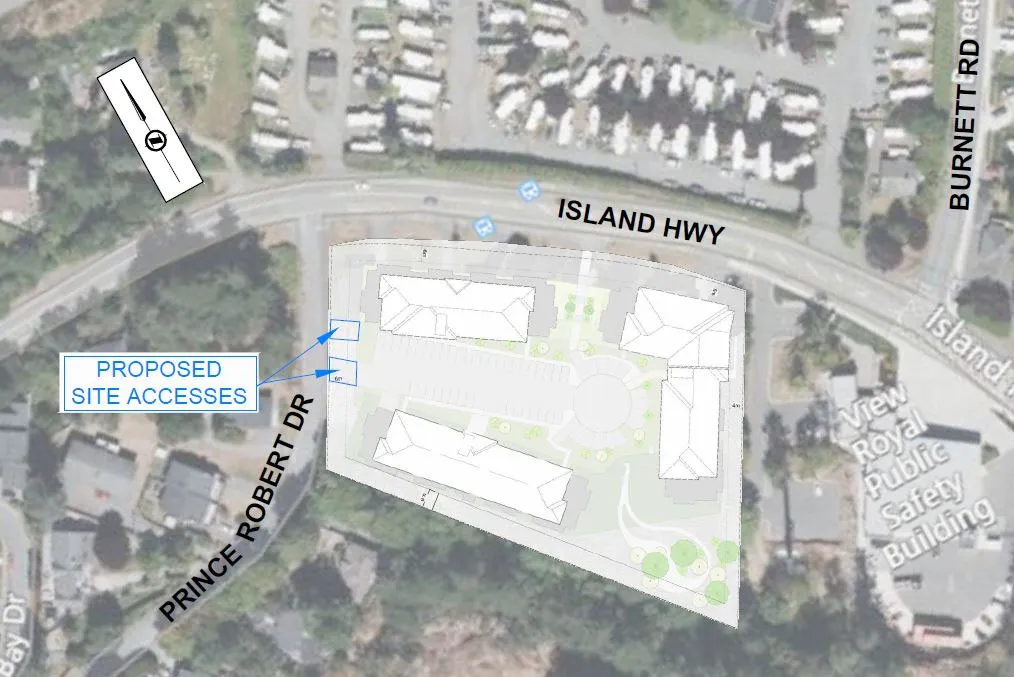
Figure 3: Site Plan and Access
3.3 TRIP GENERATION
Trip generation rates were estimated using the 10th Edition of the ITE Trip Generation Manual. Trip generation rates for the weekday AM and PM peak hours are shown in Table 2.
Table 3 shows the estimated trips generated by the proposed development of multi-family residential use (mid-rise buildings). The development is expected to generate a net 96 weekday AM peak hour trips, and 101 weekday PM peak hour trips. These estimated vehicle trips are considered conservative, as the existing site trips were not deducted from the opening day background volumes.
Document Images
(11)