Municipal Sponsor Report - 2020 Greater Victoria Go by Bike Week
Post-event report summarizing participation data and community impacts of the 2020 Go by Bike Week.
Municipal Sponsor Report
2020 Greater Victoria Go by Bike Week
OVERVIEW
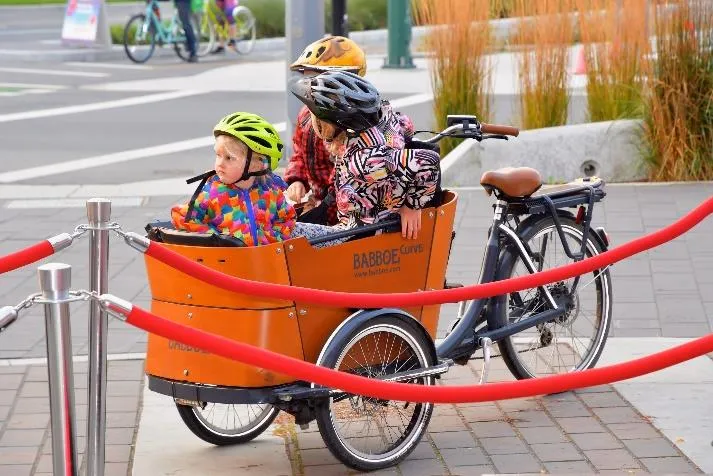
Spring 2020 was the first time in 26 years that Greater Victoria’s Bike to Work Week was postponed. However, we still had the opportunity to host an engaging, safe, and successful “Go by Bike Week” in the fall. Go by Bike Week introduced new activities, new riders, the inclusion of family teams and recreational rides, with the same focus of promoting active transportation and encouraging folks to give cycling a try.
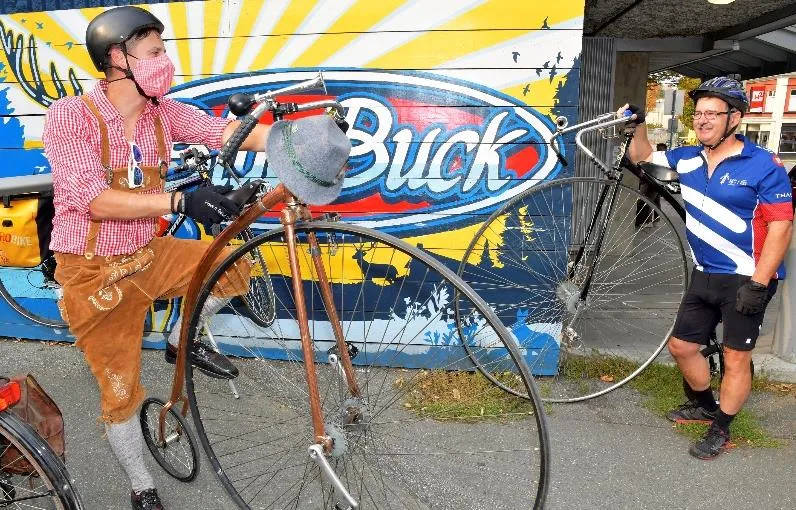
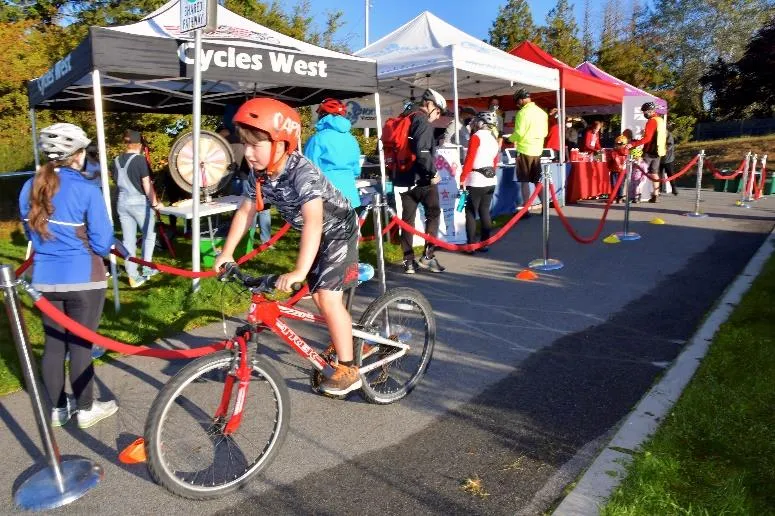
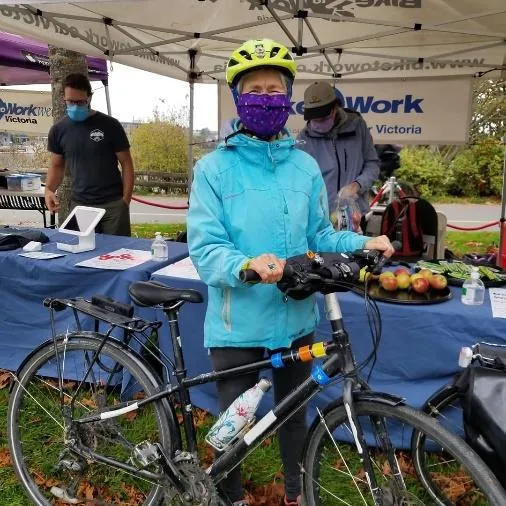
This year’s Go by Bike Week featured Celebration Stations, fun challenges, and activities throughout the region, providing many opportunities for residents of all thirteen municipalities in Greater Victoria to access the week’s events. Despite shifting focus away from in-person events, between September 28th and October 4th we still recorded over 2,000 visits to our physically-distanced Celebration Stations at 13 locations throughout the region.
An overview of the impact of Go by Bike Week in your community is outlined in this report.
EVENT IMPACT
This year was the 26th anniversary of Bike to Work Week in Greater Victoria, and the first under the new name “Go by Bike Week.” With so many folks working from home or otherwise not taking part in their regular commute, we adapted the event to include families, recreational rides, in addition to commuters. This free event offered a chance to capitalize on the current “bike boom” by introducing new riders to cycling while offering all participants a fun event during a challenging year. Each year, we are moved by the testimonials shared by event participants about the impact Go by Bike Week has on them.
“This event definitely got me back into cycling. I used to cycle everywhere, but stopped once I got my driver’s license. Now, at 53, I am riding again and loving it! Feeling better about my health, my reduced impact on the environment, and having fun every time I ride.”
“GBBW was wildly satisfying in so many ways. Having moved to Vancouver Island this summer, I had the chance to explore new trails and challenge myself with a 45km round trip commute. As a Team Leader at work, I took the opportunity to organize a team ride to a local lunch spot, reach out to colleagues, and integrate it into my work as a climate change professional. As a new employee, it was a chance to get to know folks and strike up conversations.”
“Go by Bike Week made a big difference in my mood because I had a purpose and something fun to pursue. It also provided motivation to move my body. I really appreciated the smiles and friendliness of the regular volunteers (some of whom started to recognize me).”
“COVID really put a damper on my 2020. I commute and recreationally ride nearly every day, but this year’s Go by Bike Week was a real boost to my personal morale as I went to every Celebration Station...each one was a little goal that even COVID couldn’t ruin.”
“This year, my 6 year old daughter was really inspired by logging her rides. Going to a celebration station and collecting stickers got her really excited about going on “long rides”. She wanted to keep tracking her cycling all year! Thanks for putting on this event that brings people together around active transportation.”
COMMUNITY BENEFIT
By encouraging people to commute by bike, Go by Bike Week contributes to more active, healthy and vibrant communities. Benefits to the community, its residents, and businesses include:
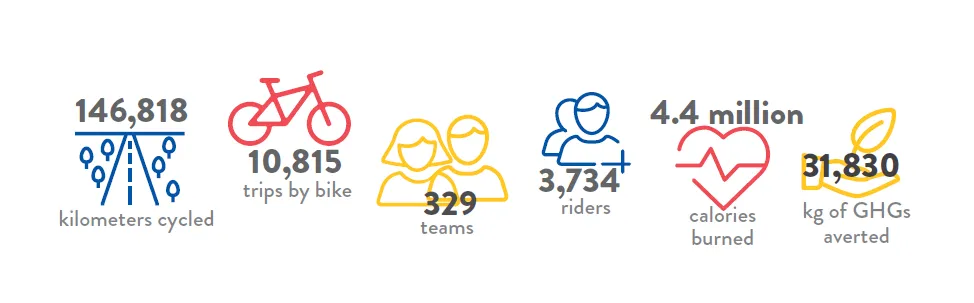
- Healthier people: more than 4 million calories burned by Go by Bike Week participants. Cycling to work improves cardio-vascular and aerobic fitness, boosts energy, builds muscle, and improves coordination. Bike commuters have lower incidence of high blood pressure, obesity, high cholesterol, and diabetes. Long-term health benefits are staggering and include lowered risk of heart disease and cancer.
- Happier people: cycling to work reduces stress, can reduce anxiety and symptoms of depression, improves sleep, boosts self-confidence, and improves mood. Cycling is an especially important tool for folks working from home to maintain their mental health.
- Improved air quality: measured approximately 32,000 kilograms of averted greenhouse gas emissions during Go by Bike Week.
- Reduced congestion: thousands of people on bikes rather than single occupancy vehicles clogging roadways during peak commuting hours; increased use of active travel infrastructure.
- Productive workforce: bike commuters feel less stressed, take fewer sick days, and are more productive at work.
- Connected communities: bike commuters experience the sights, smells, and sounds of their communities and engage with their surroundings. With physical distancing in place, we were able to instill a sense of community in participants both old and new.

PATICIPANT DEMOGRAPHICS

PARTICIPANT HOUSEHOLD INCOME
HIGHEST LEVEL OF EDUCATION COMPLETED
VIEW ROYAL-GBBW PARTICIPATION
View Royal residents make up approximately 3% of overall participants on teams throughout the region – approximately 120 View Royal residents participated in the 2020 Greater Victoria Go by Bike Week. 11 teams from organizations or workplaces based in View Royal registered for the event.
Though overall participation was down due to COVID-19, riders this year were, on average, more engaged than previously. With your generous contribution of $500 towards our program, we were able to produce the following results in your community:
- 120 registered participants
- 586 trips logged
- 10,183 kms ridden
- 2204 kilos of GHG emissions averted
- 305,539 calories burned
PUBLIC ENGAGEMENT
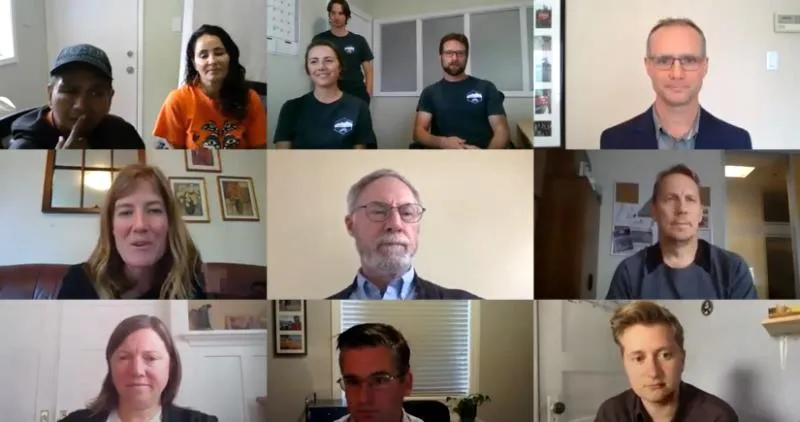
Go by Bike Week E-Launch – September 15th
- Annual event to kick-off the countdown to Go by Bike Week, held two weeks prior to Go by Bike Week.
- Held over Zoom and broadcast on Facebook Live for physical distancing.
- Engaged community groups, local politicians, indigenous leaders, and lgbtq+ groups.
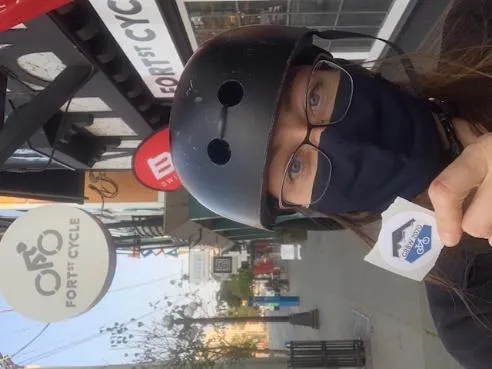
Sticker Challenge – Across Greater Victoria during Go by Bike Week
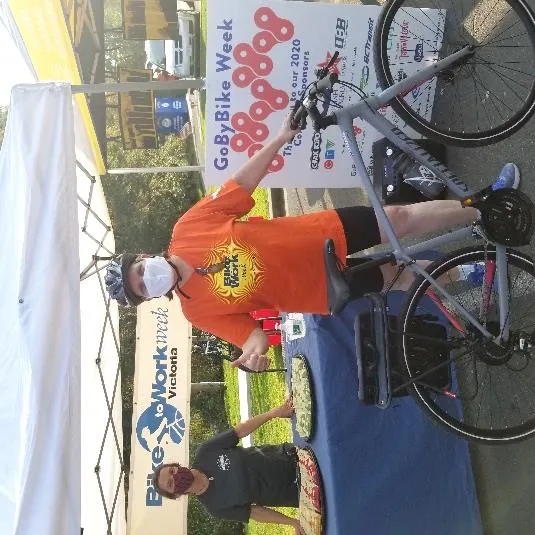
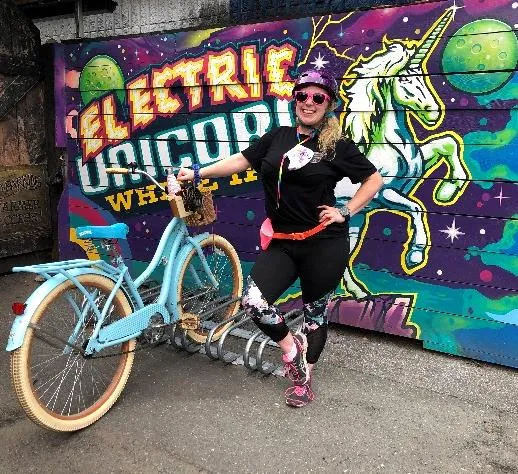
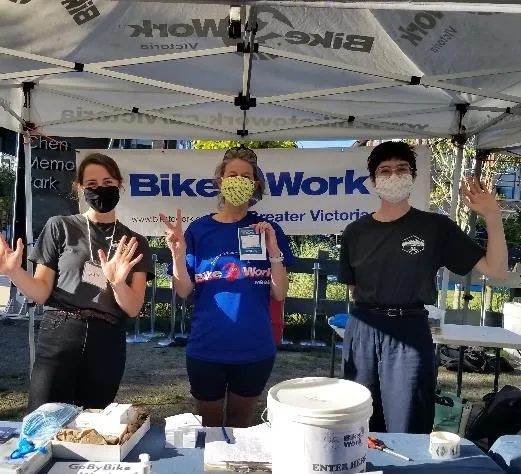
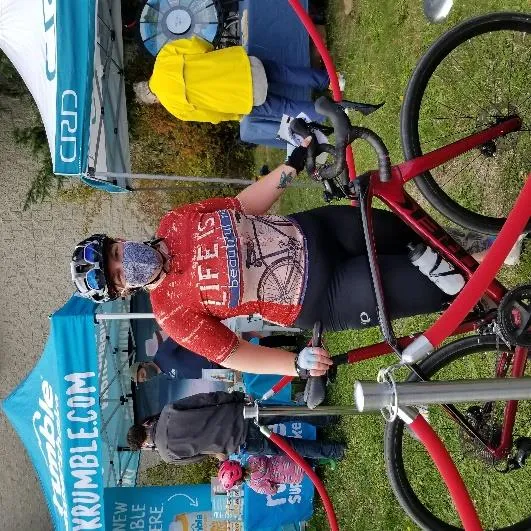
- Brand new event designed to support local businesses and offer a fun, socially distanced, activity.
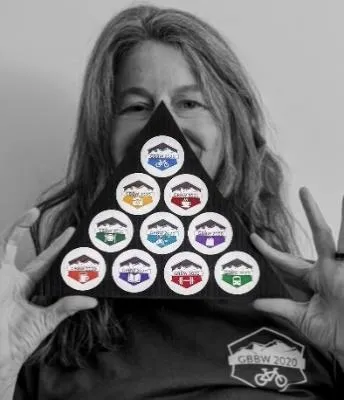
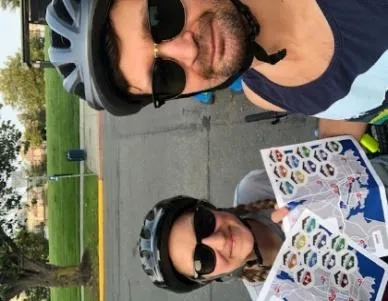
- Participants were challenged to collect different types of stickers from a diverse array of local businesses and support those businesses.
- Engaged 40 businesses across Greater Victoria, over 200 participants completed the Challenge.
Celebration Stations – Sept. 28th-Oct. 4th, throughout Greater Victoria
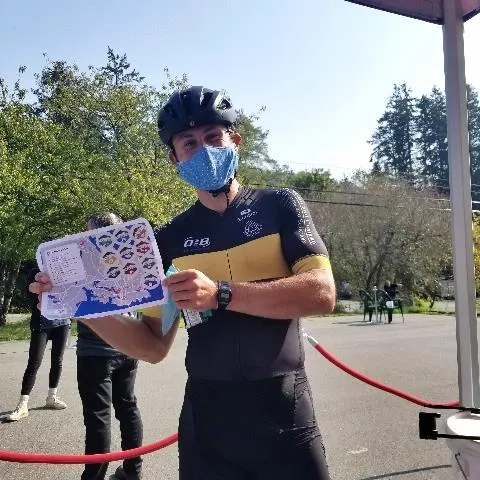
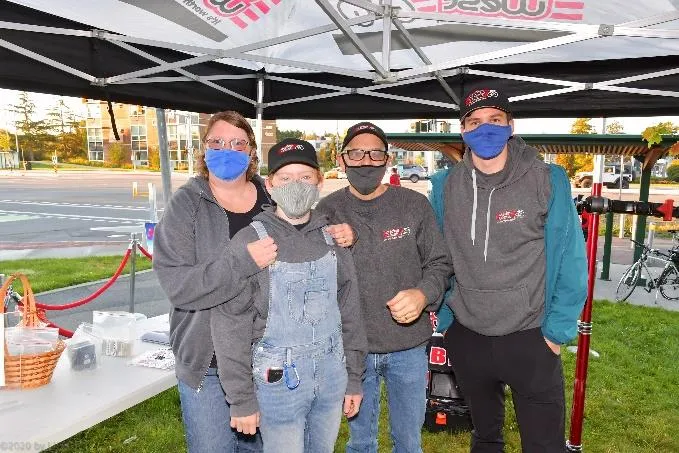
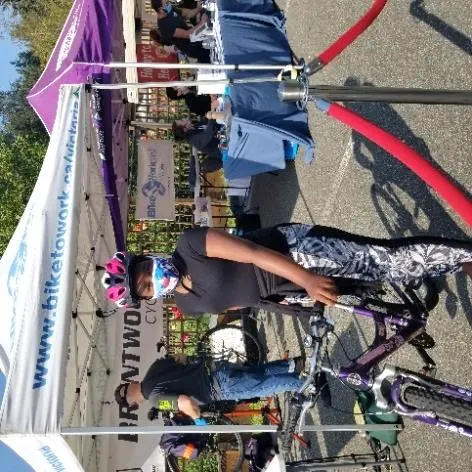
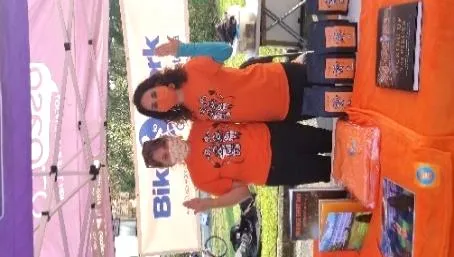
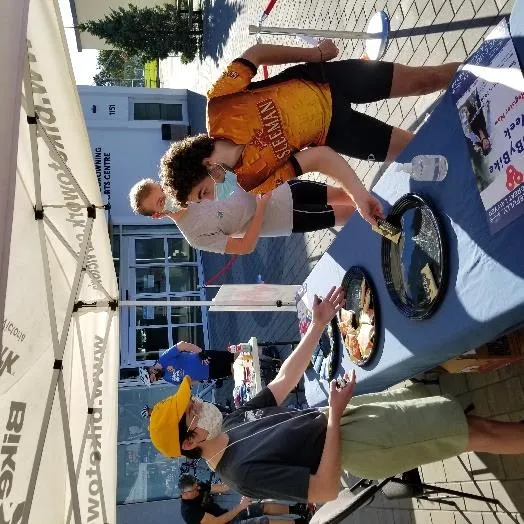
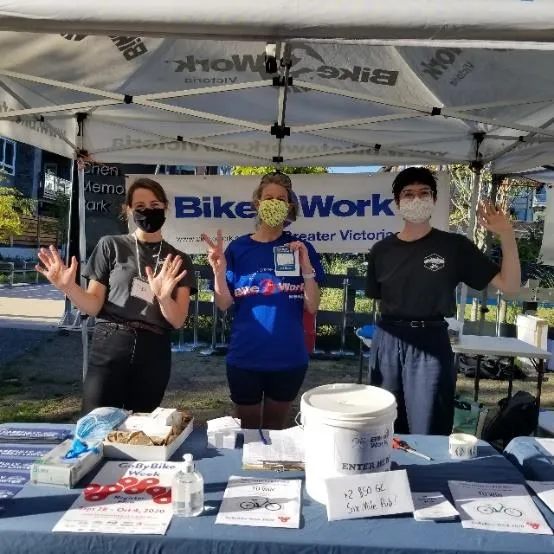
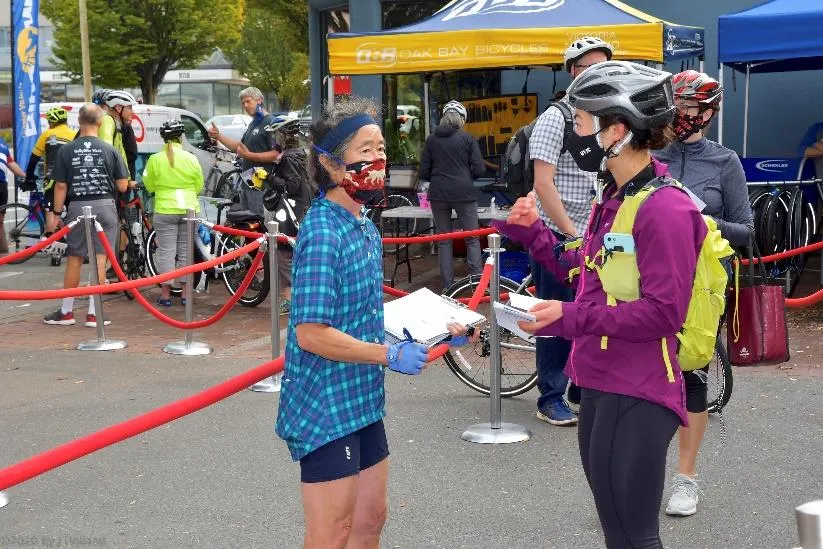
This year, we hosted 13 Celebration Stations during Go by Bike Week proving many opportunities for residents of all thirteen municipalities in Greater Victoria to take part in the week’s events.
- 13 Celebration Stations
- Approximately 2,000 visits
- People walking and driving were also exposed to the buzz of Celebration Stations increasing awareness about the week and bike commuting
Volunteers
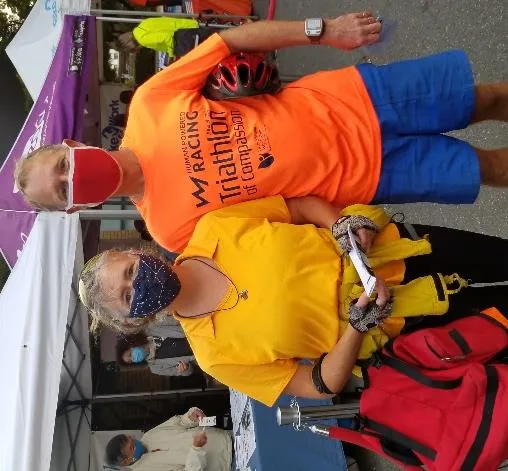
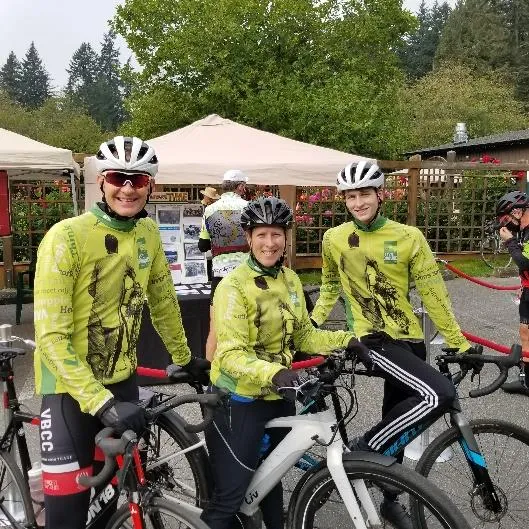
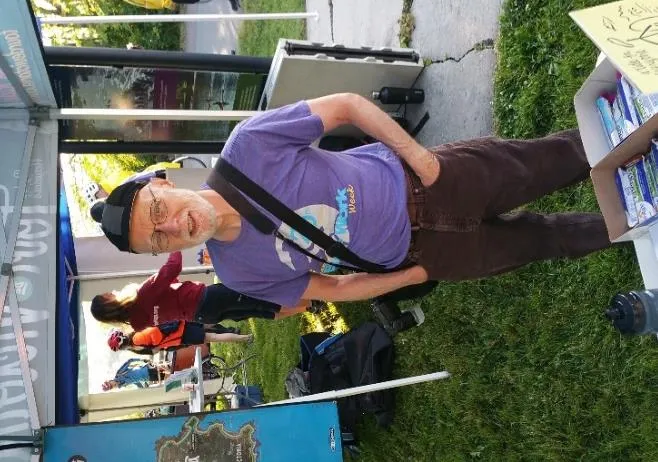
View Royal residents are amongst the hundreds of volunteer Team Leaders who help us encourage participation in Go by Bike Week as well as distribute posters, t-shirts, Celebration Station maps, passports, and other GBBW information and resources.
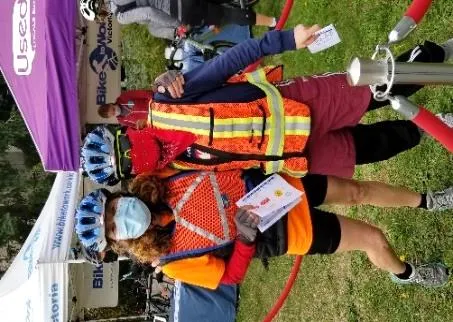
Dozens of volunteers also help us operate Celebration Stations. During the seven days of Go by Bike Week events alone, volunteers contribute over 100 hours to the successful operation of Celebration Stations throughout the region.
Volunteer tasks include:
- Equipment transportation
- Enforcing COVID-19 safety policy
- Food and beverage pick-up
- Setting up and tearing down stations
- Distributing maps, passports, and giveaways
- Engaging with visitors
- Creating an inclusive atmosphere
- Explaining how to participate and qualify for prizes
- Serving food
- Encouraging waste reduction
- Bike parking
- Photography
RECOGNITION OF SUPPORT
Print – Contribution greater than $1,500
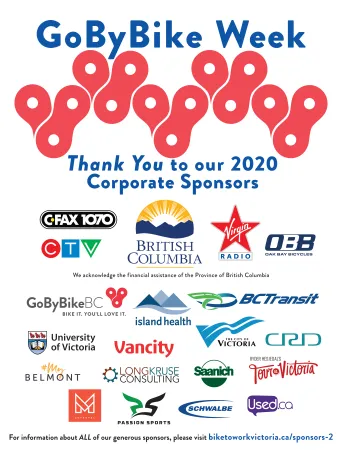
- 500 Posters, distributed throughout Greater Victoria – estimated 30,000 impressions
- Life-sized poster displayed at all Celebration Station – estimated 4,000 impressions
Digital
Contribution greater than $1,500
- Logo on two Bike to Work Week Websites: GVBTWS Website (biketoworkvictoria.ca) and registration site (gobybikebc.ca/greater-victoria)
Contribution less than $1,500
- Listing on two Bike to Work Week Websites: GVBTWS Website (biketoworkvictoria.ca) and registration site (gobybikebc.ca/greater-victoria)
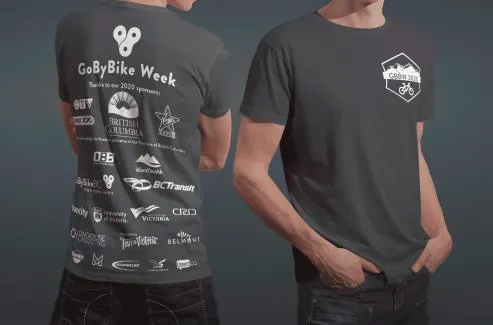
Event T-Shirts – Contribution greater than $1,500
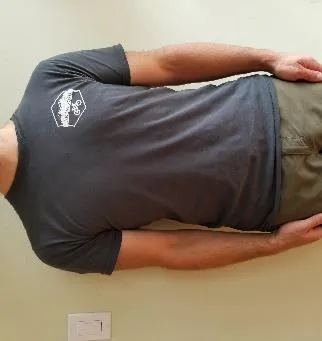
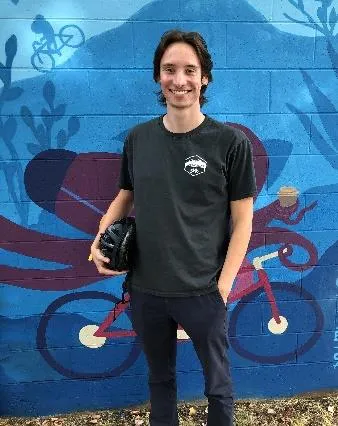
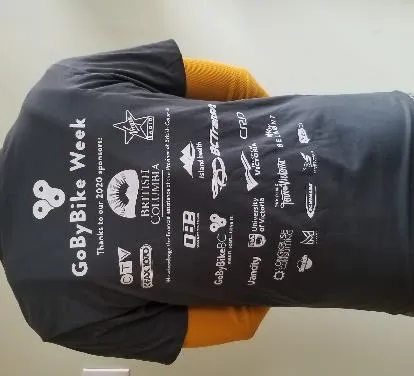
- 1,000 t-shirts given to Team Leaders and sold to workplaces teams throughout the region.
- Estimated 500,000 impressions. Go by Bike Week t-shirts are collected by many participants and are worn year-round. You’ll see participants wearing their favourite shirts on the trails for years to come!