Presentation
Presentation: Departmental GIS Web Viewers (GIS Update)
February 9, 2021Pages 59–679 sections
Presentation slides highlighting the Town's Geographic Information System (GIS) capabilities, mobile access, and specific analytical maps.
February 9, 2021Mentions Fire Service Area Analysis (6- and 8-minute areas)Includes 2020 Tree Permits by LPA mapping
Departmental GIS Web Viewers
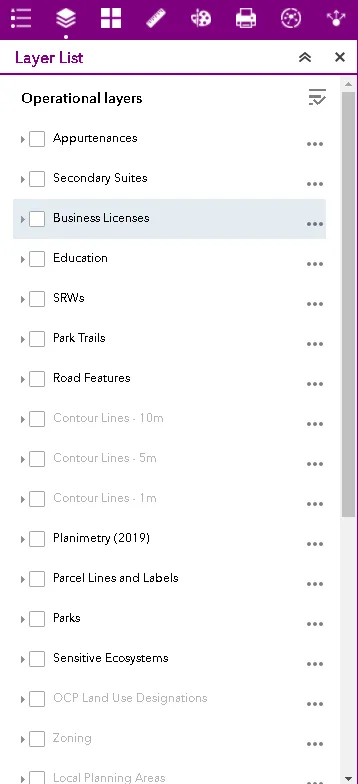
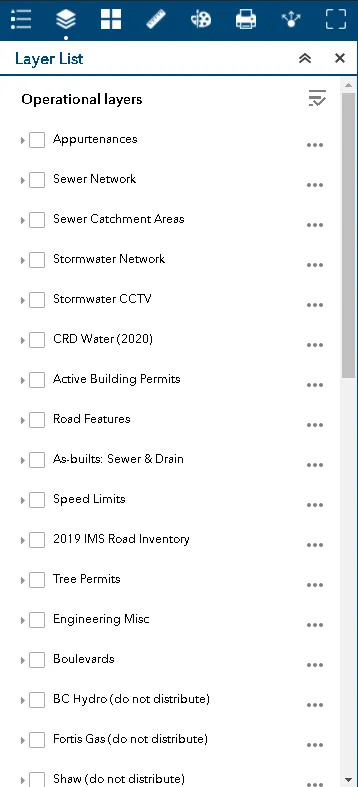
- Custom GIS Viewers for Parks, Emergency Services, Engineering, Development Services
- Easy, accessible hubs for GIS information
- Shows information tailored for each department
Page 59–67
Mobile GIS
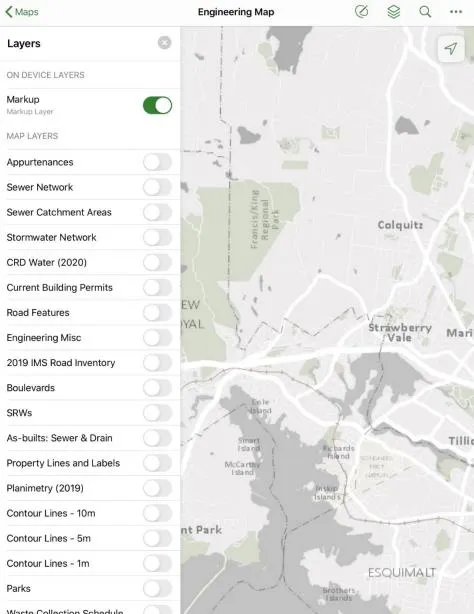
- All GIS information available in the office can now be seen in the field, e.g. asset information, utility networks, orthophotos, zoning
- Phone or tablet
- Access forms and plans remotely – eg. As-builts, traffic orders
Page 59–67
Access to Information from Vadim
- Ownership, business licenses, building permits
- Available on mobile
- Data available for mapping requests
Page 59–67
Improved On-site Inspections
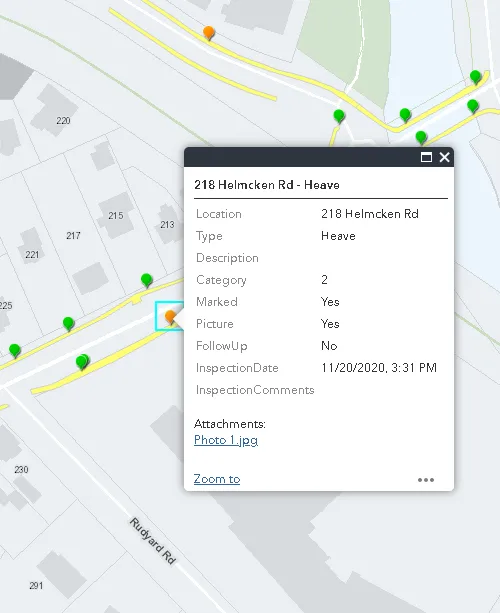

- Faster, easier inspections
- Data automatically added to GIS from the field
- Future maintenance planning
Page 59–67
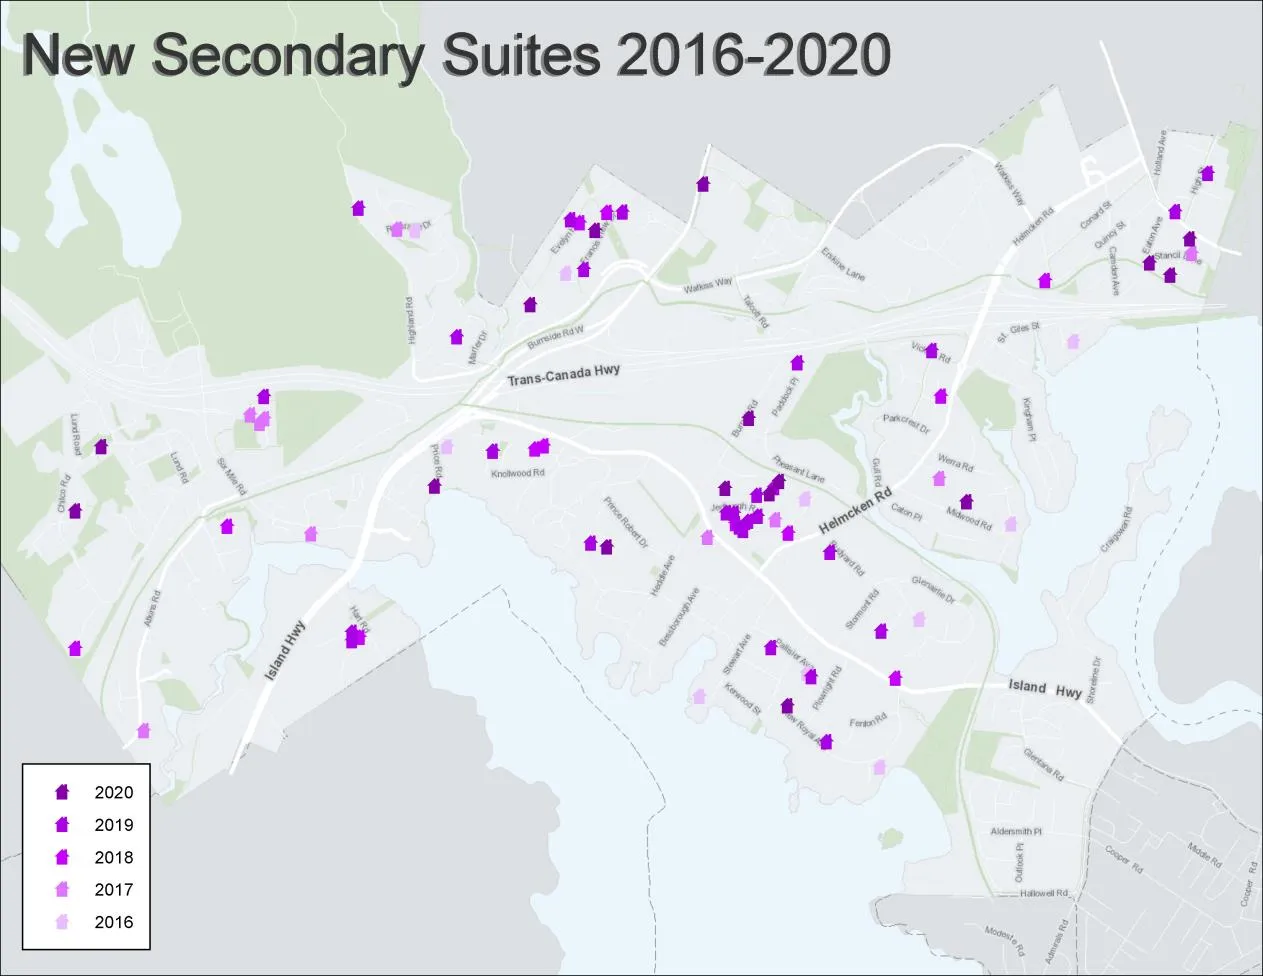
Tree Permit Mapping
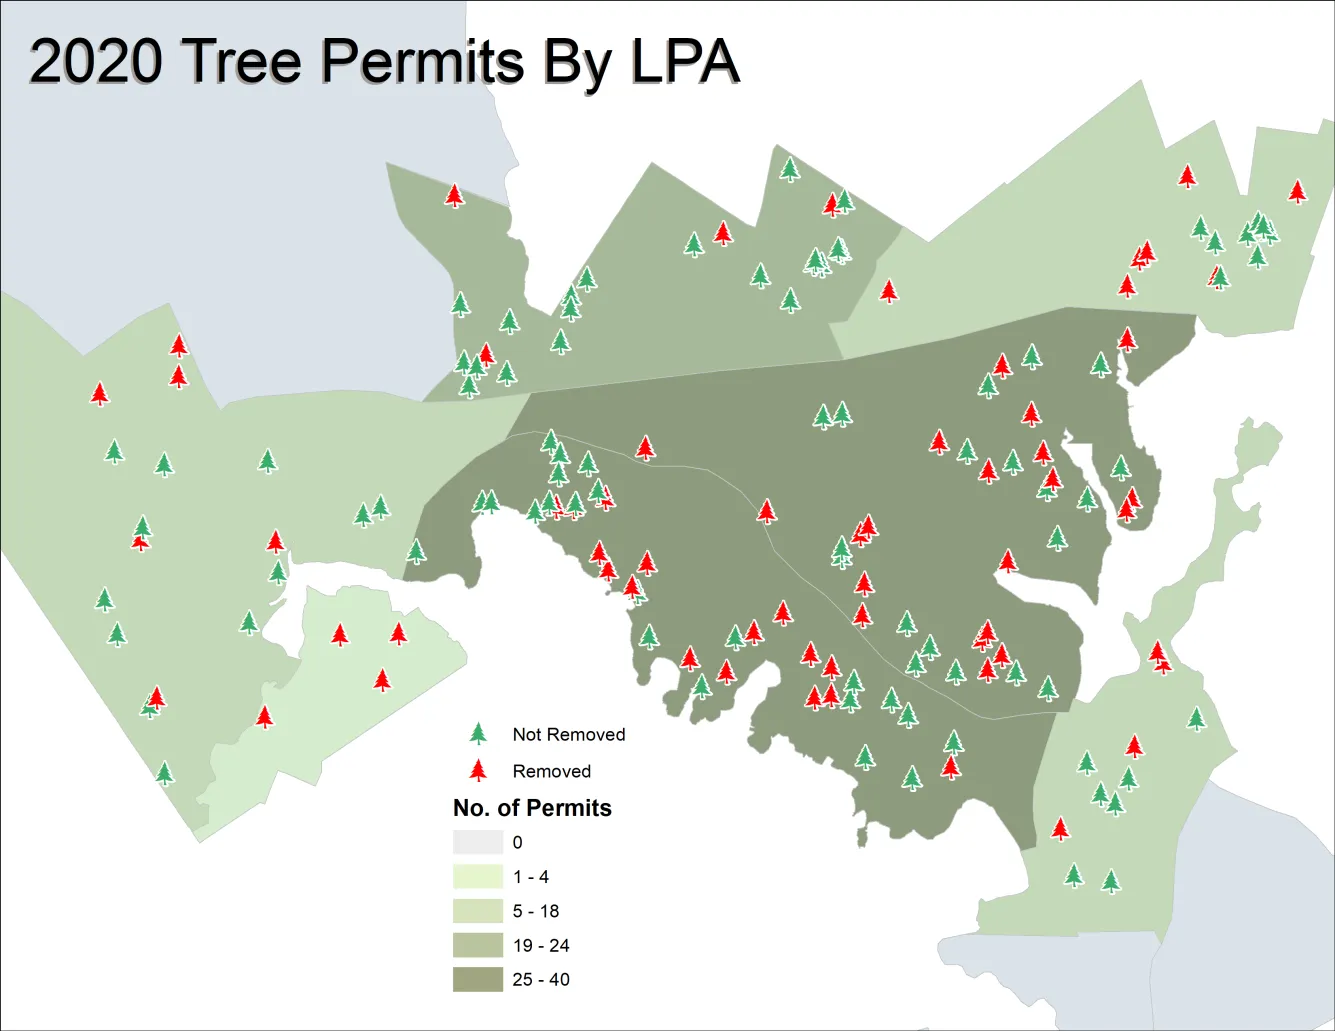
- Access to tree permit data in the field. Useful for bylaw, inspections
- Data available for mapping requests
Page 59–67
IMS Road Condition Mapping
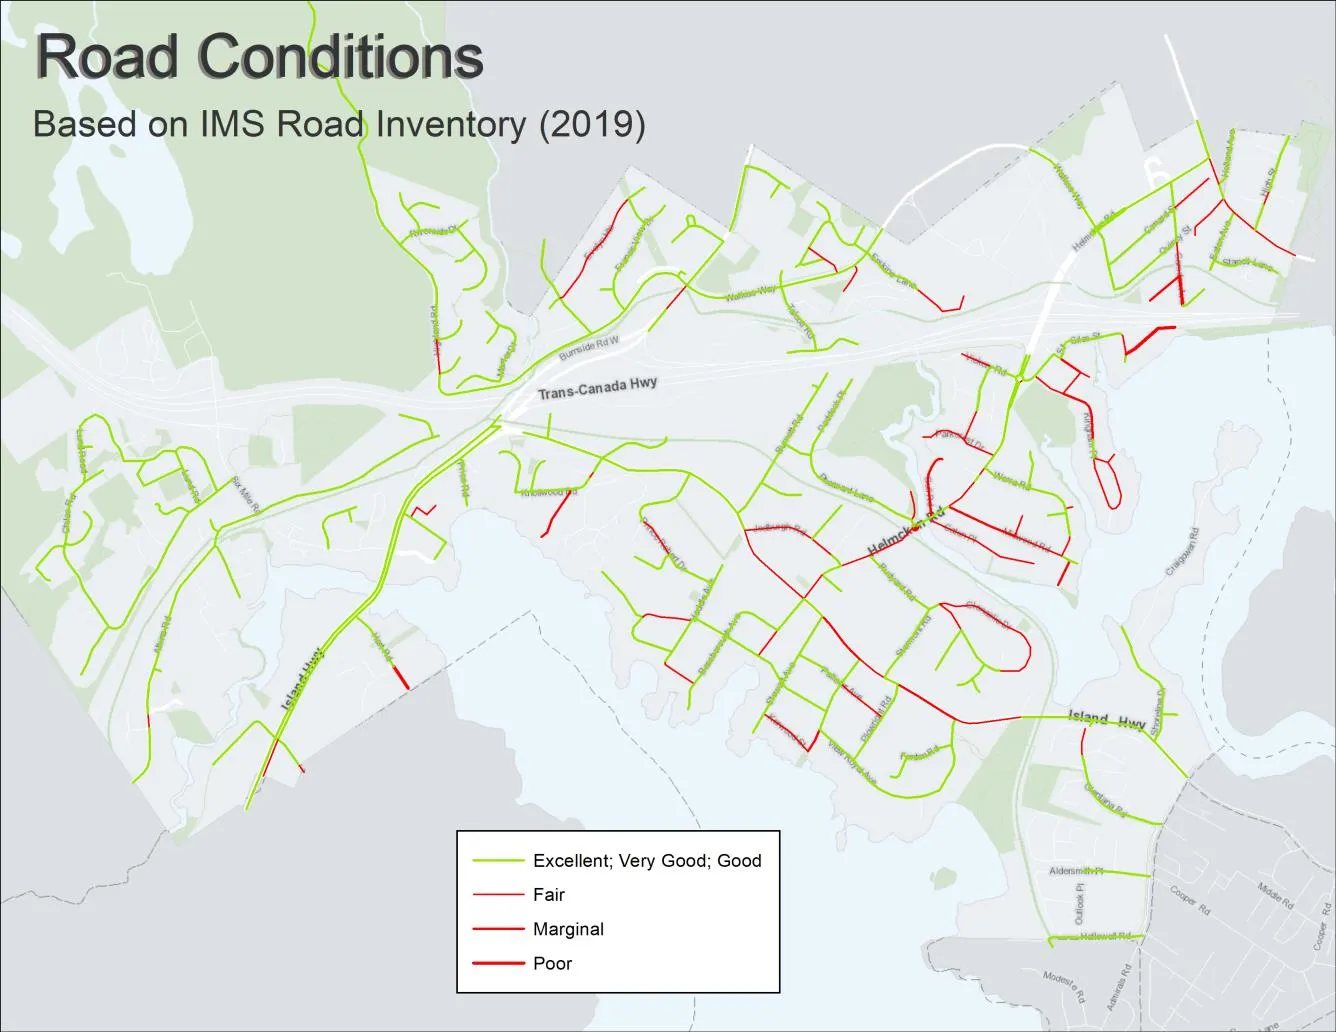
- Visual representation of condition data
- Easy access to information
- Can update inventory as streets are maintained
Page 59–67
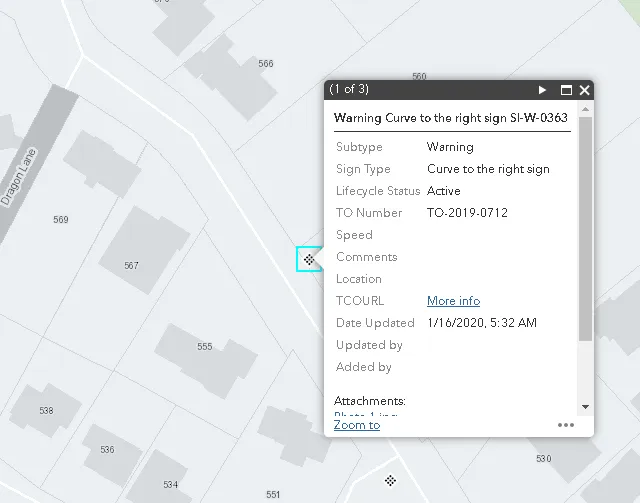
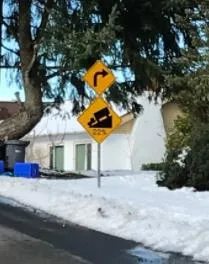
Street Signs and TCO Inventory
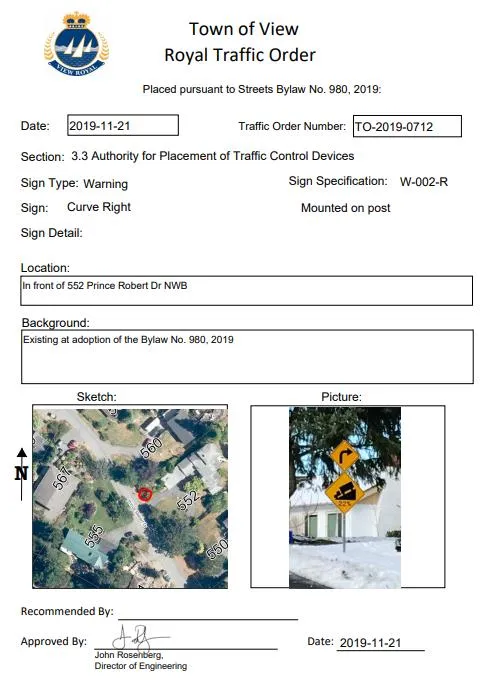
Page 59–67
Fire Service Area Analysis
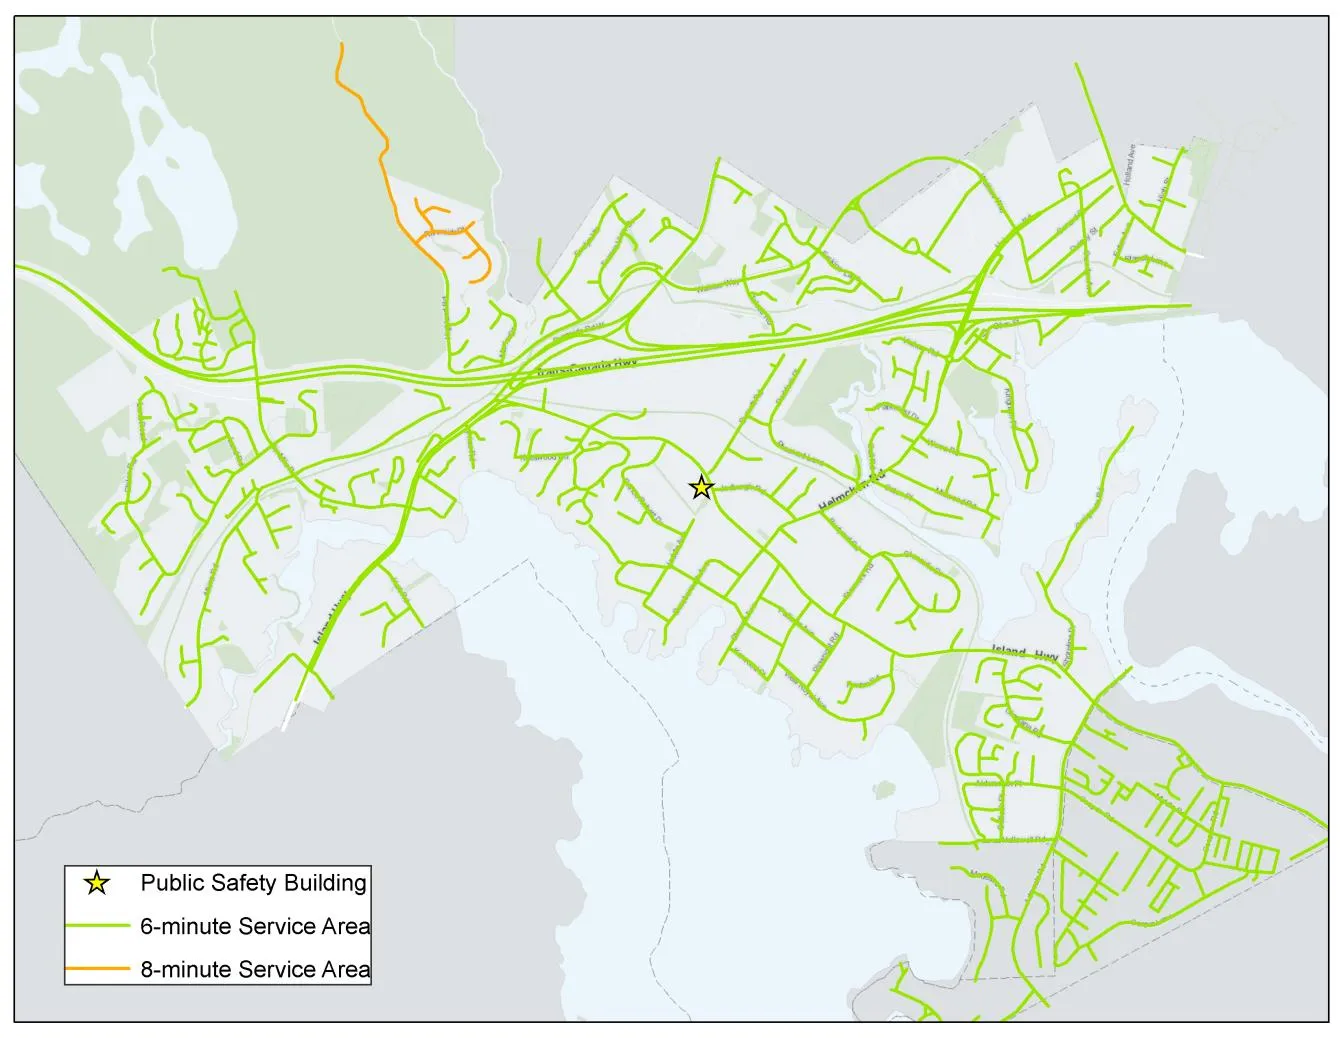
- 6- and 8-minute service areas
- Used GIS analysis and road/speed limit data to determine areas
Page 59–67
On-demand Mapping
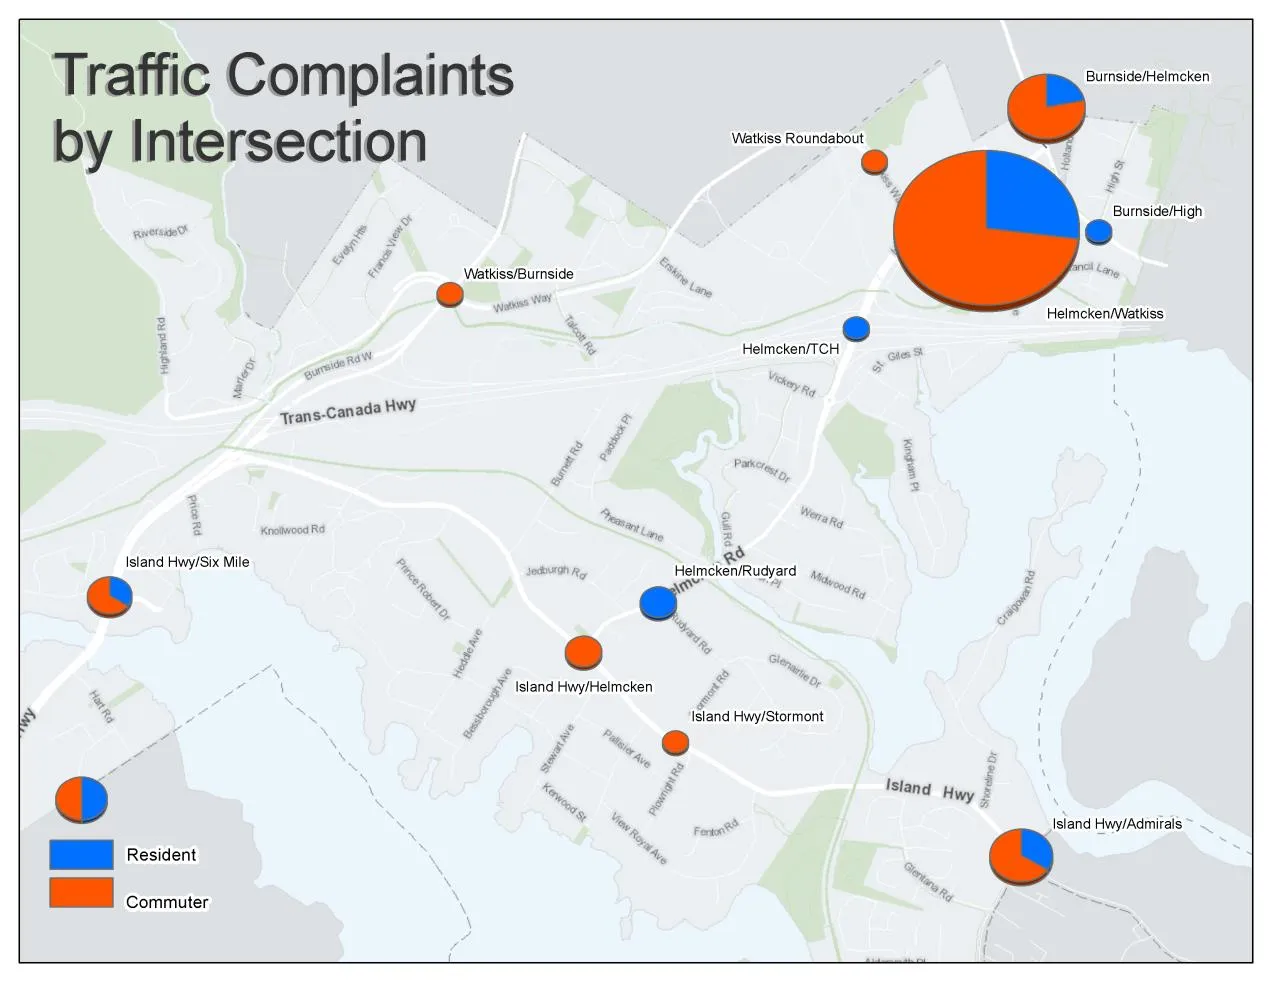
- Quick response time for mapping requests
- Quicker answers to questions – speed issues, graffiti, etc.
- Possible to make a living document
Page 59–67
Document Images
(2)
Extracted from: 2021 02 09 Committee of the Whole Agenda - Agenda - Pdf