Attachment 1: View Royal Community Climate Action Strategy DRAFT Engagement Summary Appendix A: Workshops
A draft document summarizing feedback from community workshops held to inform the Climate Action Strategy.
View Royal Community Climate Action Strategy
Engagement Summary Appendix A: Workshops
Town of View Royal October 2021
Appendix A. Engagement Summary
Engagement for the development of the View Royal Community Climate Action Strategy was conducted in two phases. The first involved workshops with community stakeholders, staff, and a few members of Council to inform the creation of the plan. The second phase focused on broader community feedback, in the form of two community surveys, to provide additional confirmation on the direction of the plan. The following summary highlights the activities conducted in each phase and the outcomes that influenced the creation of the plan.
Phase 1: Community Engagement Workshops
View Royal community stakeholders gathered via Zoom over two evenings (October 4 & 13, 2021) to discuss View Royal’s Community Climate Action Strategy. The workshops were facilitated by Community Energy Association (CEA) staff and featured in-depth discussion on the current sources of community emissions in View Royal, climate risks for the area, envisioning a low carbon and resilient future, and reviewing and prioritizing the “Big Moves” the actions local governments can take to reduce community Greenhouse Gas Emissions (GHGs).
Workshop participants and community stakeholders included the following groups:
- Town of View Royal Councillors and staff
- Residents
- View Royal Climate Coalition
- Victoria Highland Games Society
The workshops followed the “backcasting” approach, which asked participants to first envision a low carbon future and define success, before moving on to gathering their feedback to identify the current state of climate action in their community. In workshop #2 the focus was on creative solutions and prioritizing the necessary actions to achieve the vision.
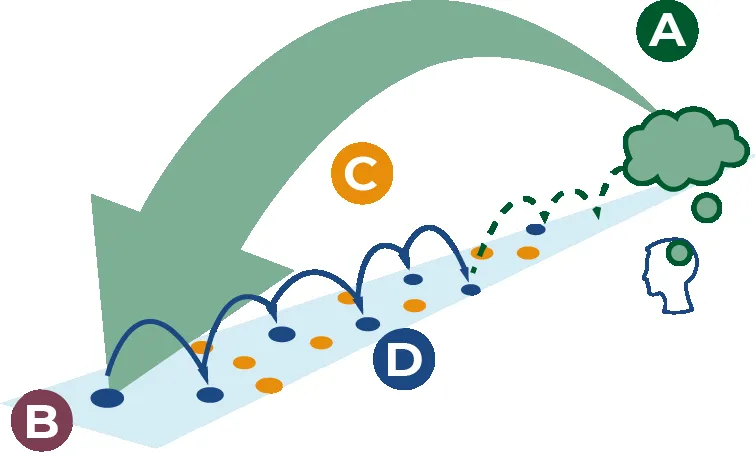
Workshop participants were divided into three breakout groups:
- Transportation
- Buildings
- Waste & Other
Workshop One
Activity A – A Vision of the Future
In the first breakout session, participants were asked to describe their low carbon vision for the future for transportation, buildings, and waste. The year 2040 was used in this exercise to bridge the gap between 2030, the short-term target year and 2050, the long-term target year. Participants were told that their vision could be unimpeded by traditional constraints such as cost. Participants were encouraged to be bold with their ideas. Miro, an online white board, was used to capture the feedback from participants in each of the breakout sessions.
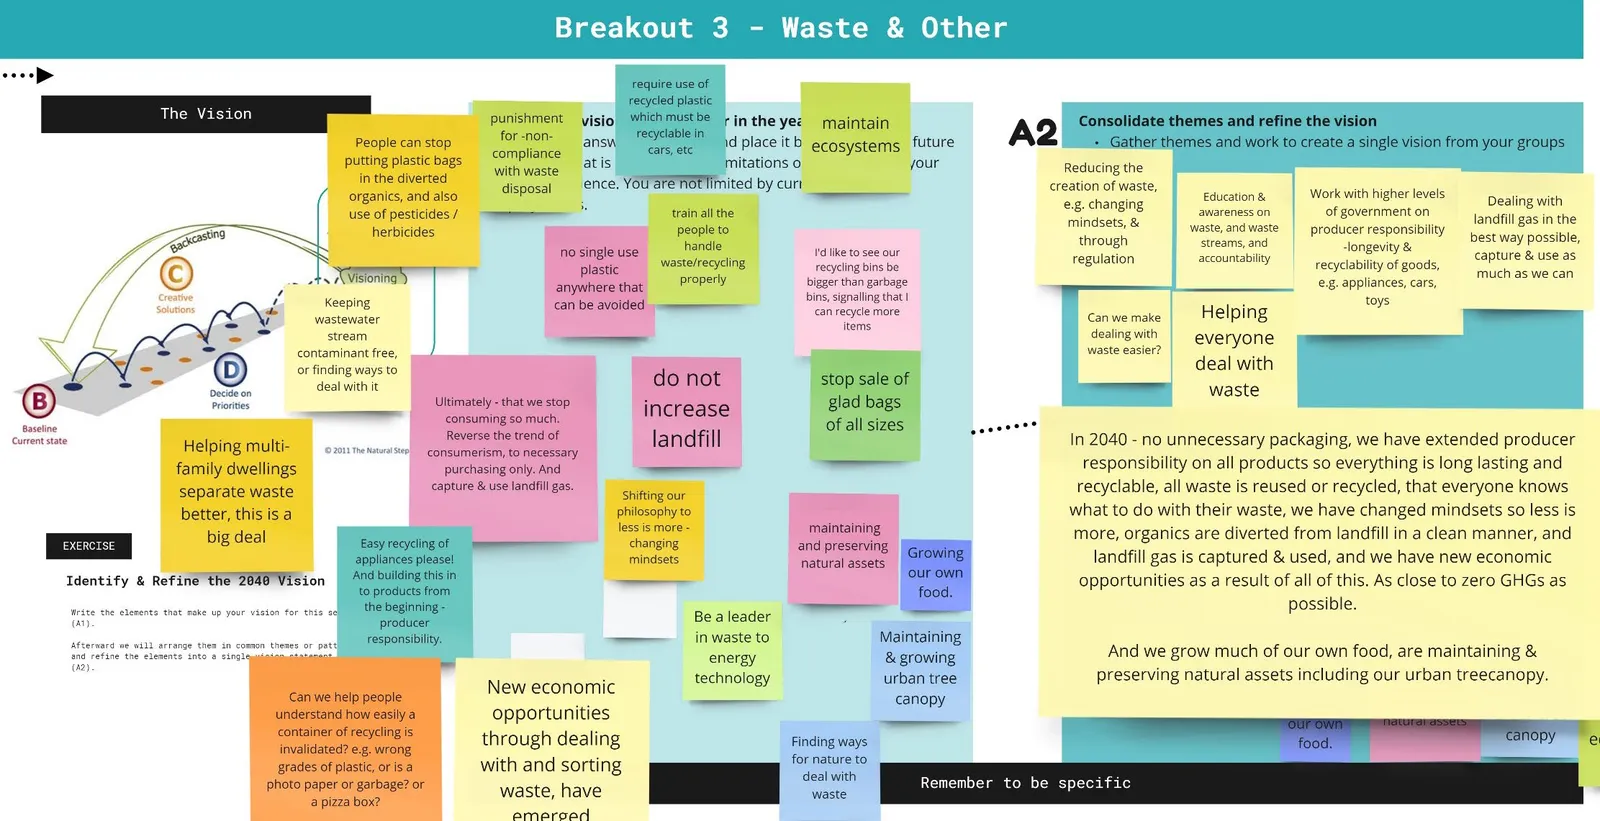
A synopsis of each group’s vision is located in the chart below. Screen captures from each group’s Miro board can be seen in Figure 1-3. You can access the boards at https://miro.com/app/board/o9J_l0snke0=/
| Transportation Electrification & Shift Beyond the Car | Buildings | Waste & Other |
|---|---|---|
| Integrated and multimodal transportation network | By 2030 zero fossil fuels and wood are used for heating buildings in View Royal. We've transitioned all buildings to electricity using heat pumps and geothermal, etc. | In 2040 – there is no unnecessary packaging; we have extended producer responsibility on all products so everything is long lasting and recyclable; all waste is reused or recycled; everyone knows what to do with their waste; we have changed mindsets so less is more; organics are diverted from landfill in a clean manner; landfill gas is captured & used; we have new economic opportunities as a result of all of this;, and we are as close to zero GHGs as possible. |
| Electrified transportation network | All new buildings are BC Energy Step Code Step Five or Passive House equivalents and are renewably powered. They are built using low carbon products and recycled materials. | We also grow much of our own food and are maintaining & preserving natural assets including our urban tree canopy. |
| Culture shift towards cycling and other forms of active transportation | Residents have accessed support for guidance through the retrofit process and half of all the buildings have received a low carbon retrofit that includes improved insulation, windows, and heat pumps. | |
| Continuous and safe infrastructure for walking | Our buildings are resilient to the impacts of climate change with green and white roofs and heat pumps for cooling and air filtration. | |
| Fewer cars due to autonomous vehicles and electric car share options | Increased density along corridors where transit is available. | |
| Reduce waste from demolition of buildings. Consider deconstruction to allow for recycling of materials. |
Figure 1 – A Vision of the Future for Transportation
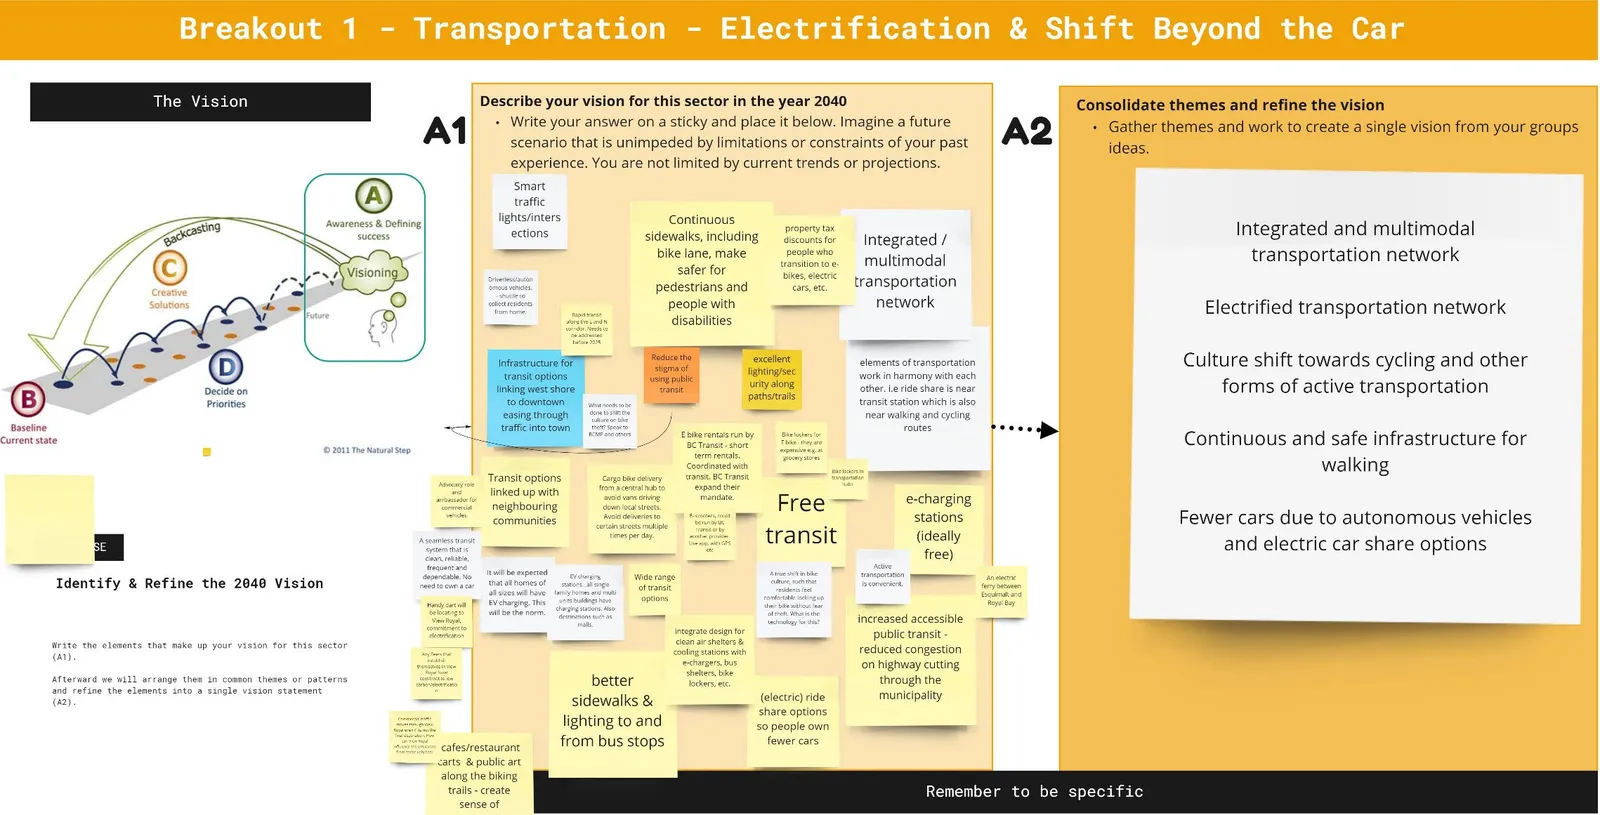
Figure 2 – A Vision of the Future for Buildings
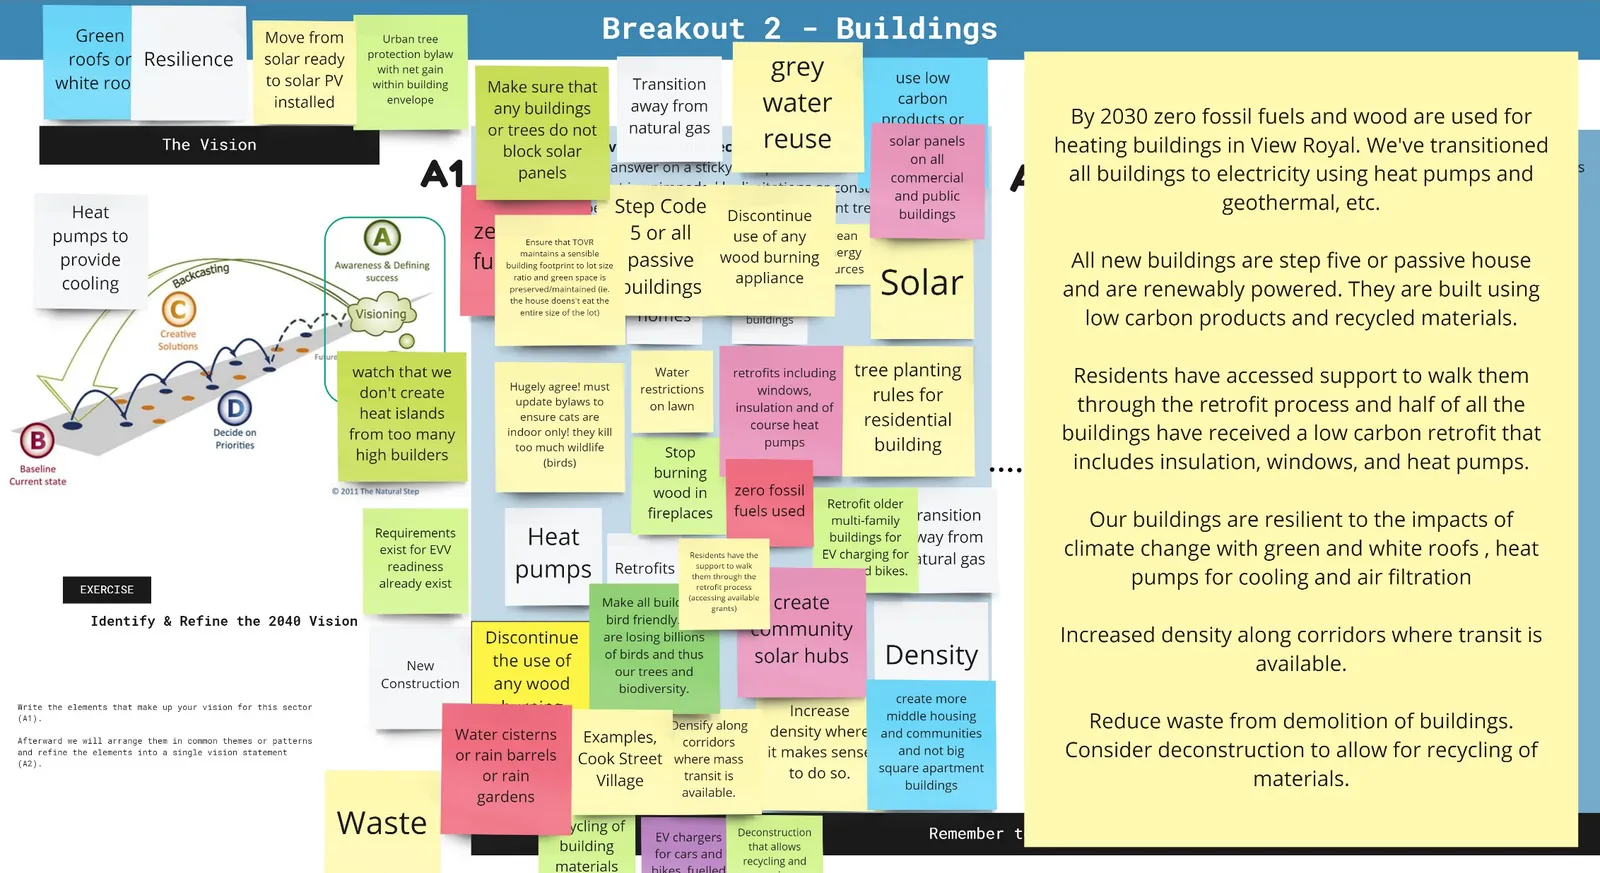
Figure 3 – A Vision of the Future for Waste and Other Sectors
Activity B – The Current State
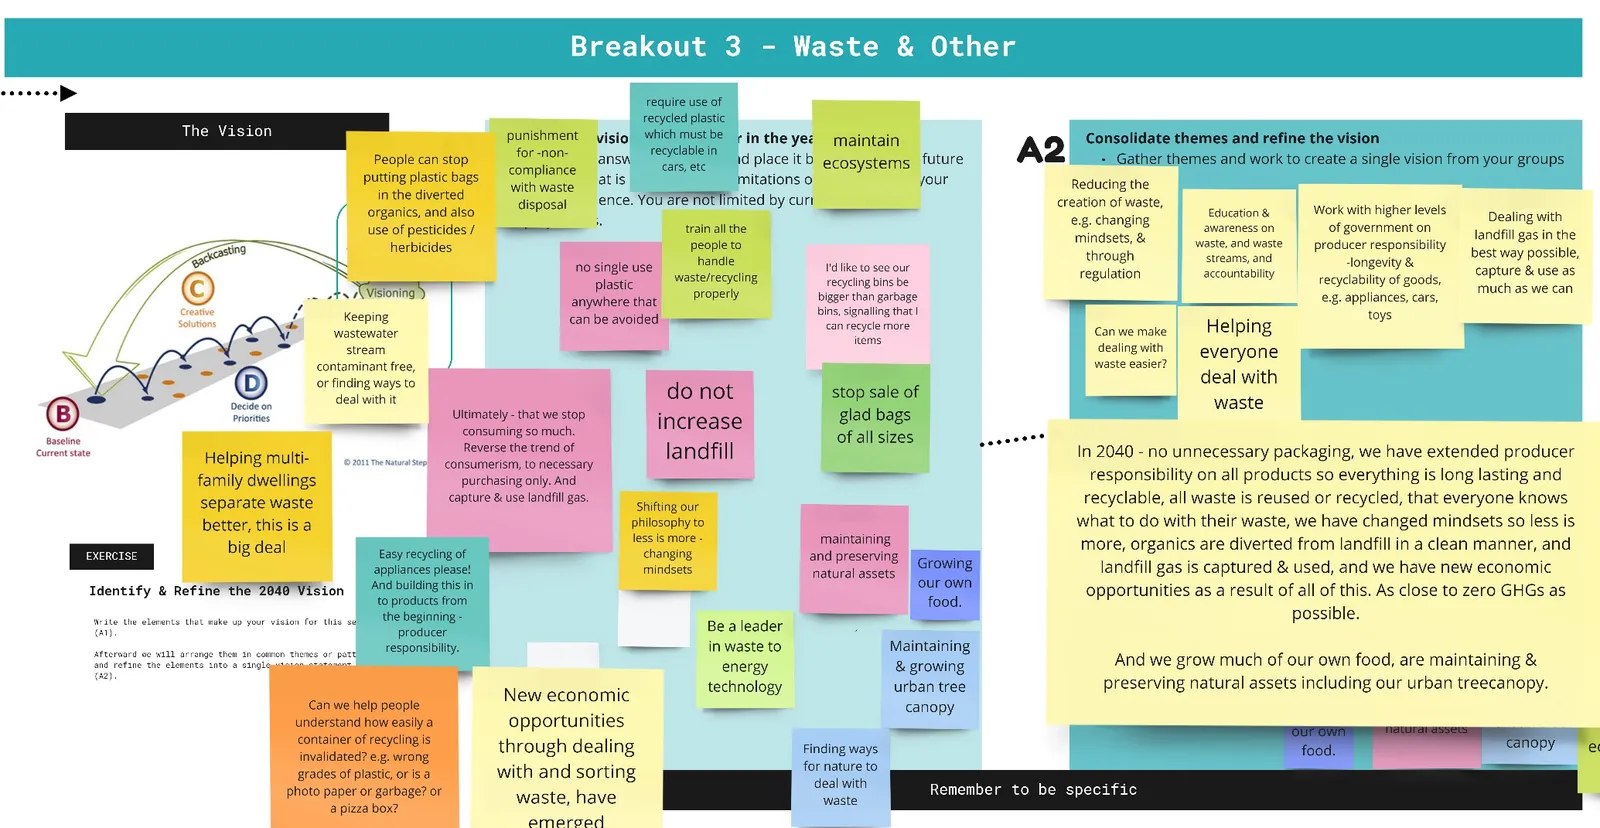
In the second breakout session, participants were asked to describe the current state of Transportation, Buildings, and Waste & Other in View Royal. Each groups’ Miro boards can be seen in Figures 4-6.
| Transportation Electrification & Shift Beyond the Car | Buildings | Waste & Other |
|---|---|---|
| Heavy through-traffic | Talent and expertise already exist in the region for new construction and retrofits. Energy advisors, builders, contractors, etc. | There is lots of room for improvement, but there are good things happening. Knowledge / awareness are major issues, producer responsibility, mindsets, the amount and what we consume, and how we reuse and repair |
| Safety concerns for pedestrians | Knowledgeable and motivated residents. | |
| Pedestrians not prioritized | Heat pumps are now needed for cooling and that is driving change. | |
| Bus #14 is well used but other areas are underserved | There are supply chain issues that are impacting uptake of retrofits and new low carbon new construction | |
| Concerns over bike theft | ||
| World class E&N and Galloping Goose Regional Trails |
Figure 4 - The Current State of Transportation
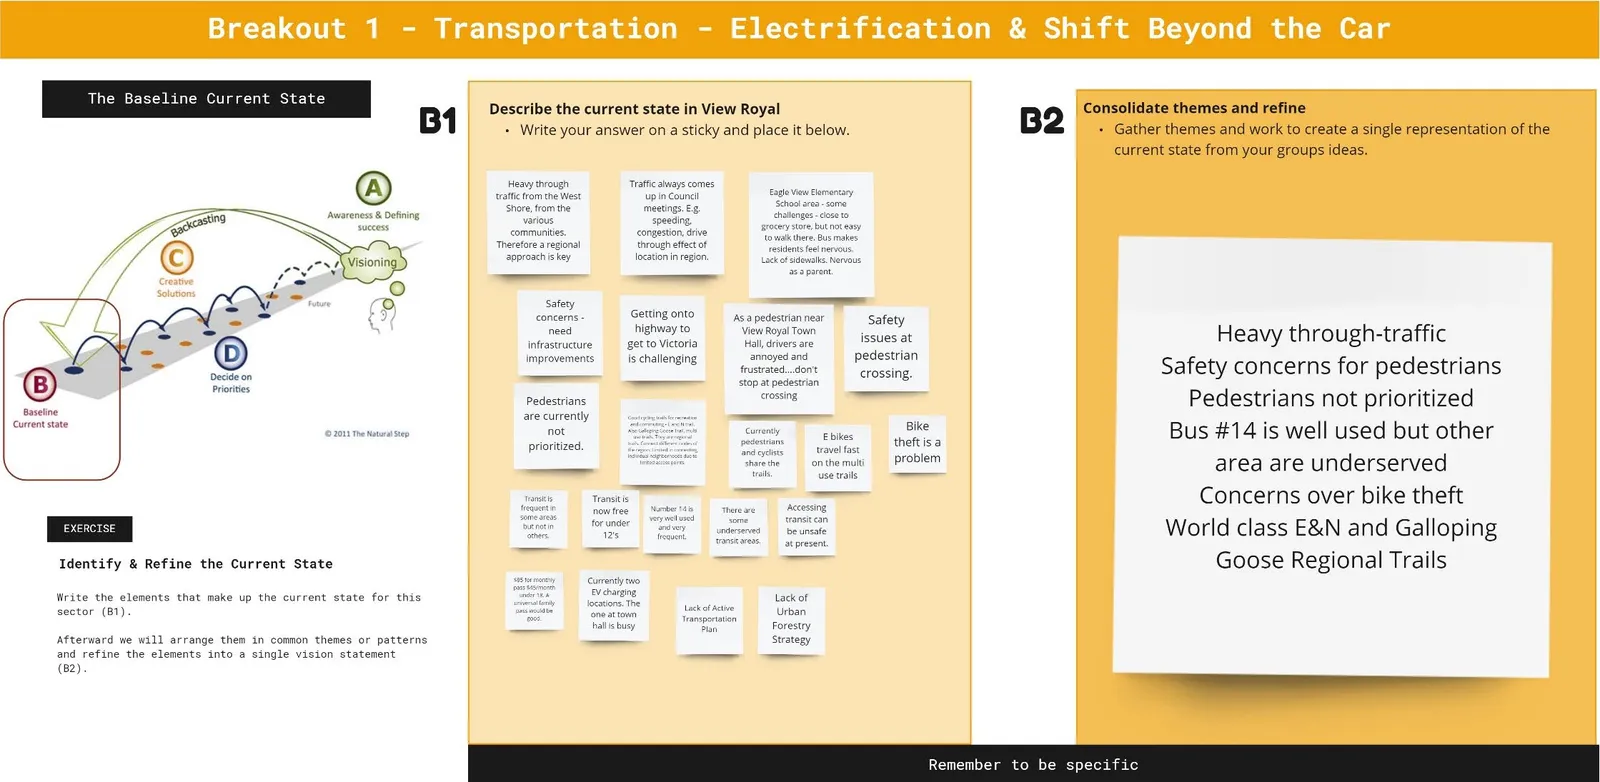
Figure 5 – The Current State of Buildings
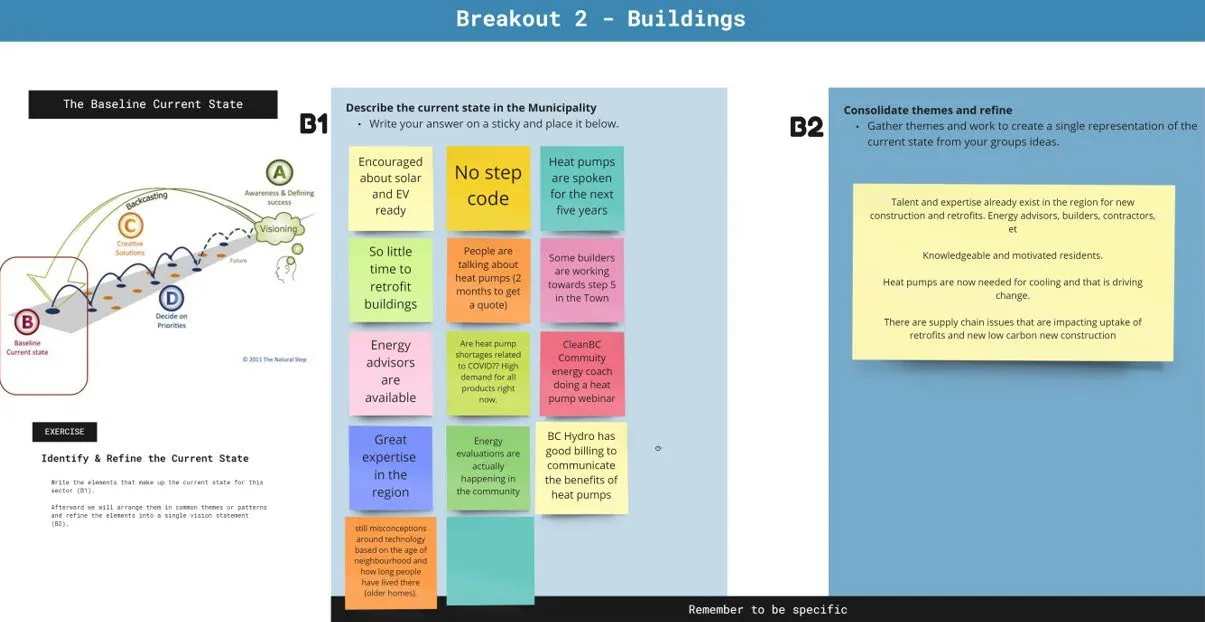
Figure 6 – The Current State of Waste & Other Sectors
Workshop Two
Activities C and D – Identifying and Prioritizing Creative Solutions
In the third breakout session, participants were asked to consider a number of creative solutions suggested by CEA and to identify additional ones. These strategies were then prioritized according to possible implementation timelines. Strategies were prioritized as follows;
- Short-term implementation (1 - 2 years)
- Medium-term implementation (3 – 5 years)
- Long-term implementation (5+ years)
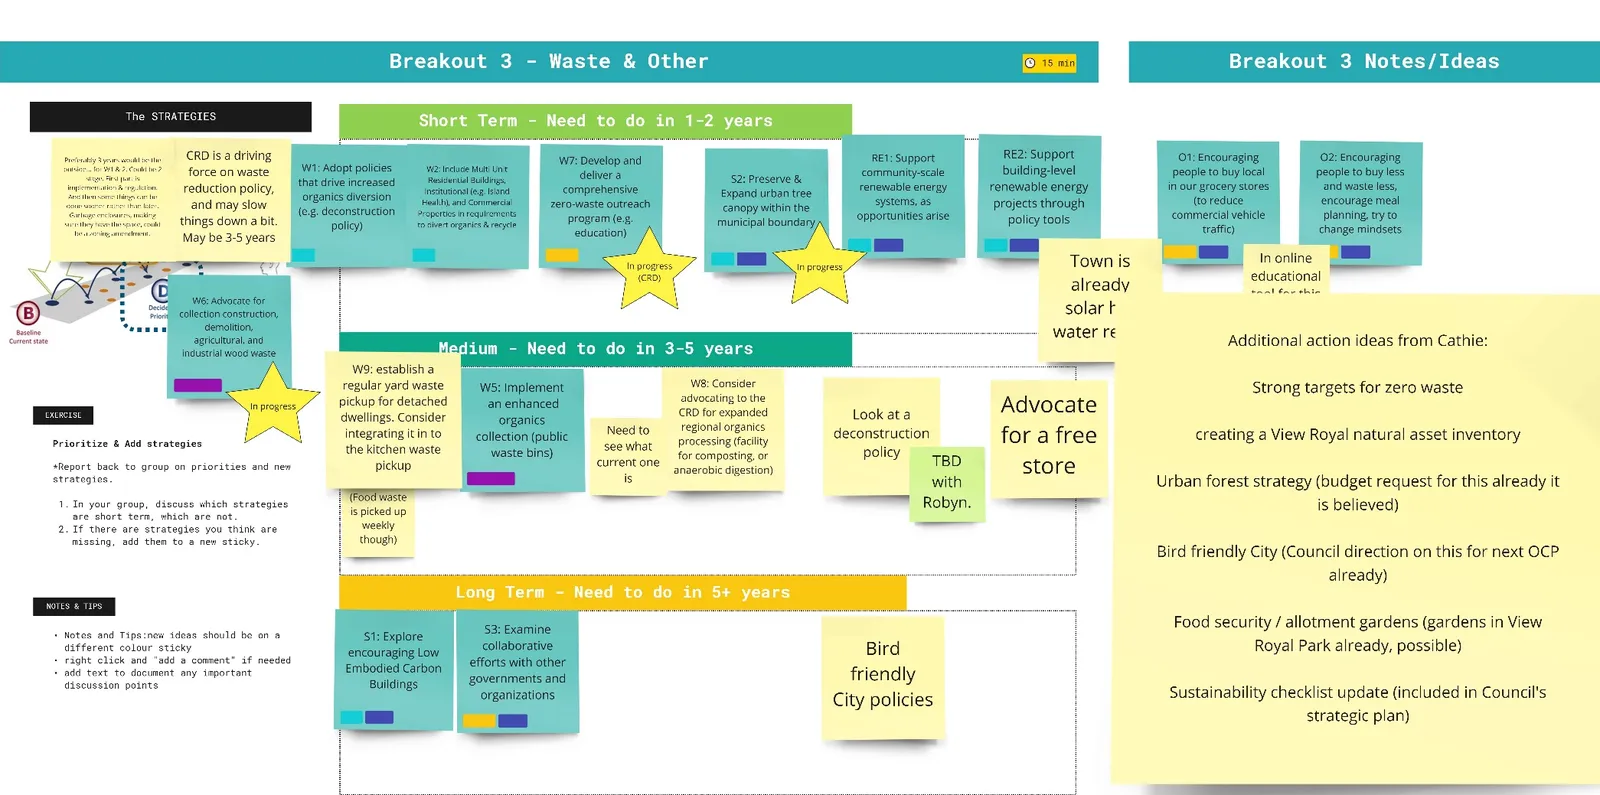
Figure 7, 8, and 9 show the prioritization of the Buildings, Transportation, and Waste & Other strategies respectively. The Miro boards can be accessed at https://miro.com/app/board/o9J_l0snlDg=/
Figure 7 – Prioritization of Transportation
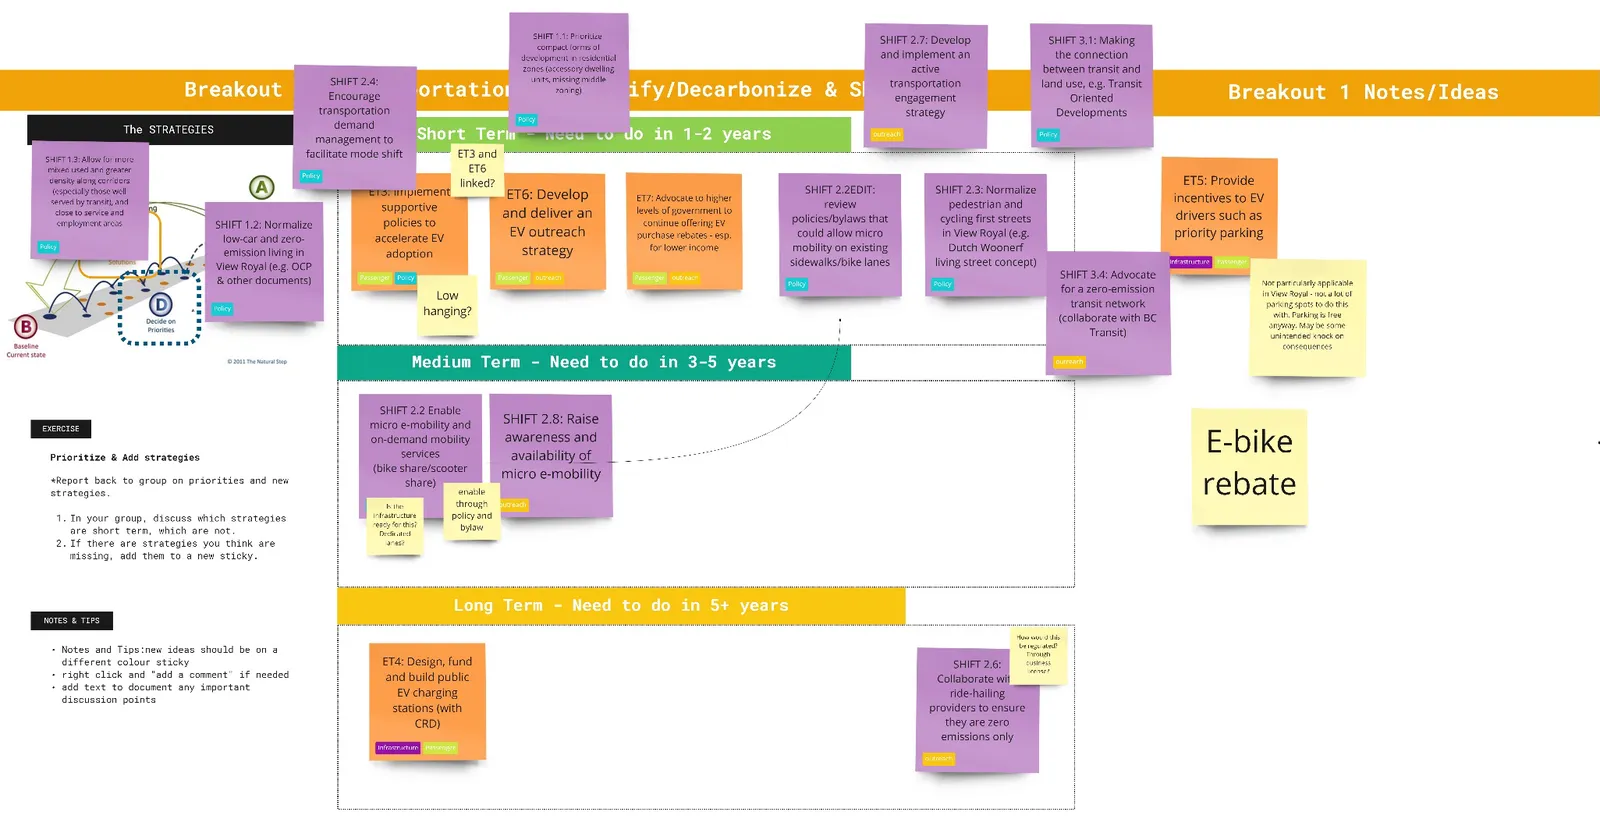
Figure 8 – Prioritization of Buildings Strategies
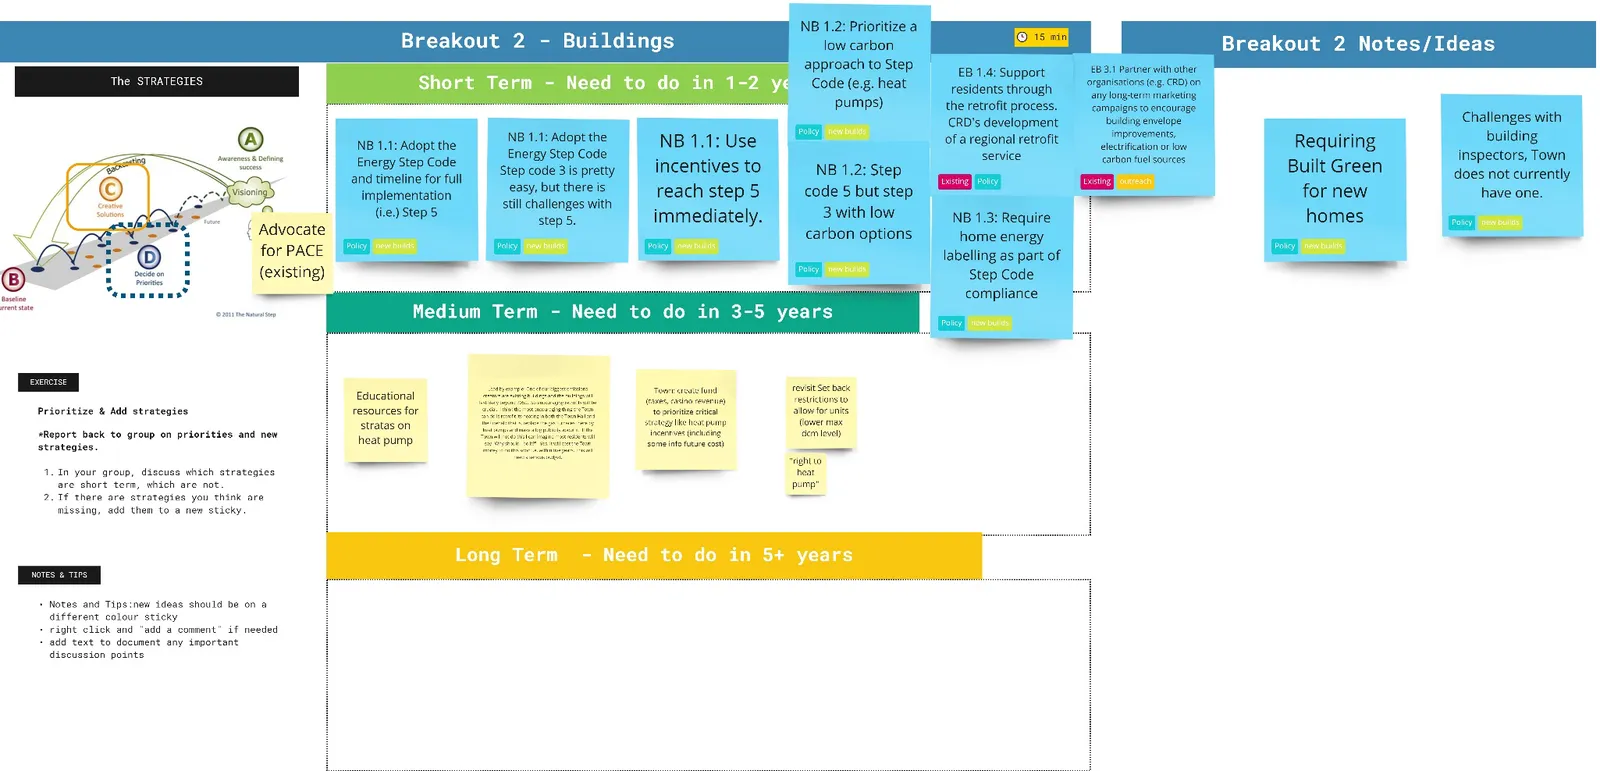
Figure 9 – Prioritization of Waste & Other Strategies
Deep Dive on Priority Strategies
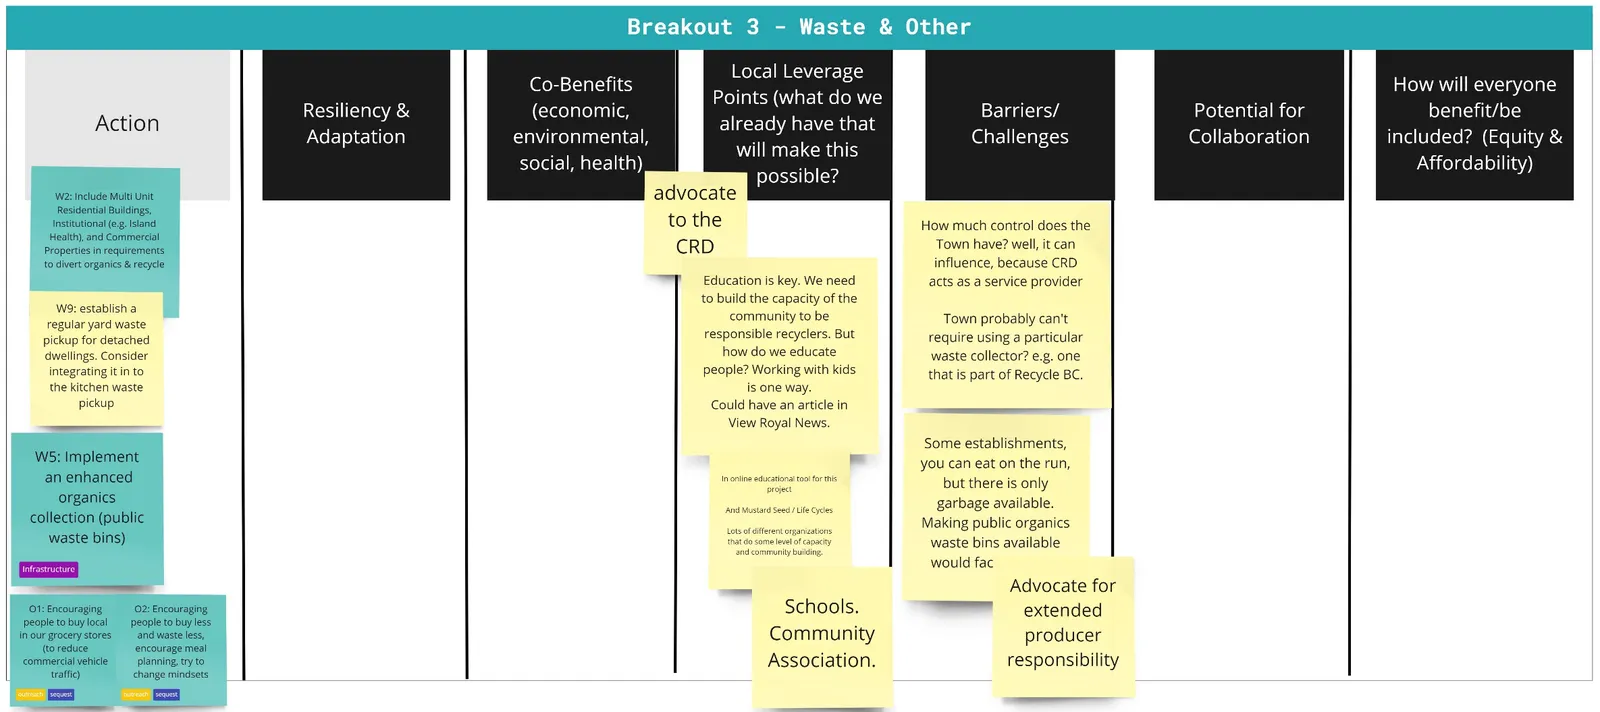
In the final breakout session of Workshop 2, participants were asked to select one or two of the priority strategies and do a deep dive in terms of the various critical success factors to implementing these strategies. They were asked to consider co-benefits (diagram below), local leverage points, barriers/challenges, catalysts/potential for collaboration, equity and next steps. This exercise is intended to dig into the local knowledge of participants and to give Town staff critical information for successful program and policy implementation. Each group’s Miro board for this exercise can be seen in Figures 10-12.
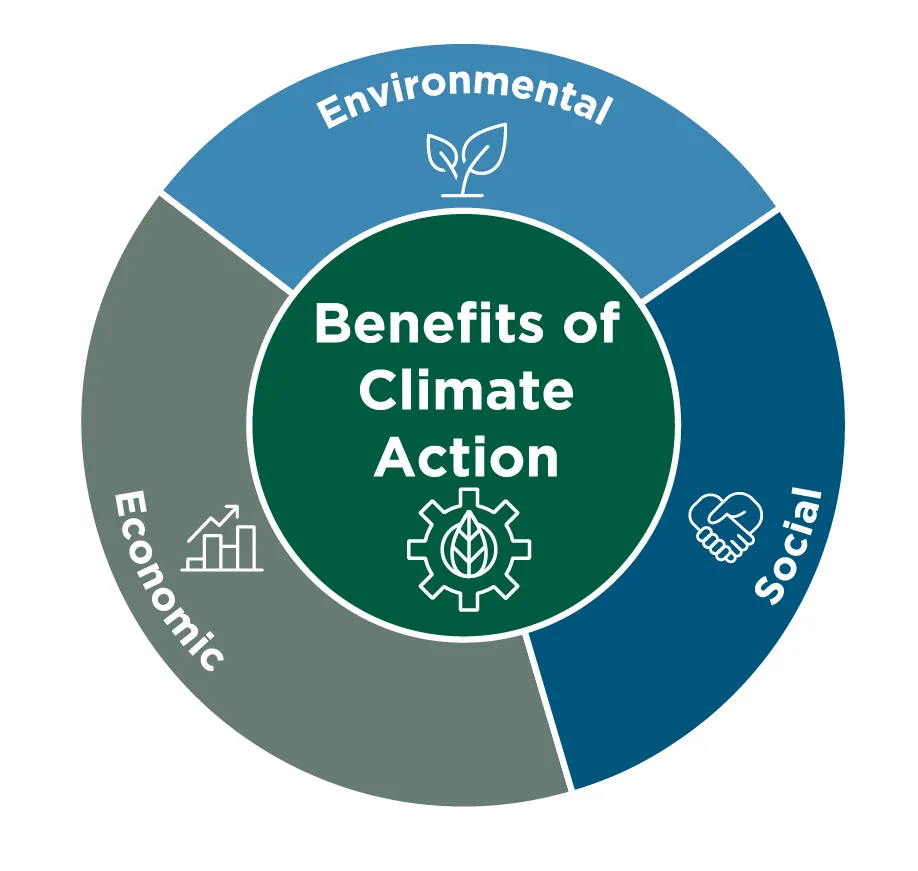
Figure 10 – Deep Dive on Strategies for Transportation
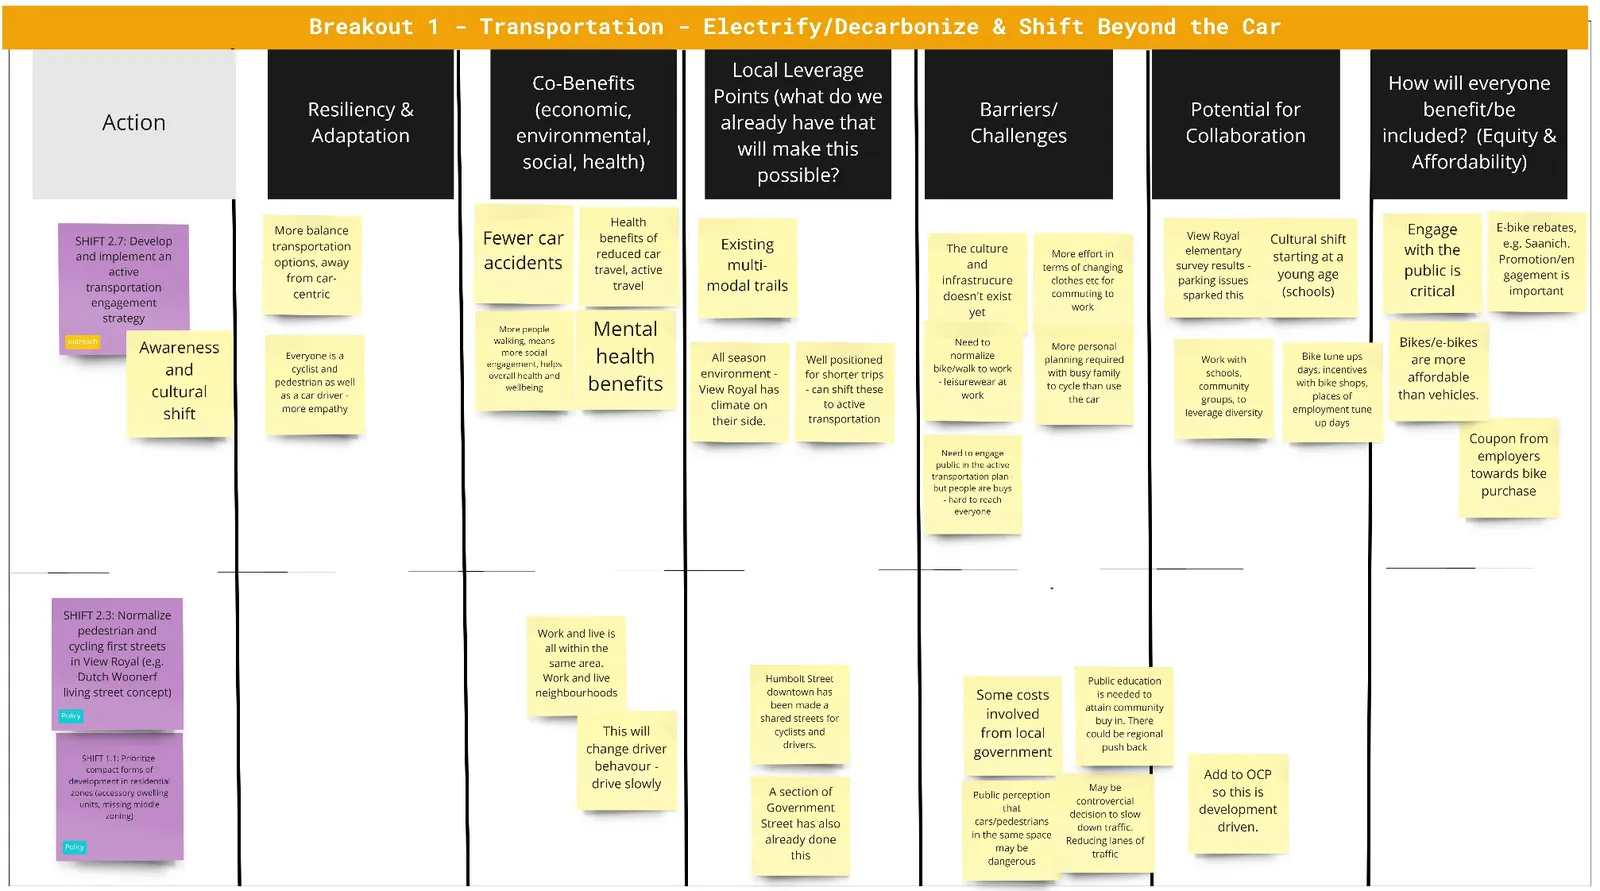
Figure 11 – Deep Dive on Strategies for Buildings
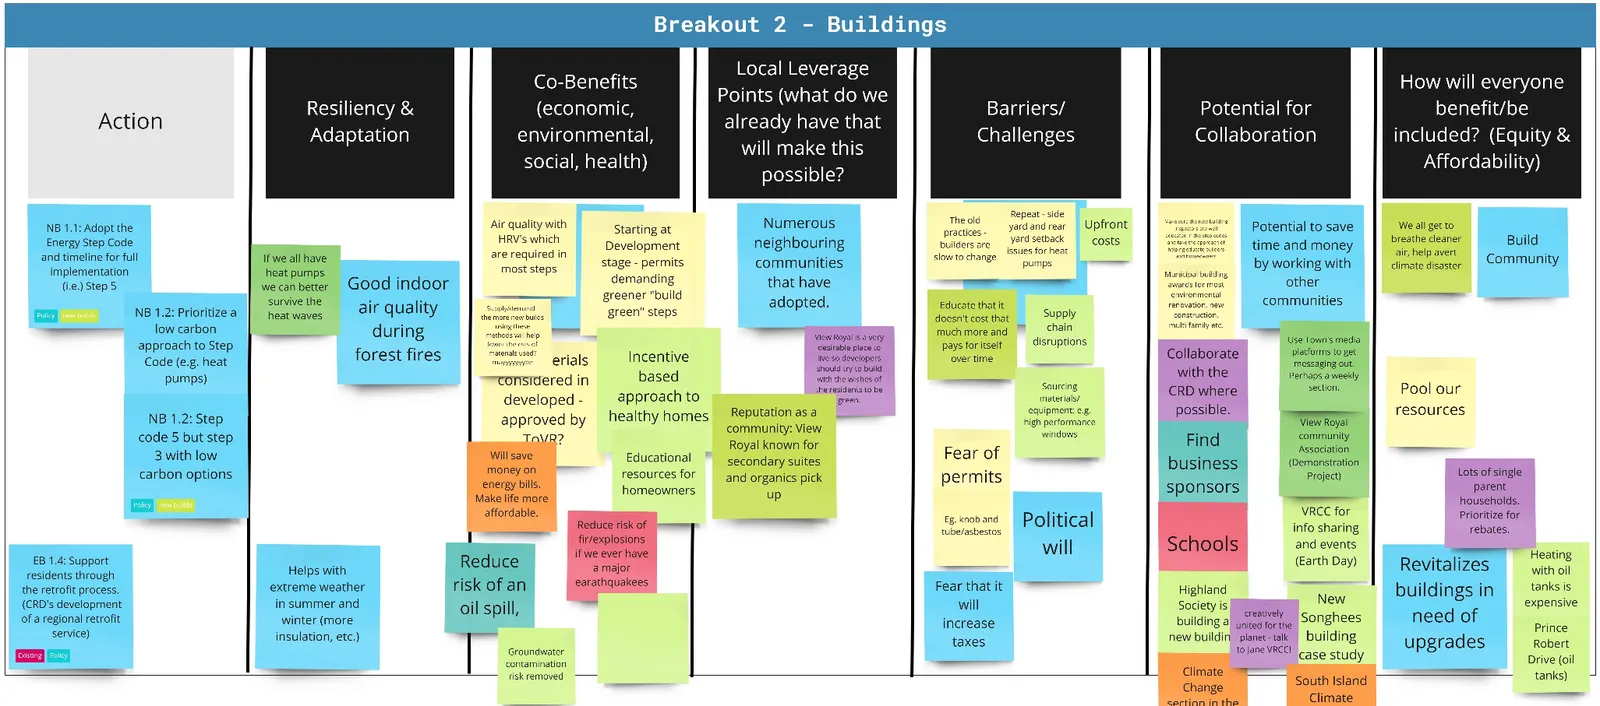
Figure 12 – Deep Dive on Strategies for Waste & Other
END OF DRAFT DOCUMENT
Document Images
(18)