Density Bonus and Affordable Housing Policy: Analysis and Recommendations
A comprehensive analysis and policy recommendation report prepared by Coriolis Consulting Corp regarding the implementation of density bonusing and inclusionary housing zoning for the City of Victoria.
This document provides an analysis and recommendations for the City of Victoria's density bonus and affordable housing policies as of April 2016.
1.0 Introduction
1.1 Background
The City of Victoria is exploring three separate (but related) aspects of negotiating Community Amenity Contributions (CACs) or affordable housing from rezonings.
The City currently negotiates contributions from rezonings inside the Downtown Core Area, in order to obtain contributions to help address the impacts of growth and provide benefits to the neighbourhoods that are absorbing extra commercial or residential development.
CACs are currently negotiated on a site-by-site basis. However, the City wants to explore using target fixed rates to calculate CACs in the Downtown Core Area.
The main reasons that City is interested in the possibility of using a target fixed rate approach include:
- The opportunity for greater efficiency in using fixed rates over individual site-by-site negotiations.
- The guidelines published by the Provincial Government indicating that the use of fixed rates may offer greater transparency and predictability to the development process.
- Potential for greater clarity/certainty for all stakeholders if the CAC amount can be calculated up front.
- Preference expressed by some developers for fixed rates over site-by-site analysis.
The Mayor’s Housing Affordability Task Force recently proposed that developers make contributions toward affordable housing through inclusionary zoning. The intent is that the City would require projects that rezone to include affordable housing units that would be sold or rented below market prices. Alternatively, developers could make a cash in lieu contribution to an affordable housing fund. Council has directed staff to provide recommendations on implementing inclusionary zoning as a way to support the development of more affordable housing both inside and outside of the Downtown Core Area.
During 2014 and 2015, the City evaluated the feasibility of implementing a fixed rate target CAC approach for bonus density at rezonings outside the Downtown Core Area. Coriolis Consulting Corp. provided financial analysis and policy analysis inputs to this evaluation. Our analysis and recommendations are contained in a report¹ entitled “City of Victoria Density Bonus Policy Study: for Sites Outside the Downtown Core Area”.
To address these different questions, the City retained Coriolis Consulting Corp to:
- Analyze the feasibility of implementing a target fixed rate CAC system for the Downtown Core Area density bonus areas.
- Analyze the ability of rezonings in the Core Area density bonus areas to make contributions toward amenities and/or affordable housing.
- Use the results and findings from our 2015 analysis for sites outside of the Core Area to evaluate the potential to obtain affordable housing contributions from rezonings outside the Core Area.
- Recommend an approach to CACs and affordable housing from rezonings inside the Core Area and outside of the Core Area.
This report summarizes the results of our analysis and documents our conclusions and recommendations. The analysis and conclusions contained in this report for rezonings outside of the Core Area relies on the findings contained in our separate report “City of Victoria Density Bonus Policy Study: for Sites Outside the Downtown Core Area”.
¹ Draft report dated 5 March 2015.
1.2 Report Organization
This report is organized as follows:
- Section 2.0 identifies the study area for the policy analysis.
- Section 3.0 summarizes our analysis and findings for rezonings inside the Downtown Core Area.
- Section 4.0 summarizes our analysis and findings for rezonings outside of the Downtown Core Area.
- Section 5.0 provides our recommended approach.
- The Attachments include the methodology and key assumptions used for our detailed case study financial analysis as well as examples of our case study analysis.
1.3 Professional Disclaimer
This document may contain estimates and forecasts of future growth and urban development prospects, estimates of the financial performance of possible future urban development projects, opinions regarding the likelihood of approval of development projects, and recommendations regarding development strategy or municipal policy. All such estimates, forecasts, opinions, and recommendations are based in part on forecasts and assumptions regarding population change, economic growth, policy, market conditions, development costs and other variables. The assumptions, estimates, forecasts, opinions, and recommendations are based on interpreting past trends, gauging current conditions, and making judgments about the future. As with all judgments concerning future trends and events, however, there is uncertainty and risk that conditions change or unanticipated circumstances occur such that actual events turn out differently than as anticipated in this document, which is intended to be used as a reasonable indicator of potential outcomes rather than as a precise prediction of future events.
Nothing contained in this report, express or implied, shall confer rights or remedies upon, or create any contractual relationship with, or cause of action in favor of, any third party relying upon this document.
In no event shall Coriolis Consulting Corp. be liable to the City of Victoria or any third party for any indirect, incidental, special, or consequential damages whatsoever, including lost revenues or profits.
2.0 Study Area for Analysis
2.1 Downtown Core Area
In specific subareas inside the Downtown Core Area, the Core Area Plan and OCP identify base densities and potential discretionary additional density. The study area for our analysis of rezonings inside the Core Area includes:
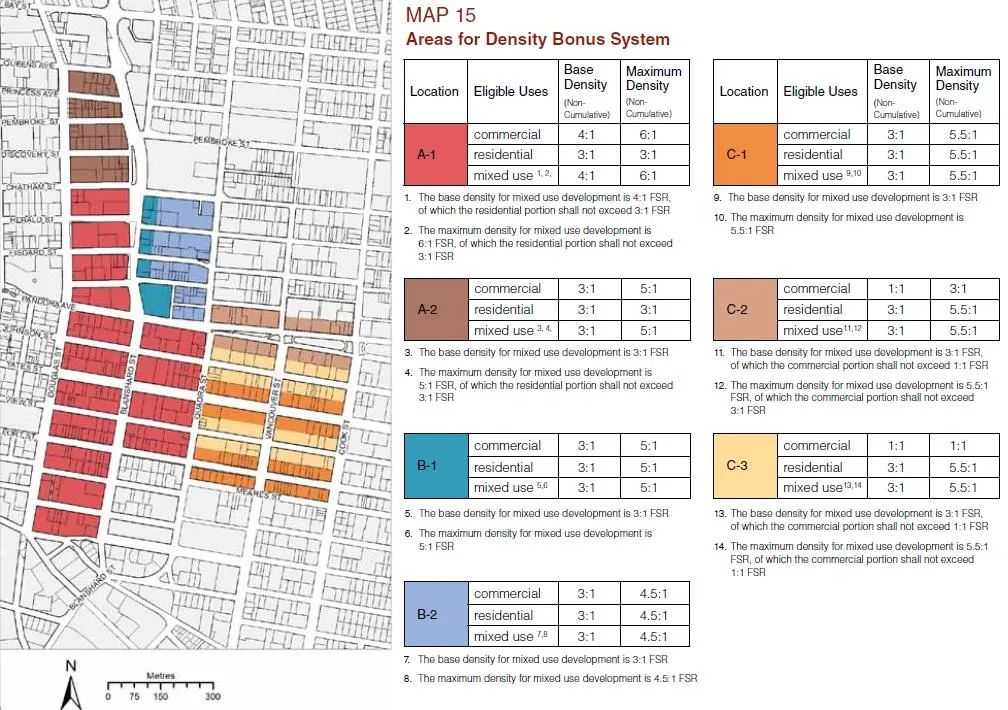
- The locations identified in the Downtown Core Area Plan for density bonusing². The Plan identifies seven different subareas which have a base density of 3.0 FSR with the opportunity for increased density up to a range of 4.5 FSR to 6.0 FSR depending on the subarea. The bonus density can only be used for increased commercial floorspace in two of the subareas (A-1 and A-2). In the other five subareas (B-1, B-2, C-1, C-2, C-3) it can be used for increased residential floorspace (or commercial in some instances). These seven subareas are shown on Map 1.
- After the Core Area Plan was adopted, an additional location in the Core was designated for density bonusing. Sites located immediately east of Cook Street and immediately south of Meares Street that are adjacent to density bonus subareas C-1, C-2 and C-3 are designated in the Official Community Plan (OCP) as Core Residential with base densities of 2.0 FSR and the opportunity for increased density up to approximately 3.5 FSR. The OCP indicates permitted heights in the range of 6 to 8 storeys depending on the location. The bonus density at these sites can be used for residential floorspace.
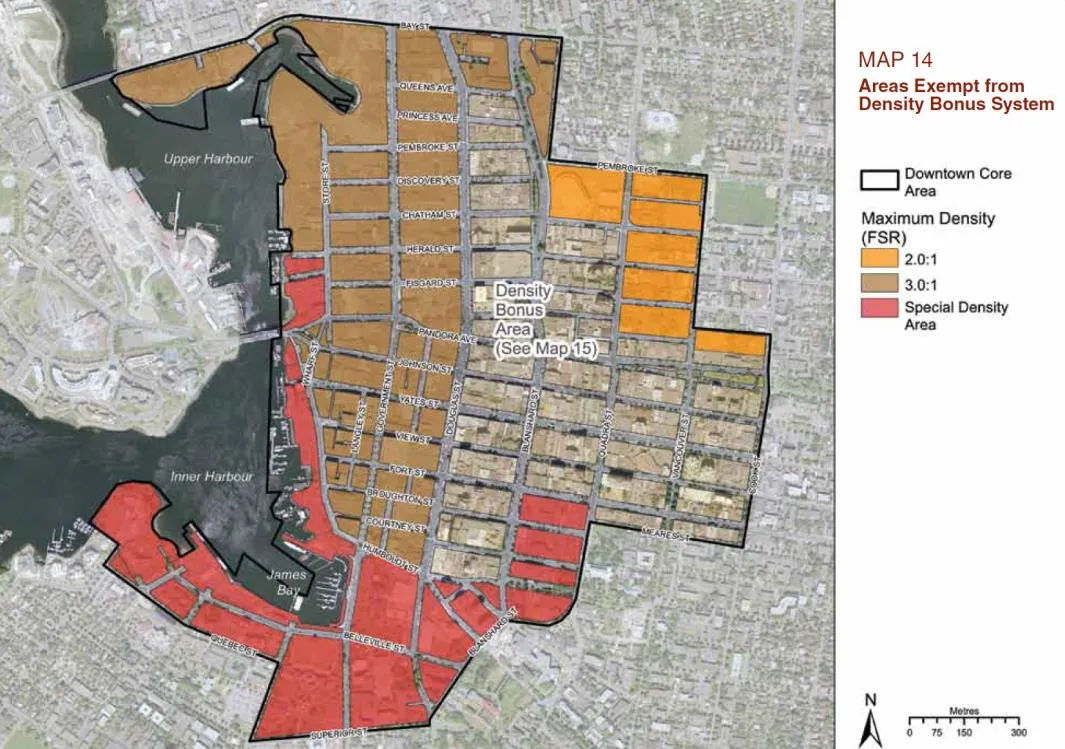
It should be noted that the study area excludes a large portion of the Downtown Core Area including the Historic Commercial area, the Inner Harbour area and most of Rock Bay. The City instructed us to assume that any rezonings (and associated amenity contributions, heritage agreements, or affordable housing contributions) in these areas will continue to be negotiated on a site-by-site basis. Map 2 shows the locations that are excluded from density bonusing and are not part of our analysis.
² Map 15 on page 39 of the Downtown Core Area Plan identifies the locations included in the density bonus system.
2.2 Outside of the Downtown Core Area
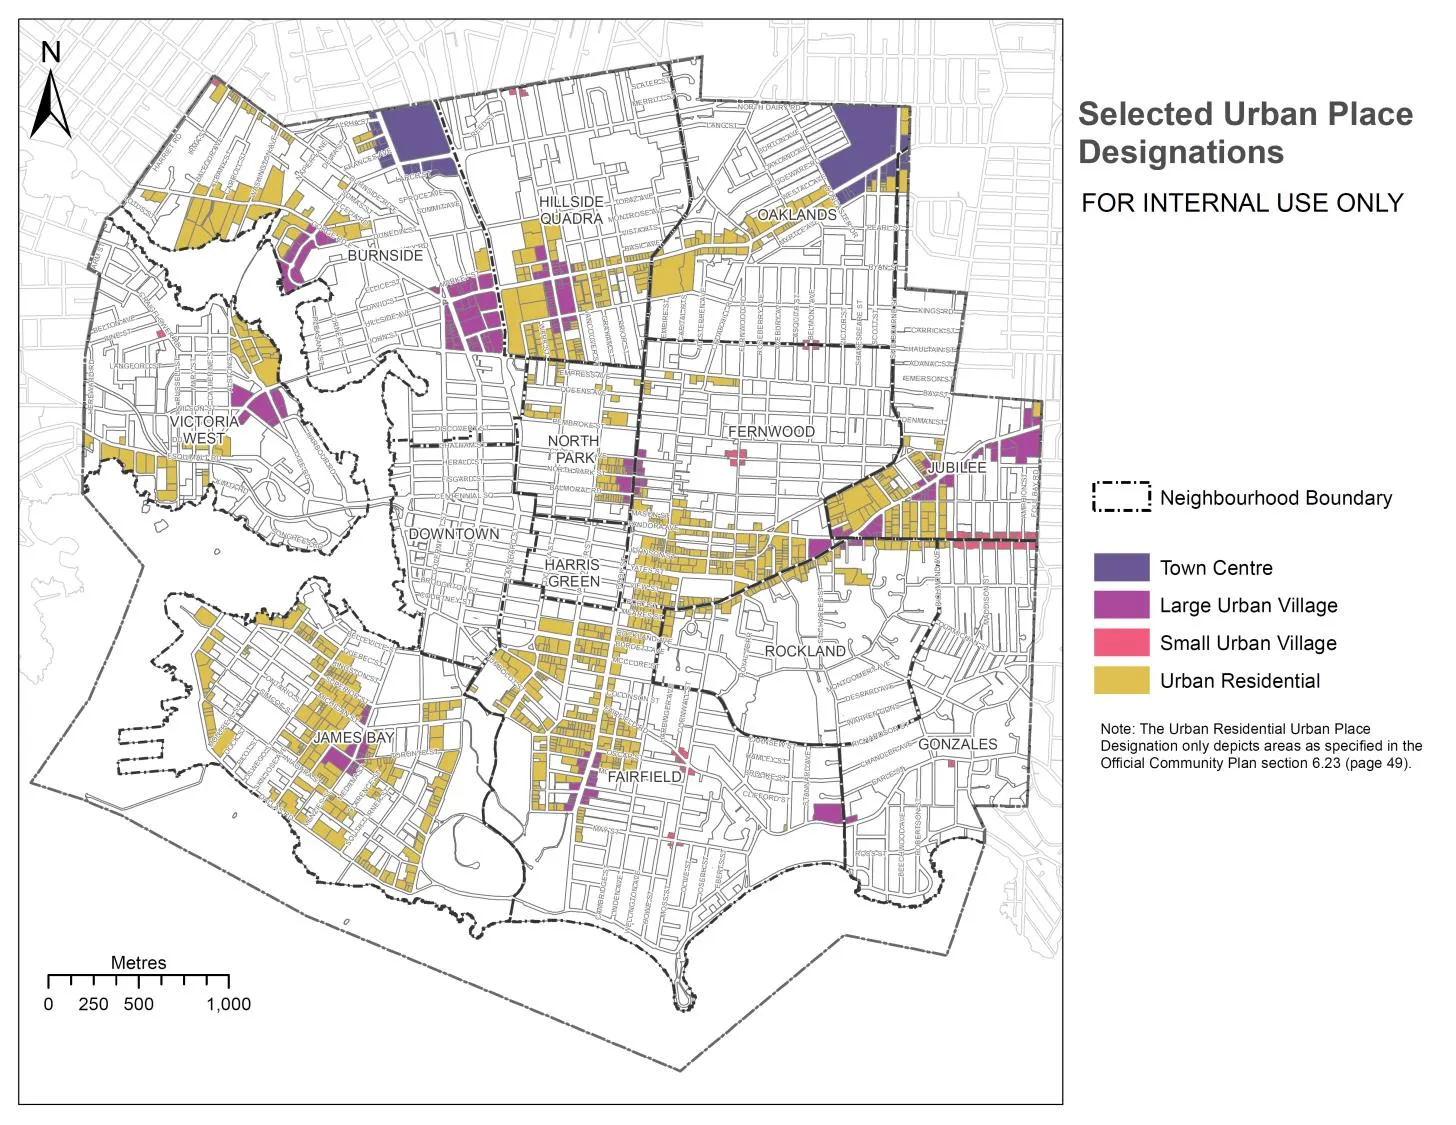
In specific areas outside the Downtown Core Area, the OCP includes base densities and potential discretionary additional density to be considered for some sites in four specific land use categories.
- Town Centres, with base densities of up to 2.0 FSR and increased density up to approximately 3.0 FSR.
- Large Urban Villages, with base densities of up to 1.5 FSR and increased density up to approximately 2.5 FSR.
- Small Urban Villages, with base densities of up to 1.5 FSR and increased density up to approximately 2.0 FSR.
- Urban Residential, with base densities of up to 1.2 FSR and increased density up to approximately 2.0 FSR.
The location of sites in these four OCP designations is shown on Map 3. During 2014 and 2015, we analyzed the financial viability of rezoning and redevelopment of a wide variety of case study sites in these four designations to evaluate the feasibility of implementing a fixed rate target CAC for rezonings outside of the Core Area. Our evaluation of the potential to obtain affordable housing from rezonings outside of the Core Area focuses on sites in these four OCP designations and draws on the work we completed in 2014-2015.
3.0 Analysis for Core Area Study Area
3.1 Evaluation of Potential Fixed Rate CAC
This section summarizes the key findings from our analysis of the potential value of amenity contributions that can be supported by rezonings in the Core Area study area.
The detailed methodology, assumptions and examples of our financial analysis for case study sites are contained in the Attachments.
3.1.1 Approach
To estimate the CAC that is likely supportable from rezonings inside the Downtown Core Area, we analyzed the financial viability of rezoning and redevelopment of a variety of different case study sites in the different density bonus subareas in the Core Area that are the focus of this study.
We used the financial analysis to model the likely performance of rezoning and redeveloping each site under the maximum density identified in the OCP on the assumption that the developer purchases the site at its current market value under existing use and zoning (i.e., the developer does not pay the rezoned value of the site).
Our analysis was completed in six main steps:
- We identified case study sites for the financial analysis. Sites were either vacant (surface parking) or improved with older, low density commercial/service buildings, similar to the types of properties that have been the focus of development in the Core Area over the past several years. We analyzed eight different case study sites (or assemblies of sites). The sites were selected to represent a cross-section of the different locations, zoning districts and existing uses inside of the Downtown Core Area. Sites were selected from each of the different density bonus subareas that are the focus of this study.
- We estimated the existing value of each case study in the absence of any bonus density. For this estimate, we considered three different values:
- The value supported by existing use (i.e., income stream). This is the estimated value that an investor would likely pay to acquire the property to continue to retain the building and collect investment income for the long term.
- The land value under existing zoning.
- The land value under base OCP density. The highest of these three indicators is used as the existing value or “base value” for our analysis.
- We estimated the land value supported if the site was rezoned to the maximum identified in the OCP, with all the permitted bonus density but without any amenity contribution. If the estimated supportable land value with the bonus density is higher than site’s existing value, then site is viable for redevelopment. Otherwise, it is not yet financially viable for rezoning and redevelopment.
- We determined whether rezoning and redevelopment of each case study site is financially viable. To be financially viable for redevelopment, the value of the property as a redevelopment site at the maximum permitted OCP density (with no amenity contribution) must exceed the value of the property under its existing use.
- For the financially viable case study sites, we estimated:
- The increase in property value due to the bonus density (estimated value in step 3 less estimated value in step 2).
- The potential CAC amount at 75% of the increased value (the current City practice for negotiated CACs).
- The equivalent fixed rate CAC in terms of dollars per square foot of floorspace over the base OCP density.
- We completed sensitivity analysis on a few key variables:
- For some sites that are improved with existing low density buildings, we tested the impact on the calculated CAC assuming that the property was vacant (not improved). This reduced the estimated value under existing use and zoning (the existing value) resulting in a higher supportable CAC estimate.
- The City wants to understand the impact on CACs (and affordable housing) of an increase in total permitted density (base plus bonus) beyond the OCP maximum. Therefore, the City asked us to test the impact of increasing the total permitted density (base plus bonus) to 10% beyond the OCP designation. The amount of additional density varies depending on the subarea as the bonus density and maximum OCP density varies by subarea. However, in all sub-areas, the 10% increase in total density results in more than a 10% increase in bonus density.
- For sites east of Cook Street³, we tested the impact on the estimated supportable CAC of the assumed construction material for the new development project. The OCP indicates heights in the range of 6 to 8 storeys in this subarea so it is uncertain whether projects in this area will be built using woodframe (permitted up to 6 storeys) or concrete (required beyond 6 storeys). The change in construction material has an impact on construction costs and development economics so it affects the potential supportable CAC.
³ All of the sites in the density bonus subareas west of Cook Street need to be built in excess of 6 storeys (requiring concrete construction) to achieve the maximum OCP density. Therefore, we did not analyze woodframe scenarios west of Cook Street.
3.1.2 Case Study Financial Analysis for Residential Density Bonus Locations
The bonus floorspace in density bonus subareas B and C as well as the area east of Cook Street can be used for residential use.
Exhibits 1a and 1b summarize the findings of our financial analysis for the six sites we examined in density bonus subareas B and C. For each site, the exhibit shows:
- The density bonus subarea.
- The site size.
- The current use and current zoning.
- The base OCP density and maximum OCP density.
- The assumed number of residential units in the redevelopment scenario.
- The estimated increase in property value due to the permitted bonus density.
- The calculated amenity contribution at 75% of the estimated increase in value due to the bonus density.
- The calculated amenity contribution per square foot of bonus floorspace.
Exhibit 1a: Summary of Estimated Supportable CAC psf of Bonus Floorspace for Sites in Subarea B
| Case Study Sites Number | 4 | 5 | 6 |
|---|---|---|---|
| Redevelopment Scenario | Old Low Density Commercial to 4.5 FSR | Old Low Density Commercial to 4.5 - 5.0 FSR | Old Low Density Commercial to 5.0 FSR |
| Site Size | 20,426 | 21,780 | 14,602 |
| Current Zoning | R3-C | S-1 | S-1 |
| Current Use | Old low density commercial | Old low density commercial + surface parking | Old low density office building |
| Bonus Density Subarea | B-2 | B-1/B-2 | B-1 |
| OCP Base Density (FSR) | 3.0 | 3.0 | 3.0 |
| Potential Bonus Density (FSR) | 1.5 | 2.0/1.5 | 2.0 |
| OCP Maximum Density (FSR) | 4.5 | 4.77 | 5.00 |
| Assumed Total Units in Scenario with Bonus Density | 89 | 101 | 71 |
| Summary of Potential Amenity Contributions (no Affordable Housing) | |||
| Estimated "Base" Value | $2,953,985 | $2,437,649 | $2,215,535 |
| Estimated Supportable Rezoned Land Value with Bonus Density, but no CAC | $3,338,296 | $3,822,152 | $2,675,425 |
| Estimated Increase in Property Value Due to Bonus Density | $384,311 | $1,384,502 | $459,890 |
| Calculated Amenity Contribution at 75% of Increased Value | $288,233 | $1,038,377 | $344,918 |
| Estimated Bonus Density Floorspace | 30,639 | 38,610 | 29,204 |
| Calculated Amenity Contribution psf of Bonus Floorspace | $9.41 | $26.89 | $11.81 |
Exhibit 1b: Summary of Estimated Supportable CAC psf of Bonus Floorspace for Sites in Subarea C
| Case Study Sites Number | 1a | 1b | 1c | 2a | 2b | 2c | 3 |
|---|---|---|---|---|---|---|---|
| Redevelopment Scenario | Old Low Density Commercial to 5.5 FSR | Old Low Density Commercial to 5.5 FSR + 10% Additional | Vacant Site to 5.5 FSR (illustrative) | Old Low Density Commercial to 5.5 FSR | Old Low Density Commercial to 5.5 FSR + 10% Additional | Vacant Site to 5.5 FSR (illustrative) | Vacant Site to 5.5 FSR |
| Site Size | 14,470 | 14,471 | 14,470 | 23,031 | 23,031 | 23,031 | 28,800 |
| Current Zoning | S-1* | S-1* | S-1* | S-2 | S-2 | S-2 | R-48 |
| Current Use | Older low density commercial | Older low density commercial | Assuming site was vacant | Older funeral home | Older funeral home | Assuming site was vacant | Parking lot |
| Bonus Density Subarea | C-1 | C-1 | C-1 | C-3 | C-4 | C-3 | C-3 |
| OCP Base Density (FSR) | 3.0 | 3.0 | 3.0 | 3.0 | 3.0 | 3.0 | 3.0 |
| Potential Bonus Density (FSR) | 2.5 | 3.05 | 2.5 | 2.5 | 3.05 | 2.5 | 2.5 |
| OCP Maximum Density (FSR) | 5.5 | 6.05 | 5.5 | 5.5 | 6.05 | 5.5 | 5.5 |
| Assumed Total Units in Scenario with Bonus Density | 77 | 85 | 77 | 120 | 133 | 120 | 185 |
| Summary of Potential Amenity Contributions (no Affordable Housing) | |||||||
| Estimated "Base" Value | $2,648,613 | $2,648,613 | $1,582,564 | $3,550,932 | $3,550,932 | $2,458,109 | $4,849,998 |
| Estimated Supportable Rezoned Land Value with Bonus Density, but no CAC | $2,905,590 | $3,245,770 | $2,905,590 | $4,630,166 | $5,145,803 | $4,630,166 | $4,105,946 |
| Estimated Increase in Property Value Due to Bonus Density | $256,976 | $597,157 | $1,323,026 | $1,079,234 | $1,594,871 | $2,172,056 | -$744,052 |
| Calculated Amenity Contribution at 75% of Increased Value | $192,732 | $447,868 | $992,269 | $809,425 | $1,196,153 | $1,629,042 | -$558,039 |
| Estimated Bonus Density Floorspace | 36,850 | 44,957 | 36,850 | 57,578 | 70,245 | 57,578 | 72,000 |
| Calculated Amenity Contribution psf of Bonus Floorspace | $5.23 | $9.96 | $26.93 | $14.06 | $17.03 | $28.29 | -$7.75 |
Note: * recently rezoned from S-1 to higher density mixed use.
As shown in Exhibit 1a and 1b:
- Some sites cannot support an amenity contribution as they are more valuable under existing use than as development sites at the maximum OCP density (with no amenity contribution). These sites are not yet financially viable for rezoning and redevelopment.
- For sites that are financially attractive for rezoning and redevelopment, the calculated supportable CAC ranges from about $5 to $29 per square foot of bonus floorspace, depending on the existing use, the density of any existing buildings, and the permitted maximum density.
- The high end of the range is for sites that are vacant, used for surface parking, or built to a very low existing density (i.e. less than 0.3 FSR). We reviewed the number of sites that are used for surface parking in the study area (or built to a very low density). Based on our review, there are very few sites in the study area that would generate a CAC at the high end of our estimated range. Most properties are improved and are built to existing densities in excess of 0.5 FSR and cannot support a CAC at the high end of our estimated range.
- Most of the sites that are improved with older low density buildings are more valuable under existing use than as redevelopment sites at the base density of 3.0 FSR. Therefore, some of the bonus density is required (at no cost to the developer) to make the site financially attractive for redevelopment.
- The calculated supportable CAC ranges from about $5 to $14 per square foot of bonus floorspace for sites that are improved with lower density older buildings, with most in the $10 to $14 range.
- Increasing the permitted density beyond the OCP maximum total density has a positive impact on the estimated supportable CAC. The City asked us to test an increase in permitted total maximum OCP density of 10% (it should be noted that a 10% increase in total density results in an increase in bonus density of more than 10%). A 10% increase in total permitted density at the sites we analyzed, generates an increase of about $3 to $5 per square foot of total bonus floorspace⁴ (the estimated supportable CAC is about $30 to $31 per square foot on the additional 10% bonus floorspace).
Exhibit 2 summarizes the findings of our financial analysis for the two sites we examined in the density bonus area to the east of Cook Street and south of Meares Street. For each site, our analysis assumes redevelopment to 6 storeys assuming woodframe construction. For one site, we re-ran the analysis assuming concrete construction.
⁴ This figure is based on the total bonus floorspace including the additional 10% increase beyond OCP density. If it was calculated solely on the additional floorspace associated the 10% increase in density (which is a smaller amount of floorspace), the rate would be $30 to $31 per square foot.
Exhibit 2: Summary of Estimated Supportable CAC psf of Bonus Floorspace for Sites East of Cook
| Case Study Sites Number | 7 | 8a | 8b |
|---|---|---|---|
| Redevelopment Scenario | Old Low Density Commercial to 3.5 FSR (woodframe) | Old Low Density Commercial to 3.5 FSR (woodframe) | Old Low Density Commercial to 3.5 FSR (concrete) |
| Site Size | 16,554 | 44,690 | 44,690 |
| Current Zoning | C-1 | S-1 | S-1 |
| Current Use | Strip commercial | Car dealership | Car dealership |
| Bonus Density Subarea | east of Cook | east of Cook | east of Cook |
| OCP Base Density (FSR) | 2.0 | 2.0 | 2.0 |
| Potential Bonus Density (FSR) | 1.5 | 1.5 | 1.5 |
| OCP Maximum Density (FSR) | 3.5 | 3.5 | 3.5 |
| Assumed Total Units in Scenario with Bonus Density | 53 | 142 | 143 |
| Summary of Potential Amenity Contributions (no Affordable Housing) | |||
| Estimated "Base" Value | $2,887,000 | $6,097,134 | $6,097,134 |
| Estimated Supportable Rezoned Land Value with Bonus Density, but no CAC | $3,266,258 | $8,887,340 | $5,786,320 |
| Estimated Increase in Property Value Due to Bonus Density | $379,258 | $2,790,206 | -$310,814 |
| Calculated Amenity Contribution at 75% of Increased Value | $284,443 | $2,092,655 | -$233,110 |
| Estimated Bonus Density Floorspace | 24,831 | 67,035 | 67,035 |
| Calculated Amenity Contribution psf of Bonus Floorspace | $11.46 | $31.22 | -$3.48 |
As shown in Exhibit 2:
- The calculated supportable CAC ranges from about $11 to $31 per square foot of bonus floorspace, if rezoning and redevelopment to 3.5 FSR can be achieved at 6 storeys with woodframe construction.
- Based on our review of existing uses and existing built densities at the sites east of Cook Street, few sites could support a CAC at the high end of our estimated range.
- If concrete construction is required (due to a height in excess of 6 storeys), then the rezoning cannot support a CAC.
3.1.3 Case Study Financial Analysis for Commercial Density Bonus Locations
Density bonus subarea A-1 has a base density of 3.0 FSR (residential) to 4.0 FSR (commercial or mixed use) with the opportunity for bonus density up to a maximum of 6.0. Density bonus subarea A-2 has a base density of 3.0 FSR with the opportunity for bonus density up to a maximum of 5.0. However, in both subareas, the bonus density cannot be used for residential floorspace. It can only be used for additional upper floor commercial space, such as office space.
We analyzed rezoning and redevelopment of two different case study sites in these subareas. For each site, we analyzed two rezoning and redevelopment scenarios:
- A scenario that assumes the site is redeveloped entirely as commercial space (retail plus office) up to the maximum OCP density.
- A scenario that assumes the base density is residential (or mixed residential and retail) and the bonus floorspace is office space.
Exhibit 3 summarizes the findings of our financial analysis for the two sites.
Exhibit 3: Summary of Estimated Supportable CAC psf of Bonus Floorspace for Bonus Area A
| Case Study Site Number | 1a | 1b | 2a | 2b |
|---|---|---|---|---|
| Development Scenario | Residential and Commercial Base + Office Bonus 6.0 FSR | Office Base + Office Bonus 6.0 FSR | Residential Base + Office Bonus 5.0 FSR | Office Base + Office Bonus 5.0 FSR |
| Site Size | 21,600 | 21,600 | 43,566 | 43,566 |
| Current Zoning | CA-4 | CA-4 | T-1 | T-1 |
| Current Use | Surface Parking | Surface Parking | Older Motel | Older Motel |
| Bonus Density Subarea | A-1 | A-1 | A-2 | A-2 |
| OCP Base Density (FSR) | 4.0 | 4.0 | 3.0 | 3.0 |
| Potential Bonus Density (FSR) | 2.0 | 2.0 | 2.0 | 2.0 |
| OCP Maximum Density (FSR) | 6.0 | 6.0 | 5.0 | 5.0 |
| Assumed Total Office Floorspace in Scenario with Bonus Density (sf) | 57,240 | 122,040 | 71,884 | 202,582 |
| Summary of Potential Amenity Contributions | ||||
| Estimated Increase in Property Value Due to Bonus Office Density | $236,713 | $24,401 | $580,475 | $117,360 |
| Calculated Amenity Contribution at 75% of Increased Value | $177,535 | $18,301 | $435,356 | $88,020 |
| Estimated Bonus Density Floorspace | 43,200 | 43,200 | 87,132 | 87,132 |
| Calculated Amenity Contribution psf of Bonus Floorspace | $4.11 | $0.42 | $5.00 | $1.01 |
As shown in the Exhibit 3:
- The calculated supportable CAC ranges from about $0 to $1 per square foot of bonus office floorspace for projects that are entirely commercial (retail plus office).
- For projects where the base density is residential (or residential and retail) and the bonus density is office space, the calculated supportable CAC ranges from about $4 to $5 per square foot of bonus office floorspace. This may be optimistic as it assumes that there are no extraordinary development costs associated with mixing the office space and the residential space. In addition, it assumes the office space can be leased at rates near the upper of Downtown Victoria office rents. Some sites in the density bonus area may not be able to achieve rents at the upper end of the office market as they are located on the periphery of the Downtown CBD.
3.1.4 Key Implications
The key implications of our CAC analysis for sites in the Core Area are as follows:
- Many sites in the Core Area cannot support an amenity contribution as they are more valuable under existing use than as redevelopment sites at the maximum OCP density (with no amenity contribution). These sites are not yet financially viable for rezoning and redevelopment.
- For sites that are financially attractive for rezoning and redevelopment, the calculated supportable CAC ranges from about:
- $5 to $29 per square foot of bonus floorspace in subareas B and C, depending on the existing use, the density of any existing buildings, and the permitted maximum density.
- $11 to $31 per square foot of bonus floorspace for sites east of Cook Street, depending on the existing use and the density of any existing buildings. This assumes that the OCP maximum of 3.5 FSR for sites East of Cook can be achieve using woodframe construction (6 storey or less). If projects need to be taller than 6 storeys (requiring concrete construction) to achieve 3.5 FSR, then rezonings east of Cook will not support an amenity contribution.
- The high end of the estimated CAC range is for sites that are vacant, used for surface parking, or built to a very low existing density. However, based on our review of the existing built densities and uses in the study area, there are very few sites in the study area that would generate a CAC at the upper end of our estimated range.
- Most of the sites that are redevelopment candidates in the study area are improved with older low density buildings. These sites are more valuable under existing use than as redevelopment sites at the base density. Therefore, some of the bonus density is required (at no cost to the developer) to make the site financially attractive for redevelopment. This reduces the potential amenity contribution per square foot of bonus floorspace.
- The calculated supportable CAC at most of the sites that we analyzed is in the $10 to $14 per square foot of bonus residential floorspace.
- Increasing the available bonus density increases the supportable CAC per square foot. The City asked us to test an increase in permitted total maximum OCP density of 10% (it should be noted that a 10% increase in total density results in an increase in bonus density of more than 10%). The 10% increase in total permitted density at the sites we analyzed generates a supportable CAC of about $30 to $31 per square foot on the additional 10% of floorspace.
- Bonus office floorspace supports a very low CAC per square foot. In addition, office projects tend to have a positive economic impact on the City. Therefore, the City should consider exempting office rezonings from CACs.
There is clearly an opportunity for some rezonings in the Core Area to provide a contribution toward CACs. The City will need to decide whether it wants to use this CAC potential to create amenities in the Core Area or use it to obtain affordable housing units (which is explored in the next section).
3.2 Evaluation of Potential Affordable Housing Contributions from Rezonings in the Core Area
The City asked us to examine the implications of using the potential CAC value from rezonings in the Core Area to support new affordable housing rather than other amenities.
An affordable housing contribution will reduce (or eliminate) the opportunity to obtain contributions for other amenities from a rezoning project. Therefore, our estimates of the opportunity for affordable housing contributions from the case study sites are instead of (not as well as) the CAC potential evaluated in Section 3.1.
3.2.1 Affordable Housing Assumptions
The amount of affordable housing that can be negotiated as part of a rezoning application depends on the impact that the affordable housing component will have on overall project revenues and overall project costs. Therefore, to evaluate the opportunity for a rezoning to provide affordable housing, it is important to define the type of affordable housing being sought by the City and the key characteristics that will affect the completed value and creation costs of the affordable housing.
The City asked us to evaluate the potential under four different affordable housing scenarios.
- Affordable market rental housing with monthly rents set at 100% of HILs⁵. The units could be retained by the developer or sold to an investor. Based on input from the City, we made the following key assumptions:
- The off-street parking requirement would be 0.5 stalls per affordable housing unit.
- The affordable housing mix would include 15% studio units, 60% 1 BR units and 25% 2 BR units.
- The overall average net rentable unit size would be about 640 sf.
- The average monthly rental rate would be about $895 per month.
- Affordable market rental housing with monthly rents set at 90% of HILs. The units could be retained by the developer or sold to an investor. Based on input from the City, we made the following assumptions:
- The off-street parking requirement would be 0.5 stalls per affordable housing unit.
- The affordable housing mix would include 15% studio units, 60% 1 BR units and 25% 2 BR units.
- The overall average net rentable unit size would be about 640 sf.
- The average monthly rental rate would be about $805 per month.
- Affordable market rental housing with monthly rents set at 50% of HILs. The units could be retained by the developer or sold to an investor. Based on input from the City, we made the following assumptions:
- No off-street parking would be required for the affordable housing units (due to the large discount in rents).
- The affordable housing mix would include 15% studio units, 60% 1 BR units and 25% 2 BR units.
- The overall average net rentable unit size would be about 640 sf.
- The average monthly rental rate would be about $450 per month.
- Affordable ownership strata apartment units aimed at households earning $50,000 to $60,000 per year. The units would be sold by the developer. We assume that the City would be involved in the administration associated with the creation of an initial list of eligible purchasers for the units and in enforcing restrictions on the resale prices of the units. Based on input from the City, we made the following assumptions:
- The off-street parking requirement would be based on the City’s bylaw requirement for apartment units.
- The affordable housing mix would include 50% 1 BR units and 50% 2 BR units.
- The overall average net rentable unit size would be about 750 sf.
- Average unit prices would be $195,000 for 1 BR units and $245,000 for 2 BR units⁶.
It is important to note that any change in these affordable housing assumptions would affect the results of our analysis.
⁵ According to the City of Victoria, the Provincial government’s Housing Income Limits (HILs) rents for the study area are currently $728 per month for studio units, $863 per month for 1 BR units and $1,075 per month for 2 BR units. ⁶ These maximum unit prices are intended to target purchasers with household incomes of $50,000 (1 BR units) to $60,000 (2 BR units).
3.2.2 Approach
We used the results of our financial analysis for each of our case study sites in Section 3.1 to estimate the potential amount of affordable housing that could be supported by rezonings in the Core Area.
Our affordable housing estimates focus on the strata residential (or mixed strata residential and commercial) sites. The office sites were excluded from our affordable housing analysis on the assumption that office projects would not include affordable housing.
For each case study site and for each of the four affordable housing scenarios, we estimated the amount of affordable housing that could be funded by the calculated total value of the amenity contribution (i.e. 75% of the estimated increase in property value associated with the bonus floorspace).
The affordable housing component is assumed to replace space that would otherwise have been used for strata residential. Because the affordable housing has less value than the strata residential space, it negatively impacts the financial performance of the overall project and reduces the estimated increase in value associated with the bonus floorspace. For our calculations we determined the “net cost” per square foot of the affordable housing component for each of the four different types of affordable housing. The net cost was determined as follows:
- Estimated completed value per square foot of the affordable housing.
- Less total cost (and profit margin) per square foot of the affordable housing.
- Less completed value per square foot of the forgone strata residential space.
- Plus total cost (and profit margin) of the foregone strata residential space.
- Equals net cost per square foot of the affordable housing.
Our estimates assume that all of the calculated amenity contribution value is used to fund affordable housing, leaving no room for contributions toward other amenities.
Therefore, our estimates assume that each rezoning provides affordable housing, but no additional amenity contribution.
3.2.3 Summary of Estimates of Supportable Affordable Housing
Exhibits 4a and 4b summarize our findings for the six case sites that we examined in density bonus subareas B and C. For each site, the exhibit shows:
- The density bonus subarea.
- The site size.
- The current use and current zoning.
- The base OCP density and maximum OCP density.
- The assumed number of residential units in the redevelopment scenario.
- The estimated increase in property value due to the permitted bonus density (in the absence of any affordable housing or amenity contribution).
- The calculated amenity contribution at 75% of the estimated increase in value due to the bonus density in the absence of any affordable housing.
- The estimated amount of affordable housing that can be funded by 75% of the estimated increase in value created by the bonus density for each of the four affordable housing scenarios. This affordable housing potential is expressed in a variety of different ways, including (a) the total square footage of affordable housing floorspace (gross square feet), (b) the share of bonus floorspace allocated to affordable housing, (c) the maximum number of affordable housing units supportable by the project and (d) the maximum share of affordable housing units in the total project.
Exhibit 4a: Estimated Supportable Amount of Affordable Housing from Rezonings in Subareas B
| Subarea | Sites in Downtown Core Area Plan | ||
|---|---|---|---|
| Case Study Sites Number | 4 | 5 | 6 |
| Redevelopment Scenario | Old Low Density Commercial to 4.5 FSR | Old Low Density Commercial to 4.5 to 5.0 FSR | Old Low Density Commercial to 5.0 FSR |
| Site Size | 20,426 | 21,780 | 14,602 |
| Current Zoning | R3-C | S-1 | S-1 |
| Current Use | Old low density commercial | Old low density commercial + surface parking | Old low density office building |
| Bonus Density Subarea | B-2 | B-1/B-2 | B-1 |
| OCP Base Density (FSR) | 3.0 | 3.0 | 3.0 |
| Potential Bonus Density (FSR) | 1.5 | 2.0/1.5 | 2.0 |
| OCP Maximum Density (FSR) | 4.5 | 4.77 | 5.00 |
| Assumed Total Units in Scenario with Bonus Density | 89 | 101 | 71 |
| 1. Estimated Maximum Potential CAC psf of Bonus Floorspace assuming 75% of Estimated Increase in Value Allocated to CAC | |||
| Summary of Potential Amenity Contributions (no Affordable Housing) | |||
| Estimated "Base" Value | $2,953,985 | $2,437,649 | $2,215,535 |
| Estimated Supportable Rezoned Land Value with Bonus Density, but no CAC | $3,338,296 | $3,822,152 | $2,675,425 |
| Estimated Increase in Property Value Due to Bonus Density | $384,311 | $1,384,502 | $459,890 |
| Calculated Amenity Contribution at 75% of Increased Value | $288,233 | $1,038,377 | $344,918 |
| Estimated Bonus Density Floorspace | 30,639 | 38,610 | 29,204 |
| 2. Estimated Maximum Negotiable Affordable Housing at OCP Maximum Density Assuming 75% of Increased Value Allocated Toward Affordable Housing | |||
| Estimated Maximum Potential Affordable Gross Floorspace (sf), assuming CAC is the Affordable Housing | |||
| a Rental at 50% of HILs (avg rent = $450 per month) | 1,048 | 3,776 | 1,254 |
| b Rental at 90% of HILs (avg rent = $805 per month) | 1,406 | 5,065 | 1,683 |
| c Rental at 100% of HILs (avg rent = $895 per month) | 1,558 | 5,613 | 1,864 |
| d Affordable Ownership | 1,988 | 7,161 | 2,379 |
| Share of Bonus Floorspace | |||
| a Rental at 50% of HILs | 3% | 10% | 4% |
| b Rental at 90% of HILs | 5% | 13% | 6% |
| c Rental at 100% of HILs | 5% | 15% | 6% |
| d Affordable Ownership | 6% | 19% | 8% |
| Estimated Maximum Potential Affordable Units (rounded), assuming no CAC | |||
| a Rental at 50% of HILs (avg rent = $450 per month) | 1 | 5 | 2 |
| b Rental at 90% of HILs (avg rent = $805 per month) | 2 | 7 | 2 |
| c Rental at 100% of HILs (avg rent = $895 per month) | 2 | 7 | 2 |
| d Affordable Ownership | 2 | 8 | 3 |
| Share of Total Units in Project | |||
| a Rental at 50% of HILs | 2% | 5% | 2% |
| b Rental at 90% of HILs | 2% | 7% | 3% |
| c Rental at 100% of HILs | 2% | 7% | 4% |
| d Affordable Ownership | 3% | 8% | 4% |
Exhibit 4b: Estimated Supportable Amount of Affordable Housing from Rezonings in Subareas C
| Subarea | Sites in Downtown Core Area Plan | ||||||
|---|---|---|---|---|---|---|---|
| Case Study Sites Number | 1a | 1b | 1c | 2a | 2b | 2c | 3 |
| Redevelopment Scenario | Old Low Density Commercial to 5.5 FSR | Old Low Density Commercial to 5.5 FSR + 10% Additional | Vacant Site to 5.5 FSR (illustrative) | Old Low Density Commercial to 5.5 FSR | Old Low Density Commercial to 5.5 FSR + 10% Additional | Vacant Site to 5.5 FSR (illustrative) | Vacant Site to 5.5 FSR |
| Site Size | 14,470 | 14,471 | 14,470 | 23,031 | 23,031 | 23,031 | 28,800 |
| Current Zoning | S-1 | S-1 | S-1 | S-2 | S-2 | S-2 | R-48 |
| Current Use | Older low density commercial | Older low density commercial | Assuming site was vacant | Older funeral home | Older funeral home | Assuming site was vacant | Parking lot |
| Bonus Density Subarea | C-1 | C-1 | C-1 | C-3 | C-4 | C-3 | C-3 |
| OCP Base Density (FSR) | 3.0 | 3.0 | 3.0 | 3.0 | 3.0 | 3.0 | 3.0 |
| Potential Bonus Density (FSR) | 2.5 | 3.05 | 2.5 | 2.5 | 3.05 | 2.5 | 2.5 |
| OCP Maximum Density (FSR) | 5.5 | 6.05 | 5.5 | 5.5 | 6.05 | 5.5 | 5.5 |
| Assumed Total Units in Scenario with Bonus Density | 77 | 85 | 77 | 120 | 133 | 120 | 185 |
| 1. Estimated Maximum Potential CAC psf of Bonus Floorspace assuming 75% of Estimated Increase in Value Allocated to CAC | |||||||
| Summary of Potential Amenity Contributions (no Affordable Housing) | |||||||
| Estimated "Base" Value | $2,648,613 | $2,648,613 | $1,582,564 | $3,550,932 | $3,550,932 | $2,458,109 | $4,849,998 |
| Estimated Supportable Rezoned Land Value with Bonus Density, but no CAC | $2,905,590 | $3,245,770 | $2,905,590 | $4,630,166 | $5,145,803 | $4,630,166 | $4,105,946 |
| Estimated Increase in Property Value Due to Bonus Density | $256,976 | $597,157 | $1,323,026 | $1,079,234 | $1,594,871 | $2,172,056 | -$744,052 |
| Calculated Amenity Contribution at 75% of Increased Value | $192,732 | $447,868 | $992,269 | $809,425 | $1,196,153 | $1,629,042 | -$558,039 |
| Estimated Bonus Density Floorspace | 36,850 | 44,957 | 36,850 | 57,578 | 70,245 | 57,578 | 72,000 |
| 2. Estimated Maximum Negotiable Affordable Housing at OCP Maximum Density Assuming 75% of Increased Value Allocated Toward Affordable Housing | |||||||
| Estimated Maximum Potential Affordable Gross Floorspace (sf), assuming CAC is the Affordable Housing | |||||||
| a Rental at 50% of HILs (avg rent = $450 per month) | 701 | 1,629 | 3,608 | 2,943 | 4,350 | 5,924 | -2,029 |
| b Rental at 90% of HILs (avg rent = $805 per month) | 940 | 2,185 | 4,840 | 3,948 | 5,835 | 7,947 | -2,722 |
| c Rental at 100% of HILs (avg rent = $895 per month) | 1,042 | 2,421 | 5,364 | 4,375 | 6,466 | 8,806 | -3,016 |
| d Affordable Ownership | 1,329 | 3,089 | 6,843 | 5,582 | 8,249 | 11,235 | -3,849 |
| Share of Bonus Floorspace | |||||||
| a Rental at 50% of HILs | 2% | 4% | 10% | 5% | 6% | 10% | -3% |
| b Rental at 90% of HILs | 3% | 5% | 13% | 7% | 8% | 14% | -4% |
| c Rental at 100% of HILs | 3% | 5% | 15% | 8% | 9% | 15% | -4% |
| d Affordable Ownership | 4% | 7% | 19% | 10% | 12% | 20% | -5% |
| Estimated Maximum Potential Affordable Units (rounded), assuming no CAC | |||||||
| a Rental at 50% of HILs (avg rent = $450 per month) | 1 | 2 | 5 | 4 | 6 | 8 | -3 |
| b Rental at 90% of HILs (avg rent = $805 per month) | 1 | 3 | 6 | 5 | 8 | 11 | -4 |
| c Rental at 100% of HILs (avg rent = $895 per month) | 1 | 3 | 7 | 6 | 9 | 12 | -4 |
| d Affordable Ownership | 2 | 4 | 8 | 6 | 9 | 13 | -4 |
| Share of Total Units in Project | |||||||
| a Rental at 50% of HILs | 1% | 3% | 6% | 3% | 4% | 7% | -1% |
| b Rental at 90% of HILs | 2% | 3% | 8% | 4% | 6% | 9% | -2% |
| c Rental at 100% of HILs | 2% | 4% | 9% | 5% | 6% | 10% | -2% |
| d Affordable Ownership | 2% | 4% | 10% | 5% | 7% | 11% | -2% |
As shown in the Exhibits 4a and 4b:
- The amount of affordable housing that can be supported by a rezoning varies depending on the type of affordable housing. As the required discount in rents (or sales prices) increases, the amount of affordable housing that is supportable by the project decreases.
- The cost of creating the affordable housing (in all scenarios) is higher than the completed value of the affordable housing, so a significant share of the bonus floorspace needs to be allocated to market strata housing in order to off-set the losses incurred on the affordable housing units. If strata residential unit prices increase, the share of the bonus floorspace that needs to be allocated to market strata housing would decline.
- The total number of affordable housing units that can be supported at the case study sites that we analyzed ranges depending on the value of the site under its existing use, the amount of bonus density available, and the type of affordable housing. The amount of affordable housing that is supportable at the case studies we analyzed is summarized in the Exhibit 5.
Exhibit 5: Summary of Supportable Amount of Affordable Housing from Rezonings in Subareas B and C
| Affordable Housing Scenario | Total Supportable Affordable Housing Units | Share of Total Units in Project | Affordable Housing’s Share of Bonus Floorspace |
|---|---|---|---|
| 50% of HILs | 1 to 8 units | 1% to 7% | 2% to 10% |
| 90% of HILs | 1 to 11 units | 2% to 9% | 3% to 14% |
| 100% of HILs | 1 to 13 units | 2% to 10% | 3% to 15% |
| Affordable Ownership | 2 to 13 units | 2% to 11% | 4% to 20% |
The upper end of these ranges is for case study sites that are vacant, used for surface parking, or built to a very low existing density. We reviewed the number of sites that are used for surface parking in the study area (or built to a very low existing density). Based on our review, there are very few sites in the study area that would generate affordable housing at the high end of our estimated ranges.
- The estimated amount of affordable housing that is supportable from most rezoning candidates (sites that are improved with lower density older buildings) is shown in the Exhibit 6.
Exhibit 6: Summary of Supportable Affordable Housing at Most Rezoning Candidates in Areas B and C
| Affordable Housing Scenario | Total Supportable Affordable Housing Units | Share of Total Units in Project | Affordable Housing’s Share of Bonus Floorspace |
|---|---|---|---|
| 50% of HILs | 1 to 4 units | 1% to 3% | 2% to 5% |
| 90% of HILs | 1 to 5 units | 2% to 4% | 3% to 7% |
| 100% of HILs | 1 to 6 units | 2% to 5% | 3% to 8% |
| Affordable Ownership | 2 to 6 units | 2% to 5% | 4% to 10% |
- Increasing the available bonus density increases the affordable housing that can be supported by a rezoning. The City asked us to test the impact of increasing the total permitted OCP density by 10% at some of the case study sites (it should be noted that a 10% increase in total density results in an increase in bonus density of more than 10%). We estimate that about 15% of the floor area associated with the additional 10% of total density could be allocated to affordable housing if the affordable housing is comprised of rental units with rents set at 100% of HILs. The share would be lower if rents were set below the HILs rate.
Exhibit 7 summarizes our findings for the two sites that we examined in the density bonus area to the east of Cook Street and south of Meares Street. For each site, our analysis assumes redevelopment to 6 storeys assuming woodframe construction. For one site, we re-ran the analysis assuming concrete construction.
Exhibit 7: Estimated Supportable Amount of Affordable Housing from Rezonings East of Cook
| Redevelopment Scenario | Old Low Density Commercial to 3.5 FSR (woodframe) | Old Low Density Commercial to 3.5 FSR (woodframe) | Old Low Density Commercial to 3.5 FSR (concrete) |
|---|---|---|---|
| Site Size | 16,554 | 44,690 | 44,690 |
| Current Zoning | C-1 | S-1 | S-1 |
| Current Use | Strip commercial | Car dealership | Car dealership |
| Bonus Density Subarea | east of Cook | east of Cook | east of Cook |
| OCP Base Density (FSR) | 2.0 | 2.0 | 2.0 |
| Potential Bonus Density (FSR) | 1.5 | 1.5 | 1.5 |
| OCP Maximum Density (FSR) | 3.5 | 3.5 | 3.5 |
| Assumed Total Units in Scenario with Bonus Density | 53 | 142 | 143 |
| Summary of Potential Amenity Contributions (no Affordable Housing) | |||
| Estimated "Base" Value | $2,887,000 | $6,097,134 | $6,097,134 |
| Estimated Supportable Rezoned Land Value with Bonus Density, but no CAC | $3,266,258 | $8,887,340 | $5,786,320 |
| Estimated Increase in Property Value Due to Bonus Density | $379,258 | $2,790,206 | -$310,814 |
| Calculated Amenity Contribution at 75% of Increased Value | $284,443 | $2,092,655 | -$233,110 |
| Estimated Bonus Density Floorspace | 24,831 | 67,035 | 67,035 |
| 2. Estimated Maximum Negotiable Affordable Housing at OCP Maximum Density Assuming 75% of Increased Value Allocated Toward Affordable Housing | |||
| Estimated Maximum Potential Affordable Gross Floorspace (sf), assuming CAC is the Affordable Housing | |||
| a Rental at 50% of HILs (avg rent = $450 per month) | 1,210 | 8,905 | -848 |
| b Rental at 90% of HILs (avg rent = $805 per month) | 1,724 | 12,683 | -1,137 |
| c Rental at 100% of HILs (avg rent = $895 per month) | 1,962 | 14,432 | -1,260 |
| d Affordable Ownership | 2,586 | 19,024 | -1,608 |
| Share of Bonus Floorspace | |||
| a Rental at 50% of HILs | 5% | 13% | -1% |
| b Rental at 90% of HILs | 7% | 19% | -2% |
| c Rental at 100% of HILs | 8% | 22% | -2% |
| d Affordable Ownership | 10% | 28% | -2% |
| Estimated Maximum Potential Affordable Units (rounded), assuming no CAC | |||
| a Rental at 50% of HILs (avg rent = $450 per month) | 2 | 12 | -1 |
| b Rental at 90% of HILs (avg rent = $805 per month) | 2 | 17 | -2 |
| c Rental at 100% of HILs (avg rent = $895 per month) | 3 | 19 | -2 |
| d Affordable Ownership | 3 | 22 | -2 |
| Share of Total Units in Project | |||
| a Rental at 50% of HILs | 3% | 8% | -1% |
| b Rental at 90% of HILs | 4% | 12% | -1% |
| c Rental at 100% of HILs | 5% | 14% | -1% |
| d Affordable Ownership | 6% | 15% | -1% |
As shown in Exhibit 7:
- The total number of affordable housing units that can be supported at these case study sites ranges depending on the property value under its existing use, the type of affordable housing and the construction material (wood or concrete). Exhibit 8 summarizes our estimates assuming the rezoned projects are built using woodframe construction.
Exhibit 8: Summary of Supportable Affordable Housing at Rezonings East of Cook Street (woodframe)
| Affordable Housing Scenario | Total Supportable Affordable Housing Units | Share of Total Units in Project | Affordable Housing’s Share of Bonus Floorspace |
|---|---|---|---|
| 50% of HILs | 1 to 12 units | 3% to 8% | 5% to 13% |
| 90% of HILs | 2 to 17 units | 4% to 12% | 7% to 19% |
| 100% of HILs | 3 to 19 units | 5% to 14% | 8% to 22% |
| Affordable Ownership | 3 to 22 units | 6% to 15% | 10% to 28% |
The upper end of these ranges is for case study sites that are vacant, used for surface parking, or built to a very low existing density. We reviewed the number of sites that are used for surface parking in the study area (or built to a very low existing density). Based on our review, there are very few sites in the study area that would generate affordable housing at the high end of our estimated ranges.
- If concrete construction is required (due to a height in excess of 6 storeys), then rezonings in this subarea cannot support any affordable housing (under current market conditions).
3.3 Summary of Core Area Analysis
3.3.1 Target Fixed Rate CAC Analysis
- Many sites in the study area are not rezoning candidates in the foreseeable future because:
- The site is more valuable under its existing use than as a development site at the maximum OCP density (with no amenity contribution) or
- The existing zoning permits a higher density than permitted under the OCP designation (e.g. R-48 sites). Therefore, we would expect the number of rezoning applications in the study area to be small in any given year.
- For sites that are financially attractive for rezoning and redevelopment, the calculated supportable CAC varies significantly across different sites in the Core Area, ranging from about:
- $5 to $29 per square foot of bonus floorspace in subareas B and C, depending on the existing use, the density of any existing buildings, and the permitted maximum density.
- $11 to $31 per square foot of bonus floorspace for sites east of Cook Street, depending on the existing use and the density of any existing buildings. This assumes that the OCP maximum of 3.5 FSR for sites East of Cook can be achieve using woodframe construction (6 storey or less). If projects need to be taller than 6 storeys (requiring concrete construction) to achieve 3.5 FSR, then rezonings east of Cook will not support an amenity contribution.
- The high end of the estimated CAC range is for sites that are vacant, used for surface parking, or built to a very low existing density. However, based on our review of existing built densities and uses in the study area, there are very few sites in the study area that would generate a CAC at the upper end of our estimated range.
- The calculated supportable CAC at most of the sites that we analyzed is in the $10 to $14 per square foot of bonus strata residential floorspace. A fixed rate target would need to be set within this range in order to avoid negative impacts on most rezonings. However:
- Some rezonings could make a significantly larger CAC contribution under the current negotiated approach.
- Some types of rezonings will not be able to support this CAC rate and would likely need to negotiate the rate lower.
- Any increase in strata unit sales prices will have a material impact on the CAC rate that is supportable at rezonings in the Core Area. Therefore, the supportable rate could increase over time if there is escalation in strata unit prices.
- Increasing the permitted maximum density has a positive impact on the estimated supportable CAC rate. We estimate that the supportable CAC on any strata residential floorspace beyond the current OCP maximum total density supports a CAC of about $30 to $31 per square foot on the additional floorspace.
- Bonus office floorspace supports a very low CAC per square foot. In addition, office projects generate significant positive economic impacts in comparison to residential projects. The City should consider exempting office rezonings from CACs.
3.3.2 Affordable Housing Analysis
- The financial ability of apartment rezonings to provide affordable housing varies significantly depending on the definition of affordable housing. Therefore, if the City wants to define an affordable housing target or requirement for rezonings, it should clearly define the type of affordable housing that the City wants rezonings to provide. For example, the City should identify whether the affordable housing will be rental or ownership, the discount from market rents (or sales prices), any minimum unit size requirements, the amount of off-street parking that will be required, and the preferred location of the affordable housing units within an overall project. Without this information (plus the amount of affordable housing required), developers will not be able to anticipate the impact of an affordable housing policy on the financial performance of a planned rezoning. This will make it difficult to plan projects and acquire sites at prices that make rezoning and redevelopment financially viable.
- The cost of creating affordable housing (as tested for our analysis) is higher than the value of the completed affordable housing units. Therefore, a significant share of any bonus floorspace will need to be allocated to strata market residential space in order to off-set the losses to the developer from the affordable housing component. In addition, a portion of the bonus floorspace (at most sites) is required (with no amenity contribution or affordable housing contribution) to make rezoning and redevelopment financially viable. The combination of these two factors means that most rezonings in the study area will not support a significant amount of affordable housing (under current market conditions). For the sites and affordable housings scenarios that we tested inside the Core Area, most projects will only be able to provide a small share of affordable housing (3% to 8% of total bonus floorspace). The amount that is supportable depends on the City’s definition of affordable housing.
- Increasing the available bonus density beyond the existing maximum OCP density increases the affordable housing that can be supported by a rezoning. We estimate that about 15% of the floor area associated with any additional density beyond the current total OCP maximum density could be allocated to affordable housing if the affordable housing is comprised of rental units with rents set at 100% of HILs. The share would be lower if rents were set below the HILs rate.
- An affordable housing contribution reduces (or eliminates) the potential for a rezoning to make contributions toward other types of amenities (such as public realm improvements or contributions toward the seismic improvement fund)⁷. Therefore, if the City wants to obtain amenity contributions as well as affordable housing from individual projects, any affordable housing component will need to be calibrated to leave room for other amenity contributions. This would further reduce the amount of affordable housing that can be supported by a rezoning.
- Depending on the target market for the affordable units and the strata market units, an affordable housing requirement could impact the marketability of the market units in the project given that the units will be mixed within the same building. In addition, the affordable housing units could create other issues for the developer, such as a requirement for legal agreements (with the City) as well as different unit finishing specifications and a separate marketing approach for the affordable units.
- An affordable housing requirement will create administrative and management work for the City.
- Unless a project is very large, the total number of affordable housing units that it can support will be very low. For example, our analysis suggests that a 100-unit project could support a maximum of about 5 affordable housing units (or less depending on the definition of affordable housing). Given that the inclusion of affordable housing within a project will create impacts on the developer’s plans and create an administrative load on the City, the City should consider setting a project size threshold below which the City would seek a cash-in-lieu contribution of affordable housing units.
⁷ The estimated impact on the supportable CAC from one affordable housing unit is as follows (under the definitions in Section 3.2.1):
- At 50% of HILs, $206,250 per concrete unit and $176,250 per woodframe unit.
- At 90% of HILs, $153,750 per concrete unit and $123,750 per woodframe unit.
- At 100% of HILs, $138,750 per concrete unit and $108,750 per woodframe unit.
- For affordable ownership units, $127,600 per concrete unit and $96,800 per woodframe unit.
3.4 Policy Options to Consider for Sites in the Core Area
3.4.1 Identification of Policy Options
Because the ability of a rezoning to provide public benefits is finite, the City needs to decide on an allocation of any contributions between affordable housing and other amenities. For example, the City could decide to only seek contributions toward amenities, but not affordable housing units. This could be done through a fixed rate CAC target or through site-by-site negotiations.
However, the City asked us to identify approaches to consider that would include contributions toward affordable housing as well as other amenities, so our policy options focus on this objective.
There are three general policy approaches that the City could consider to obtain affordable housing units and amenity contributions from rezonings in the Core Area.
- Negotiate a package of amenity contributions and affordable housing from projects that rezone to obtain bonus density. The City would continue to negotiate an overall package of affordable housing and amenities that can be supported by individual rezonings on a site-by-site basis. Under this approach, the City could:
- Decide on a site-by-site basis whether the rezoning is a candidate to provide affordable housing units or make a cash contribution toward affordable housing or other amenities.
- Identify an explicit target for affordable housing (say 6% of bonus floorspace up to the OCP maximum plus 15% of an floorspace beyond the OCP maximum – although this would depend on the definition of affordable housing⁸) and the type of affordable housing that it would like to achieve at rezonings. The target may not be achieved by all projects (depending on the specifics of the application and the results of any financial analysis), but it would provide City staff and applicants with a guideline for the amount of affordable housing that should be considered at an individual rezoning.
- Establish priorities for allocating cash contributions between affordable housing and community amenities.
- Establish a fixed rate target approach toward CACs and affordable housing for rezonings⁹. Under this approach:
- The City would establish a target fixed rate CAC per square foot of bonus floorspace and a target requirement for a share of bonus floorspace to be allocated to affordable housing. The type of affordable housing would need to be explicitly defined in order to determine the appropriate target for the affordable housing share and to calibrate the affordable housing target to ensure that the CAC rate and the affordable housing contribution are approximately equivalent from a financial perspective to the developer.
- A minimum project size could be used to identify rezonings that would provide the affordable housing units rather than a cash CAC.
- Rezonings would either provide a contribution toward amenities based on the target fixed rate CAC or affordable housing based on the affordable housing target (or a combination of each that is equivalent to the overall value of the target fixed rate).
- The City could establish priorities for allocating any cash amenity contributions between affordable housing and community amenities.
- A combination of the two approaches where a fixed rate CAC is applied to projects under a specified size threshold and a negotiated site-by-site approach is used for projects over the specified threshold.
Under each approach, we recommend that bonus office floorspace be excluded from CACs and affordable housing contributions.
⁸ These figures assume that affordable housing is rental housing with rents at 100% of HILs. ⁹ The City could use this same approach if it wanted to establish density bonus zoning districts in the Core Area.
3.4.2 Evaluation of Policy Options
A summary of the advantages and disadvantages of each of the policy options is outlined below.
1. Negotiate CACs and affordable housing contributions on a site-by-site basis for rezonings.
Advantages include:
- Individual negotiations ensure that the CAC and/or affordable housing contribution does not exceed the amount that can be supported by each rezoning, particularly if a rezoning application does not seek all of the bonus floorspace that is permitted.
- The City can determine when it would prefer affordable housing units to be incorporated within the overall project and when it would prefer to collect a cash contribution to fund affordable housing on an alternate site.
- The City could be flexible in its definition of affordable housing as the impact of the affordable housing would be determined individually for each rezoning.
- The City could manage the split of any contributions between affordable housing and other amenities on a site-by-site basis.
- A negotiated approach has the potential to achieve larger contributions toward affordable housing and amenities than a fixed rate approach as the fixed rate approach needs to ensure the target is low enough that it works for most rezonings.
- A negotiated approach takes into account changes in market conditions over time to ensure the City optimizes contributions.
Disadvantages include:
- A negotiated approach is less likely to be supported by the development industry and property owners than a fixed rate approach.
- The cost and timing of negotiations can be an impediment to rezoning and redevelopment for smaller projects.
- The negotiated approach creates uncertainty for developers, land owners, the City, and the community.
2. Apply a fixed rate CAC target and an affordable housing target.
Advantages include:
- The fixed rate approach creates certainty for developers, land owners, the City and the community.
- Any cost associated with process of negotiating the value of a CAC or the amount of affordable housing is eliminated by a fixed rate approach. This is particularly helpful for smaller projects. However, there would still be negotiations required to determine the details associated with the affordable housing units (i.e. size, mix, rent, parking, location in project).
- If the fixed rate CAC target is low and the affordable housing target is low, it will not affect the financial viability of many (if any) redevelopment sites so it should not slow the pace of redevelopment. Sites that are not currently viable for redevelopment will continue to be unattractive for rezoning and redevelopment (with or without a CAC or affordable housing target).
Disadvantages include:
- If the CAC rate or affordable housing target is set too high, it will reduce the number of sites that are financially attractive for rezoning and redevelopment which will make it difficult for the City to meet its growth objectives inside the Downtown Core Area. Under this approach the targets will need to be set toward the lower end of the estimated potential range in our financial analysis to ensure there is a supply of sites that are financially viable for redevelopment.
- Some rezonings would have been able to support a CAC or affordable housing contribution that is higher than the fixed rate or affordable housing target, so the fixed rate approach will likely see lower overall contributions toward affordable housing or other amenities. Given the relatively large size of projects in the Core Area (and the large amount of bonus floorspace), this could be a significant dollar value.
- Once targets are established, it is challenging to adjust the targets to reflect changes in market conditions (particularly upward). Therefore, if the value of bonus floorspace increase over time (due to increases in strata residential values), a fixed rate approach will likely achieve lower amenity and affordable housing contributions than a negotiated approach.
- To determine the target share of bonus floorspace that should be allocated to affordable housing, the City will need to define the type of affordable housing required by rezonings upfront. This will reduce the flexibility to obtain different types of affordable housing over time.
3. Mix of fixed rate approach or negotiated approach depending on project size.
- This approach captures the benefits of a fixed rate target approach for smaller rezonings and uses the more complicated negotiated approach for larger rezonings. The potential benefits associated with a larger rezoning can off-set the costs, risks and complications associated with the negotiated approach.
3.5 Recommendations for the Core Area
We think there are a variety of reasons that the City should continue to negotiate CACs and affordable housing contributions on a site-by-site basis from most rezonings in the Core Area¹⁰:
- There is wide variation in the amenity contribution and affordable housing that can be supported by rezonings in the Core Area. Some rezonings can support much higher contributions than other rezonings.
- There is not a large number of sites that are financially viable rezoning candidates in the study area, so we do not expect a high volume of rezoning applications in the area in any given year.
- The inclusion of on-site affordable housing units within a rezoning will likely require negotiations (even if a target is established).
However, based on our analysis, it is clear that there will be cases where negotiations would result in a cash CAC rather than affordable housing units because the rezoning is not large enough to support the creation of any (or at least very little) on-site affordable housing.
Because of this, there is a case to be made for setting a threshold below which rezonings would be expected to make a cash CAC based on a fixed rate target, rather than going through a negotiated CAC process (resulting in little or no affordable housing).
Therefore, the City should establish a threshold below which a target fixed rate CAC would be used to negotiate a contribution toward amenities (the cash contribution could be used to help fund affordable housing or fund other amenities). Above the threshold, the City would negotiate the delivery of affordable housing units (or combination of affordable housing and other amenities) on a site-by-site basis.
For rezonings that will be negotiated on a site-by-site basis, the City should introduce policies which:
- Define the type of affordable housing that the City would like to be contributed as part of rezonings (rental or ownership, unit mix, discounts on rents or sales prices, parking requirements).
- Identify a target for affordable housing that the City would like to achieve at rezonings. The target will depend on the City’s definition of affordable housing (and whether the City wants to obtain other amenities from rezonings), but our financial analysis indicates that it could be in the range of 3% to 8% of bonus floorspace up to the OCP maximum total densities. Beyond the OCP maximum total density, up to 15% of bonus floorspace could be supported as affordable housing, assuming affordable housing is defined as rental housing with rents set at 100% of HILs (the share would need to be lower if rents were lower than the HILs rate). This will provide developers and staff with an understanding of the maximum amount of affordable housing that is expected at any project. If the City wants to also obtain contributions toward other amenities from projects providing affordable housing units, it will need to set the affordable housing target lower.
- Establish priorities for allocating any cash amenity contributions from negotiated rezonings between affordable housing and other community amenities.
The total value of a negotiated CAC or affordable housing contribution should take into account the cost of creating the amenities that the City wants in the neighbourhood and any affordable housing targets. However, the cost of the overall contribution should not exceed 75% of the increase in property value created by the rezoning over the higher of (a) the value under existing use and zoning or (b) the land value under the base density permitted in the OCP. Otherwise, the rezoning may not be financially viable for developers.
For smaller rezonings that are subject to a fixed rate target CAC, the City should:
- Establish a target fixed rate CAC per square foot of bonus floorspace. Based on our analysis, we would recommend a fixed rate CAC target of about $12 per square foot for bonus floorspace up the current OCP total maximum densities. For any bonus floorspace beyond the current OCP total maximum density, we would recommend a CAC target of $30 per square foot of additional bonus floorspace.
- Establish priorities for allocating any cash amenity contributions between affordable housing and other community amenities.
- Monitor the fixed rates and affordable housing targets to ensure they are adjusted to reflect changes in market conditions and development policies over time.
Under both approaches, we recommend that the City exclude bonus office floorspace from CACs.
The City will need to determine the threshold for rezonings to be subject to site-by-site negotiations rather than a fixed rate target CAC. Negotiating a CAC involves time, costs and risks to the applicant as well as administrative time for City staff. In addition, including affordable housing within a project involves some additional costs to the developer (e.g., legal, marketing) and could impact project design. Therefore, the threshold for negotiations should be set high enough that projects that go through the site-by-site negotiations can be expected to deliver a meaningful number of affordable housing units. We think that rezonings should be able to support a minimum of about three affordable units to be subject to site-by-site negotiations. Rezonings that can only be expected to deliver zero to two affordable units should be in the fixed rate CAC category.
Based on our analysis, we would expect rezonings that involve about 30,000 square feet of bonus residential floorspace to be able to support up to three affordable housing units (depending on the definition of affordable housing and the size of the affordable units). Therefore, we suggest that the City consider establishing 30,000 square feet of bonus residential floorspace as the threshold below which rezonings would be subject to a fixed rate CAC target.
¹⁰ The Provincial guide encourages municipalities to use a fixed rate CAC approach or density bonus zoning whenever practical. However, we do not think a fixed rate approach is appropriate for the Core Area due to the variation in supportable CAC rates across different sites and the City’s interest in securing on-site affordable housing units (which will require negotiations).
4.0 Analysis for Rezonings Outside the Core Area
4.1 Evaluation of Potential Fixed Rate CAC Outside of the Core Area
In 2015, Coriolis evaluated the feasibility of implementing a fixed rate target CAC approach for bonus density outside the Downtown Core Area.
Our recommended approach for rezonings outside of the Core Area is to apply a fixed rate CAC target to smaller site rezonings, but continue to negotiate major rezonings on a site-by-site basis. This section summarizes our recommended approach.
Our detailed analysis and recommendations are contained in a report entitled “City of Victoria Density Bonus Policy Study: for Sites Outside the Downtown Core Area”.
4.1.1 Smaller Rezonings
A fixed rate CAC target should apply where the rezoning involves a small site and the rezoning is from residential or commercial to apartment or mixed-use residential and commercial. We recommend that:
- The fixed rate be set at $5 per square foot of additional floorspace that is permitted over the greater of the OCP base FSR or existing zoning FSR (the existing zoning for some sites allows greater density than the base OCP density).
- Projects that include at least one floor of upper floor office space should be exempt from CACs.
- Projects where the City requires new rental apartment units or the replacement of existing rental apartment units (either on-site or at an alternate site) should be exempt from CACs.
- Rezonings of sites in the Small Urban Village designation should be exempt from CACs (unless the density exceeds the 2.0 FSR identified in the OCP).
There may be rezoning applications where the developer determines that the fixed rate CAC target is inappropriate and in those cases, the developer should have the option of requesting a negotiated CAC (at the applicant's expense).
4.1.2 Major Rezonings
It is not possible to determine the potential CAC from major rezonings outside of the Core Area in advance of a detailed development application that outlines the mix of uses, heights, density and on-site servicing and infrastructure requirements. Therefore, these large rezonings are not good candidates for a fixed-rate target CAC.
CACs should continue to be negotiated for:
- Rezonings of large sites (e.g., over one City block) that will require the dedication of part of the site for new roads and services.
- Rezonings involving sites that have been identified as a location for a large on-site amenity or public facility as part of the rezoning process (e.g., park space, community centre).
- Sites that are being rezoned from industrial or institutional uses to residential or mixed-use.
- Rezonings that exceed the density identified in the OCP.
The total value of a negotiated CAC should take into account the estimated cost of creating the amenities that the City wants in the neighbourhood, but the CAC should not exceed 75% of the increase in property value created by the rezoning over the higher of (a) the value under existing use and zoning or (b) the land value under the base density permitted in the OCP. Otherwise, the rezoning will not be financially viable for developers.
4.2 Evaluation of Potential Affordable Housing Contributions from Rezonings Outside the Core Area
Drawing on the financial analysis completed for our previous 2014-2015 analysis, we evaluated the opportunity for rezonings outside Core Area to provide affordable housing rather than an amenity contribution.
4.2.1 Approach
We used the results of our financial analysis for two case study sites from our 2014-2015 analysis to estimate the potential amount of affordable housing that could be supported by a typical rezoning outside of the Core Area. The case study sites we selected supported an estimated CAC of about $5 per square foot of bonus floorspace (matching our recommended rate for rezonings outside of the Core) so the affordable housing estimates will be consistent with the recommended fixed rate target.
For each of the two case study sites and for each of the four affordable housing scenarios, we estimated the amount of affordable housing that could be funded by the calculated total value of the amenity contribution (i.e. 75% of the estimated increase in property value associated with the bonus floorspace).
Our estimates assume that all of the calculated amenity contribution value is used to fund affordable housing, leaving no room for contributions toward other amenities.
Therefore, our estimates assume that each rezoning provides affordable housing, but no additional amenity contribution.
4.2.2 Summary of Estimates of Supportable Affordable Housing
Exhibit 9 summarizes our findings for the two case sites that we examined outside of the Core Area. For one of the sites, we included some sensitivity analysis showing the impact of increasing the permitted by 10% beyond the density indicated in the OCP.
For each site, the exhibit shows:
- The density bonus subarea.
- The site size.
- The current use and current zoning.
- The base OCP density and maximum OCP density.
- The assumed number of residential units in the redevelopment scenario.
- The estimated increase in property value due to the permitted bonus density (in the absence of any affordable housing or amenity contribution).
- The calculated amenity contribution at 75% of the estimated increase in value due to the bonus density in the absence of any affordable housing.
- The estimated amount of affordable housing that can be funded by 75% of the estimated increase in value created by the bonus density for each of the four affordable housing scenarios. This affordable housing potential is expressed in a variety of different ways, including (a) the total square footage of affordable housing floorspace (gross square feet), (b) the share of bonus floorspace allocated to affordable housing, (c) the maximum number of affordable housing units supportable by the project and (d) the maximum share of affordable housing units in the total project.
Exhibit 9: Estimated Supportable Amount of Affordable Housing from Rezonings Outside of the Core Area
| Subarea | Outside Core | ||
|---|---|---|---|
| Case Study Sites Number | 9 | 10a | 10b |
| Redevelopment Scenario | Old Low Density Commercial to 2.5 FSR | Old Low Density Commercial to 2.5 FSR | Old Low Density Commercial to 2.5 FSR + 10% |
| Site Size | 12,947 | 8,891 | 8,891 |
| Current Zoning | C-1S | CR-4 | CR-4 |
| Current Use | Old low density commercial | Old low density commercial | Old low density commercial |
| Bonus Density Subarea | Urban Village | Urban Village | Urban Village |
| OCP Base Density (FSR) | 1.5 | 1.5 | 1.5 |
| Potential Bonus Density (FSR) | 1.0 | 1.0 | 1.0 |
| OCP Maximum Density (FSR) | 2.5 | 2.5 | 2.5 |
| Assumed Total Units in Scenario with Bonus Density | 28 | 19 | 19 |
| Summary of Potential Amenity Contributions (no Affordable Housing) | |||
| Estimated "Base" Value | $1,757,900 | $839,600 | $839,600 |
| Estimated Supportable Rezoned Land Value with Bonus Density, but no CAC | $1,848,813 | $896,050 | $1,066,471 |
| Estimated Increase in Property Value Due to Bonus Density | $90,913 | $56,450 | $226,871 |
| Calculated Amenity Contribution at 75% of Increased Value | $68,185 | $42,338 | $170,153 |
| Estimated Bonus Density Floorspace | 12,947 | 8,891 | 11,114 |
| 2. Estimated Maximum Negotiable Affordable Housing at OCP Maximum Density Assuming 75% of Increased Value Allocated Toward Affordable Housing | |||
| Estimated Maximum Potential Affordable Gross Floorspace (sf), assuming CAC is the Affordable Housing | |||
| a Rental at 50% of HILs (avg rent = $450 per month) | 267 | 197 | 791 |
| b Rental at 90% of HILs (avg rent = $805 per month) | 369 | 292 | 1,173 |
| c Rental at 100% of HILs (avg rent = $895 per month) | 413 | 368 | 1,480 |
| d Affordable Ownership | 524 | 446 | 1,791 |
| Share of Bonus Floorspace | |||
| a Rental at 50% of HILs | 2% | 2% | 7% |
| b Rental at 90% of HILs | 3% | 3% | 11% |
| c Rental at 100% of HILs | 3% | 4% | 13% |
| d Affordable Ownership | 4% | 5% | 16% |
| Estimated Maximum Potential Affordable Units (rounded), assuming no CAC | |||
| a Rental at 50% of HILs (avg rent = $450 per month) | 0 | 0 | 1 |
| b Rental at 90% of HILs (avg rent = $805 per month) | 0 | 0 | 2 |
| c Rental at 100% of HILs (avg rent = $895 per month) | 1 | 0 | 2 |
| d Affordable Ownership | 1 | 1 | 2 |
| Share of Total Units in Project | |||
| a Rental at 50% of HILs | 1% | 1% | 6% |
| b Rental at 90% of HILs | 2% | 2% | 8% |
| c Rental at 100% of HILs | 2% | 3% | 10% |
| d Affordable Ownership | 2% | 3% | 11% |
As shown in Exhibit 9:
- The amount of affordable housing that can be supported by a rezoning varies depending on the type of affordable housing. As the required discount in rents (or sales prices) increases, the amount of affordable housing that is supportable by the project decreases.
- The cost of creating the affordable housing (in all scenarios) is higher than the completed value of the affordable housing, so a significant share of the bonus floorspace needs to be allocated to market strata housing in order to off-set the losses incurred on the affordable housing units. If strata residential unit prices increase, the share of the bonus floorspace that needs to be allocated to market strata housing would decline.
- The total number of affordable housing units that can be supported at the case study sites that we analyzed ranges depending on the value of the site under its existing use, the amount of bonus density available, and the type of affordable housing. The amount of affordable housing that is supportable at the case studies we analyzed is summarized in the Exhibit 10.
Exhibit 10: Summary of Supportable Affordable Housing at Case Study Sites outside the Core Area
| Affordable Housing Scenario | Total Supportable Affordable Housing Units¹¹ | Share of Total Units in Project | Affordable Housing’s Share of Bonus Floorspace |
|---|---|---|---|
| 50% of HILs | 1 unit | 1% | 2% |
| 90% of HILs | 1 unit | 2% | 3% |
| 100% of HILs | 1 unit | 2% to 3% | 3% to 4% |
| Affordable Ownership | 1 unit | 2% to 3% | 4% to 5% |
- The total number of affordable units supported by the typical case study rezonings outside of the core is very low (1 unit at most), in part due to the small size of most rezonings outside of the Core.
- If affordable housing units are required, it eliminates the opportunity to obtain any contributions toward community amenities¹².
- Increasing the permitted OCP maximum density has a positive impact on the amount of affordable housing that can be supported by a rezoning. The City asked us to test the impact of a 10% increase in permitted total maximum density. Our analysis indicates that a 10% increase in the OCP maximum density, generates an increase in the share of bonus floorspace that can be allocated to affordable housing by about 5 to 9 percentage points of total bonus floorspace (including the 10% additional density). However, the total number of affordable units that is supportable is still very low at about 1 or 2 units (due to the small size of typical rezonings outside of the Core).
¹¹ The estimated supportable affordable housing floorspace is generally between about 200 and 550 square feet, depending on the type of affordable housing. This is less than one full unit at the assumed unit sizes and mix used in our analysis. However, if the City was interested, these rezonings could likely support one small affordable unit. ¹² The estimated impact on the supportable CAC from one affordable housing unit at the case study rezonings outside of the Core is as follows (under the definitions in Section 3.2.1):
- At 50% of HILs, $161,250 to $191,250 per unit, depending on the property location.
- At 90% of HILs, $108,750 to $138,750 per unit, depending on the property location.
- At 100% of HILs, $86,250 to $123,750 per unit, depending on the property location.
- For affordable ownership units, $83,600 to $114,400 per unit, depending on the property location.
4.2.3 Recommended Approach to Affordable Housing Outside the Core
Typical, smaller rezonings outside of the Core Area cannot provide any material number of affordable housing units (likely 1 unit at most). Any requirement for affordable housing units within the smaller rezonings will leave no room for contributions toward other amenities. Therefore, we recommend that smaller rezonings outside of the Core not be required to include affordable housing units.
The City should determine whether it would like to allocate a portion of any cash contributions (from a fixed rate CAC) from smaller rezonings outside the Core toward an affordable housing fund.
If the City wants to secure affordable housing units at rezonings outside of the Core, it should only consider this approach for the major negotiated rezoning applications outside of the Core Area.
5.0 Recommendations
5.1 Inside the Core Area
There are a variety of reasons that the City should continue to negotiate CACs and affordable housing contributions on a site-by-site basis from most rezonings in the Core Area:
- There is wide variation in the amenity contribution and affordable housing that can be supported by rezonings in the Core Area. Some rezonings can support much higher contributions than other rezonings.
- There is not a large number of sites that are financially viable rezoning candidates in the study area, so we do not expect a high volume of rezoning applications in the area in any given year.
- The inclusion of on-site affordable housing units within a rezoning will likely require negotiations (even if a target is established).
However, based on our analysis, it is clear that there will be cases where negotiations would result in a cash CAC, rather than affordable housing units, because the rezoning is not large enough to support the creation of any meaningful amount of on-site affordable housing. Therefore, we have the following recommendations:
- The City should establish a threshold below which a target fixed rate CAC would be used to negotiate a cash (or in-kind) contribution toward amenities (the cash contribution could be used to help fund affordable housing or fund other amenities). Above the threshold, the City should negotiate the delivery of affordable housing units (or combination of affordable housing and other amenities) on a site-by-site basis. We suggest that the City consider establishing 30,000 square feet of bonus residential floorspace as the threshold below which rezonings would be subject to a fixed rate CAC target, rather than site-by-site negotiations.
- For rezonings that will be negotiated on a site-by-site basis, the City should introduce policies which:
- Define the type of affordable housing that the City would like to be contributed as part of rezonings (rental or ownership, unit mix, discounts on rents or sales prices, parking requirements).
- Establish a target requirement for a share of bonus floorspace to be allocated to affordable housing. This will provide developers and staff with an understanding of the maximum amount of affordable housing that is expected at any rezoning. Based on our analysis, we would recommend an affordable housing target of about 3% to 8% of bonus floorspace (depending on the definition of affordable housing) with a higher share for any floorspace bonus beyond the current OCP maximum density. For example, if affordable housing is defined as rental housing with rents set at 100% of HILs, we would recommend a target of 6% of bonus floorspace up to the OCP maximum density and 15% for any additional bonus floorspace beyond the OCP maximum. If the City wants to also obtain contributions toward other amenities from projects providing affordable housing units, it will need to set the affordable housing target lower. The City needs to explicitly define the type of affordable housing in advance in order to determine the appropriate target for the affordable housing share and calibrate the affordable housing target to ensure that the fixed rate CAC target and the affordable housing contribution are approximately equivalent from a financial perspective to the developer.
- Establish priorities for allocating cash amenity contributions between affordable housing and other community amenities.
The total value of a negotiated CAC or affordable housing contribution should take into account the cost of creating the amenities that the City wants in the neighbourhood and any affordable housing targets. However, the cost of the overall contribution should not exceed 75% of the increase in property value created by the rezoning over the higher of (a) the value under existing use and zoning or (b) the land value under the base density permitted in the OCP. Otherwise, the rezoning may not be financially viable for developers.
- For smaller rezonings that are subject to a fixed rate target CAC, the City should:
- Establish a target fixed rate CAC per square foot of bonus floorspace. Based on our analysis, we would recommend a fixed rate CAC target of about $12 per square foot for bonus floorspace up the current OCP maximum densities. For any bonus floorspace beyond the current OCP maximum density, we would recommend a CAC target of $30 per square foot of additional bonus floorspace.
- Establish a minimum project size to identify rezonings that would provide the affordable housing units rather than a cash CAC.
- Establish priorities for allocating any cash amenity contributions between affordable housing and other community amenities.
- Monitor the fixed rates and affordable housing targets to ensure they are adjusted to reflect changes in market conditions and development policies over time.
- The City should exclude bonus office floorspace from CACs.
5.2 Outside the Core Area
- A fixed rate CAC target should apply where the rezoning involves a small site and the rezoning is from residential or commercial to apartment or mixed-use residential and commercial. We recommend that:
- The fixed rate be set at $5 per square foot of additional floorspace that is permitted over the greater of the OCP base FSR or existing zoning FSR (the existing zoning for some sites allows greater density than the base OCP density).
- Projects that include at least one floor of upper floor office space should be exempt from CACs.
- Projects where the City requires new rental apartment units or the replacement of existing rental apartment units (either on-site or at an alternate site) should be exempt from CACs.
- Rezonings of sites in the Small Urban Village designation should be exempt from CACs (unless the density exceeds the 2.0 FSR identified in the OCP).
- There may be rezoning applications where the developer determines that the fixed rate CAC target is inappropriate and in those cases, the developer should have the option of requesting a negotiated CAC (at the applicant's expense).
- Smaller rezonings outside of the Core should not be required to include affordable housing units. Otherwise, there will be no room for contributions toward other amenities. The City should determine whether it would like to allocate a portion of any cash contributions (from a fixed rate CAC) from smaller rezonings outside the Core toward an affordable housing fund.
- It is not possible to determine the potential CAC from major rezonings outside of the Core Area in advance of a detailed development application that outlines the mix of uses, heights, density and on-site servicing and infrastructure requirements. Therefore, these large rezonings are not good candidates for a fixed rate target CAC. CACs should continue to be negotiated for:
- Rezonings of large sites (e.g., over one City block) that will require the dedication of part of the site for new roads and services.
- Rezonings involving sites that have been identified as a location for a large on-site amenity or public facility as part of the rezoning process (e.g., park space, community centre).
- Sites that are being rezoned from industrial or institutional uses to residential or mixed-use.
- Rezonings that exceed the density identified in the OCP.
The total value of a negotiated CAC should take into account the estimated cost of creating the amenities that the City wants in the neighbourhood, but the CAC should not exceed 75% of the increase in property value created by the rezoning over the higher of (a) the value under existing use and zoning or (b) the land value under the base density permitted in the OCP. Otherwise, the rezoning will not be financially viable for developers.
- If the City wants to secure affordable housing units at rezonings outside of the Core, it should only consider this approach for the major negotiated rezoning applications.
6.0 Attachments - Financial Analysis
These attachments summarize the approach and main assumptions that we used for our case study financial analysis for sites in the Core Area. The approach, assumptions and analysis used for our analysis of sites outside of the Core Area is contained in our separate report “City of Victoria Density Bonus Policy Study: for Sites Outside the Downtown Core Area”.
6.1 Approach to CAC Analysis
To estimate the CAC that is likely supportable for rezonings inside the Downtown Core Area, we analyzed the financial viability of rezoning and redevelopment of a variety of different case study sites throughout the study area.
We used the financial analysis to model the likely performance of rezoning and redeveloping each site under the maximum density identified in the OCP on the assumption that the developer purchases the site at its current market value under existing use and zoning (i.e., the developer does not pay the rezoned value of the site).
The analysis allows us to determine whether rezoning and redevelopment of each case study is financially viable and, if so, whether the rezoning supports a CAC.
Our analysis was completed in six main steps:
- We identified case study sites for the financial analysis. Sites were either vacant or improved with older, low quality improvements, similar to the types of properties that have been the focus of development in Victoria. The sites were selected to represent a cross-section of the different density bonus subareas, zoning districts and existing uses inside the Downtown Core Area.
- We estimated the existing value of each case study in the absence of any bonus density. For this estimate, we considered three different values:
- Value supported by existing use (income stream or house value).
- The land value under existing zoning.
- The land value under base OCP density. The highest of these three indicators used for analysis
- We estimated the land value supported if the site was rezoned to the maximum identified in the OCP, with the bonus density but without any amenity contribution. If the estimated supportable land value with the bonus density is higher than site’s existing value, then site is viable for redevelopment. Otherwise, it is not yet financially viable for rezoning and redevelopment.
- We determined whether rezoning and redevelopment of each case study site is financially viable.
- For the financially viable case study sites, we estimated:
- The increase in property value due to the bonus density (estimated value in step 3 less estimated value in step 2.
- The potential CAC amount at 75% of the increased value (the current City practice).
- The equivalent fixed rate CAC in terms of dollars per square foot of floorspace over the base OCP density
- We completed sensitivity analysis on a few key variables:
- For some sites that are improved with existing low density buildings, we tested the impact on the calculated CAC assuming that the property was vacant (not improved). This reduced the estimated value under existing use and zoning (the existing value) resulting in a higher supportable CAC estimate.
- For some sites, we tested the impact of increasing the permitted density to 10% beyond the OCP designation. This allowed us to evaluate the potential impact on the estimated CAC (and affordable housing contribution) of a small increase in permitted density.
- For sites east of Cook Street, we tested the impact on the estimated supportable CAC of the assumed construction material for the new development project. The OCP indicates heights in the range of 6 to 8 storeys in this subarea so it is uncertain whether projects in this area will be built using woodframe (permitted up to 6 storeys) or concrete (required beyond 6 storeys). The change in construction material has an impact on construction costs and development economics so it affects the potential supportable CAC.
6.2 Key Assumptions for Financial Analysis
This attachment summarizes the key assumptions used in our case study financial analysis for sites in the Core Area. Some assumptions vary on a property by property basis (to reflect building form, property assessments and servicing costs).
The key assumptions for are strata residential and mixed use case study analysis are as follows:
- Average sales price assumptions vary by form of construction:
- Woodframe strata apartment projects are assumed to achieve average sales prices of $450 per square foot (at sites east of Cook). Some new projects currently marketing in Victoria are achieving higher average prices, but these projects are located in unique, high amenity locations (such as adjacent to Beacon Hill Park).
- Concrete strata apartment projects are assumed to achieve average sales prices of $520 per square foot, consistent with projects currently marketing in (or near) the study area.
- Average lease rates for new retail space is assumed to be $25 per square foot net. Net operating income from retail space is capitalized at 6.0% to estimate total market value.
- Residential commissions are assumed to be 3% of sales revenue.
- Marketing is assumed to total 2% of sales revenue.
- Leasing commissions on the commercial space are set at 17% of Year 1 lease income.
- Rezoning costs (application fees, architects, consultants, management, disbursements) are assumed to total $100,000. This assumes that rezoning is consistent with the OCP plan so costs are minimized, otherwise the cost would likely be higher.
- Construction cost assumptions are as follows:
- Hard construction costs (excluding parking) for woodframe apartment buildings are assumed to range from about $130 per square foot to $150 per square foot depending on the number of storeys.
- Hard costs for concrete apartment buildings (excluding parking) are $210 per square foot.
- Costs for grade level commercial space in mixed-use buildings is assumed to be $175 per square foot (for shell space).