Appendix
VIEW ROYAL FIRE RESCUE MONTHLY STATISTICS 2021 - CALLS ATTENDED
July 13, 2021Page 361 section
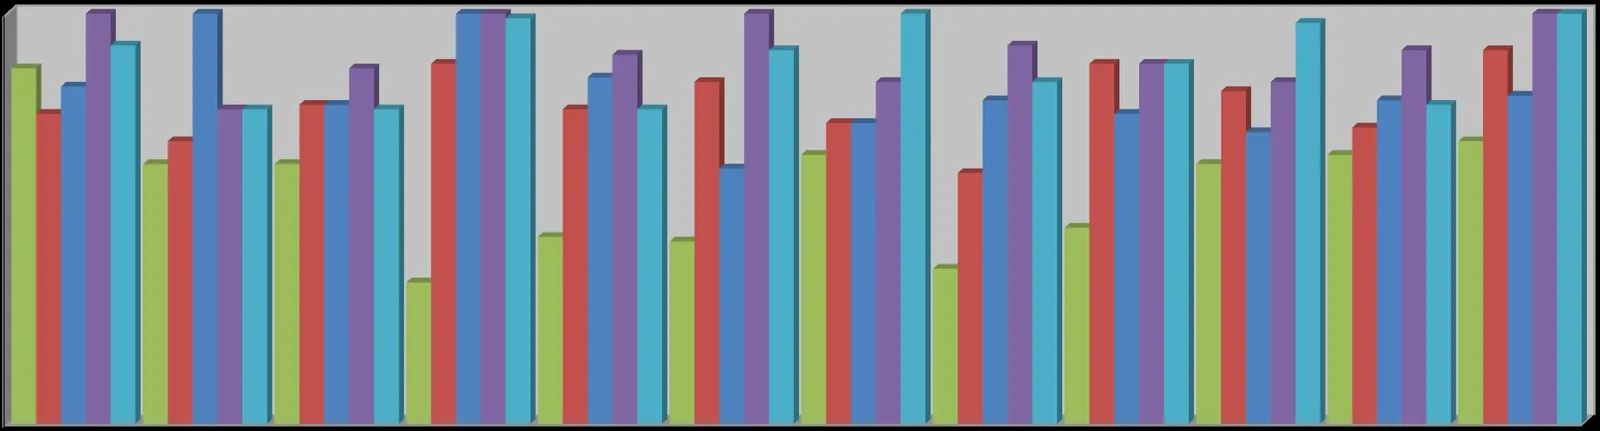
Table and chart comparing monthly calls attended from 2016 through 2021.
101 total calls in June 2021425 total calls YTD 2021
VIEW ROYAL FIRE RESCUE MONTHLY STATISTICS 2021
| CALLS ATTENDED | JAN | FEB | MAR | APR | MAY | JUN | JUL | AUG | SEP | OCT | NOV | DEC | YTD |
|---|---|---|---|---|---|---|---|---|---|---|---|---|---|
| STRUCTURE FIRES / FIRES IN BUILDINGS | 9 | 7 | 1 | 6 | 3 | 9 | 35 | ||||||
| MOTOR VEHICLE FIRES | 0 | 2 | 2 | 1 | 0 | 2 | 7 | ||||||
| MVA'S / JAWS / RESCUES | 5 | 8 | 6 | 9 | 5 | 10 | 43 | ||||||
| BUSH / GRASS / BEACH FIRES | 0 | 0 | 1 | 1 | 2 | 1 | 5 | ||||||
| GARBAGE / DUMPSTER / MISC FIRES | 0 | 2 | 4 | 0 | 0 | 1 | 7 | ||||||
| HYDRO ELECTRICAL FIRES / CALLS | 3 | 1 | 0 | 0 | 2 | 0 | 6 | ||||||
| MEDICAL AID CALLS | 35 | 23 | 23 | 27 | 28 | 47 | 183 | ||||||
| RESCUE / BOAT CALLS | 0 | 1 | 0 | 0 | 0 | 2 | 3 | ||||||
| DANGEROUS GOODS / SPILLS / LEAKS | 0 | 0 | 0 | 0 | 1 | 0 | 1 | ||||||
| ALARM BELLS | 6 | 10 | 5 | 10 | 5 | 10 | 46 | ||||||
| BURNING & BYLAW COMPLAINTS | 1 | 2 | 0 | 4 | 2 | 3 | 12 | ||||||
| NATURAL GAS / PROPANE LEAKS | 2 | 2 | 0 | 0 | 0 | 1 | 5 | ||||||
| SMOKE SMELL & SIGHTINGS | 2 | 1 | 0 | 0 | 1 | 2 | 6 | ||||||
| MUTUAL AID / AUTOMATIC AID | 10 | 8 | 3 | 7 | 4 | 0 | 32 | ||||||
| ASSIST PUBLIC/ STANDBY/OTHER | 9 | 9 | 8 | 12 | 15 | 13 | 66 | ||||||
| TOTAL CALLS | 72 | 68 | 50 | 70 | 64 | 101 | 0 | 0 | 0 | 0 | 0 | 0 | 425 |
| 2020 (with comparative YTD) | 78 | 57 | 57 | 31 | 41 | 40 | 59 | 34 | 43 | 57 | 59 | 62 | 618 |
| 2019 (with comparative YTD) | 68 | 62 | 70 | 79 | 69 | 75 | 66 | 55 | 79 | 73 | 65 | 82 | 843 |
| 2018 (with comparative YTD) | 74 | 90 | 70 | 95 | 76 | 56 | 66 | 71 | 68 | 64 | 71 | 72 | 873 |
| 2017 (with comparative YTD) | 106 | 69 | 78 | 91 | 81 | 94 | 75 | 83 | 79 | 75 | 82 | 94 | 1007 |
| 2016 (with comparative YTD) | 83 | 69 | 69 | 89 | 69 | 82 | 92 | 75 | 79 | 88 | 70 | 100 | 965 |
FIVE YEAR MONTHLY COMPARISON
Page 36
Document Images
(1)
Extracted from: 2021 07 13 Committee of the Whole Agenda - Agenda - Pdf