BUDGET VARIANCE AND PROJECTS UPDATE REPORT TO JUNE 30, 2021
Staff report providing financial results of operations and project progress to the end of Q2 2021.
TOWN OF VIEW ROYAL Finance & Administration Report
TO: Committee of the Whole FROM: D. Christenson, Director of Finance DATE: July 6, 2021 MEETING DATE: July 13, 2021
BUDGET VARIANCE AND PROJECTS UPDATE REPORT TO JUNE 30, 2021
RECOMMENDATION:
THAT the Committee receive the Budget Variance and Projects Update Report to June 30, 2021, for information.
CHIEF ADMINISTRATIVE OFFICER COMMENTS:
I concur with the recommendation.
PURPOSE OF REPORT:
To provide Council with information regarding the financial results of operations and progress of projects to June 30, 2021, and to introduce the Budget Variance Report dashboard.
BACKGROUND:
In May 2021 Council adopted a five-year financial plan (Bylaw 1071) that identifies revenue and expense targets and authorizes projects to further its strategic objectives. The attached schedules are provided to inform Council of the financial results of delivering services and projects to the end of the second quarter this year.
DISCUSSION:
New Budget Variance Dashboard
To keep Council informed of the financial results of operations, staff have developed an interactive dashboard that displays the operating revenue and expense components of the budget, with year-to-date financial results and prior year comparatives. Additionally, the dashboard includes information about the status of both non-core and capital projects along with related operating budget and spending to date. This information is not intended to replace the traditional quarterly consolidated revenue and expense and capital projects update reports provided in the past. Instead, it is meant to add to those reports in two ways:
- Provides easy-to-navigate additional comparative and detailed operating revenue and expense information on demand; and
- Provides project information for non-core projects as has been previously provided for capital projects.
The dashboard can be viewed on any common web browser and accessed through the link below. Please refer to the illustration for tips on navigating the dashboard. Staff will be pleased to provide a walk-through of the dashboard during the Council meeting.
Link to dashboard: Budget Variance Report
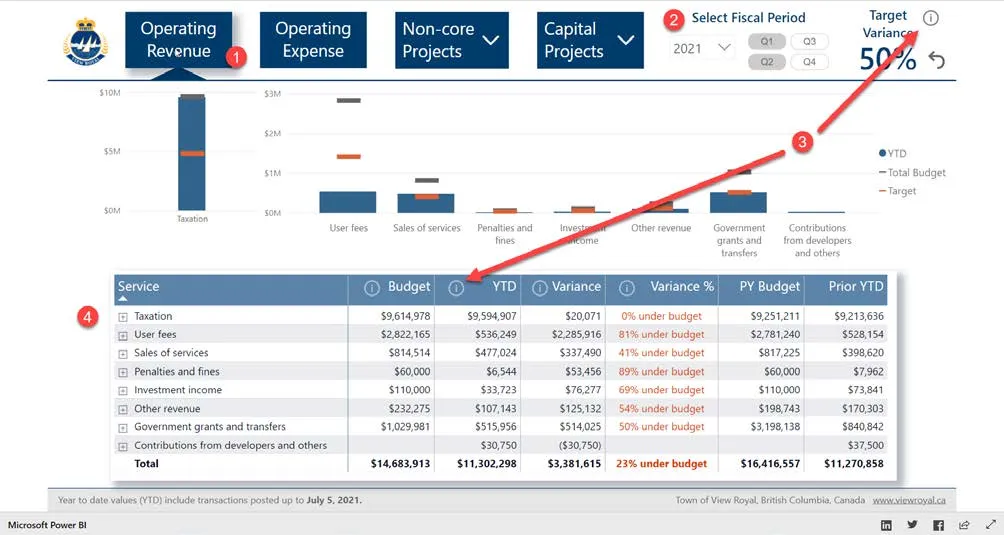
- Click on one of the four sections to navigate to the related report. The non-core and capital projects sections each include separate reports for metrics (project status, schedule, completion information and comments) and financials.
- Select the desired fiscal year and quarter(s). Operating revenue and expense financial information is provided for fiscal years 2019-2021 with the related prior year values.
- Hover over any information symbol to display a pop-up box with more information and tips.
- Click on any plus (minus) sign to expand or collapse detail summarized in the related category.
At this time access to the Budget Variance dashboard is provided to Council for feedback and comments. Members of the public may also access this tool through the hyperlink in the agenda. If Council supports the use of this tool, staff can make it more generally accessible by incorporating it into the Town’s website, with additional communication to inform the public about its availability.
Financial information will be updated weekly, with project metrics less frequently. Please note that the financial values provided are subject to change until finalized for the published financial statements. Also, the values in the dashboard will not match those on the attached consolidated reports, as they reflect only operating revenue and expense and specific project financial information, rather than the complete consolidated budget.
Consolidated Budget Variance and Projects Update Report
Analysis shows that revenues and expenses to date are within expected variances to the end of this quarter with the exceptions and comments noted below.
Consolidated Revenue
Schedule A – Consolidated Budget Variance shows revenue on a consolidated basis, which means that both operating and capital revenue are added together in the same format as shown in the five-year financial plan bylaw. Sixty-four percent or $14.7 million of the total 2021 consolidated revenue budget comes from current year operations. At the end of the second quarter, $11.3 million (76%) in total operating revenue has been received or is receivable, putting View Royal on track to meet its targets. The following table identifies some exceptions and related explanations.
| Revenue Type | Actual | Budget | Variance | Explanation |
|---|---|---|---|---|
| User fees | $536,249 | $2,822,165 | 2,285,916 | Annual sewer user fees will be billed in October (est. $2,281,000) |
| Sales of services | 477,024 | 814,514 | 337,490 | Building and other development permits issued are $23,000 higher than expected for the full year, however, if projects are not completed by year end, some of this revenue may be deferred to 2022. Additionally, about $290,000 for fire protection services has not yet been invoiced and is not reflected here. |
| Penalties and fines | 6,544 | 60,000 | 53,456 | At the end of Q2, the 10% late payment penalty on taxes was not yet applied but is estimated to comprise most of this variance. |
| Other revenue | 545,249 | 232,275 | (312,974) | The operating component of other revenue is on target at $13,000 of the total $24,000 budget. The balance of the revenue to date is comprised of net proceeds from the sale of land, which was not anticipated in the budget. |
| Gov’t grants and transfers | 518,456 | 2,095,677 | 1,577,221 | Of the total variance, $453,000 in unconditional grants is anticipated from the Province in Q3. The variance includes an additional $1.1 million in conditional grants related to specific initiatives or projects which will not proceed if the grants are not approved. |
| DCCs, transfers, and internal cost allocations | 0 | 7,305,450 | 7,305,450 | These items relate to entries that typically are dependent on finalization of other determinants at year-end, such as amortization, and will not be reported until after Q4. |
Consolidated Expense
Similar to revenue, expense is shown on Schedule A on a consolidated basis – operating, capital expenses and transfers are added together. Sixty-eight percent or $15.6 million of the 2021 total consolidated expense is budgeted for operations. At the end of the second quarter, 36% or $5.6 million has been spent or is payable.
Generally, operating expense is spread evenly throughout the year such that at the end of the second quarter, at least 50% of the budget should remain for each of the functional services. Schedule A shows that most operational services have greater than 50% budget remaining, which allows for the timing differences between quarter-end and pay cycles, year-end accruals, and other project or contingency expenses.
Recreation and culture services show 32% budget remaining, because payments to Greater Victoria Public Library and West Shore Parks and Recreation are typically made in advance. The 2021 YTD amount showing as transfers to reserves ($570,872) relates to proceeds from the disposal of land earlier in the year which was not anticipated in the budget. Remaining transfers to surplus, reserves and for internal cost allocations and amortization will be completed as a part of year-end work.
Non-core projects
The 2021 budget includes $455,540 designated for specific non-core projects. Non-core projects are defined as those that represent a change to service levels or are new non-recurring or infrequent items. The attached Schedule B – Non-core Projects details the non-core budget and the actual expenditures that total $30,869 to June 30, 2021 and includes projected completion dates. Note that discrete actual costs for non-core projects relating to increases in personnel are not available but are included as a part of the total non-core budget.
Capital projects
The 2021 budget includes $2,609,526 allocated for specific capital projects. The attached Schedule C – Capital Projects details the capital budget and the actual expenditures that total $287,977 to June 30, 2021 and includes projected completion dates.
Summary
Due to timing differences between internal reporting timelines and invoices from vendors, there may exist variances between reported costs and final costs of some projects. As invoices are processed, a more complete calculation of actual variances will be made.
Cost overruns can be offset by deferring other projects with the same funding source, to the extent that there are no other significant impacts to levels of service.
Staff will continue to monitor financial results to ensure delivery of services and projects within the allocated budgets. Where applicable, staff will seek budget amendment approval in due course once the final funding requirements are known.
Should corrective measures be necessary, staff will inform Council of the effect, if any, on service levels or project completion timelines.
RECOMMENDATION:
THAT the Committee receive the Budget Variance and Projects Update Report to June 30, 2021 for information.
SUBMITTED BY: S. Vella, Manager of Accounting
REVIEWED BY: D. Christenson, Director of Finance
Attachments: Schedule A: Consolidated Budget Variance Schedule B: Non-core Projects Schedule C: Capital Projects
Document Images
(3)