Appendix
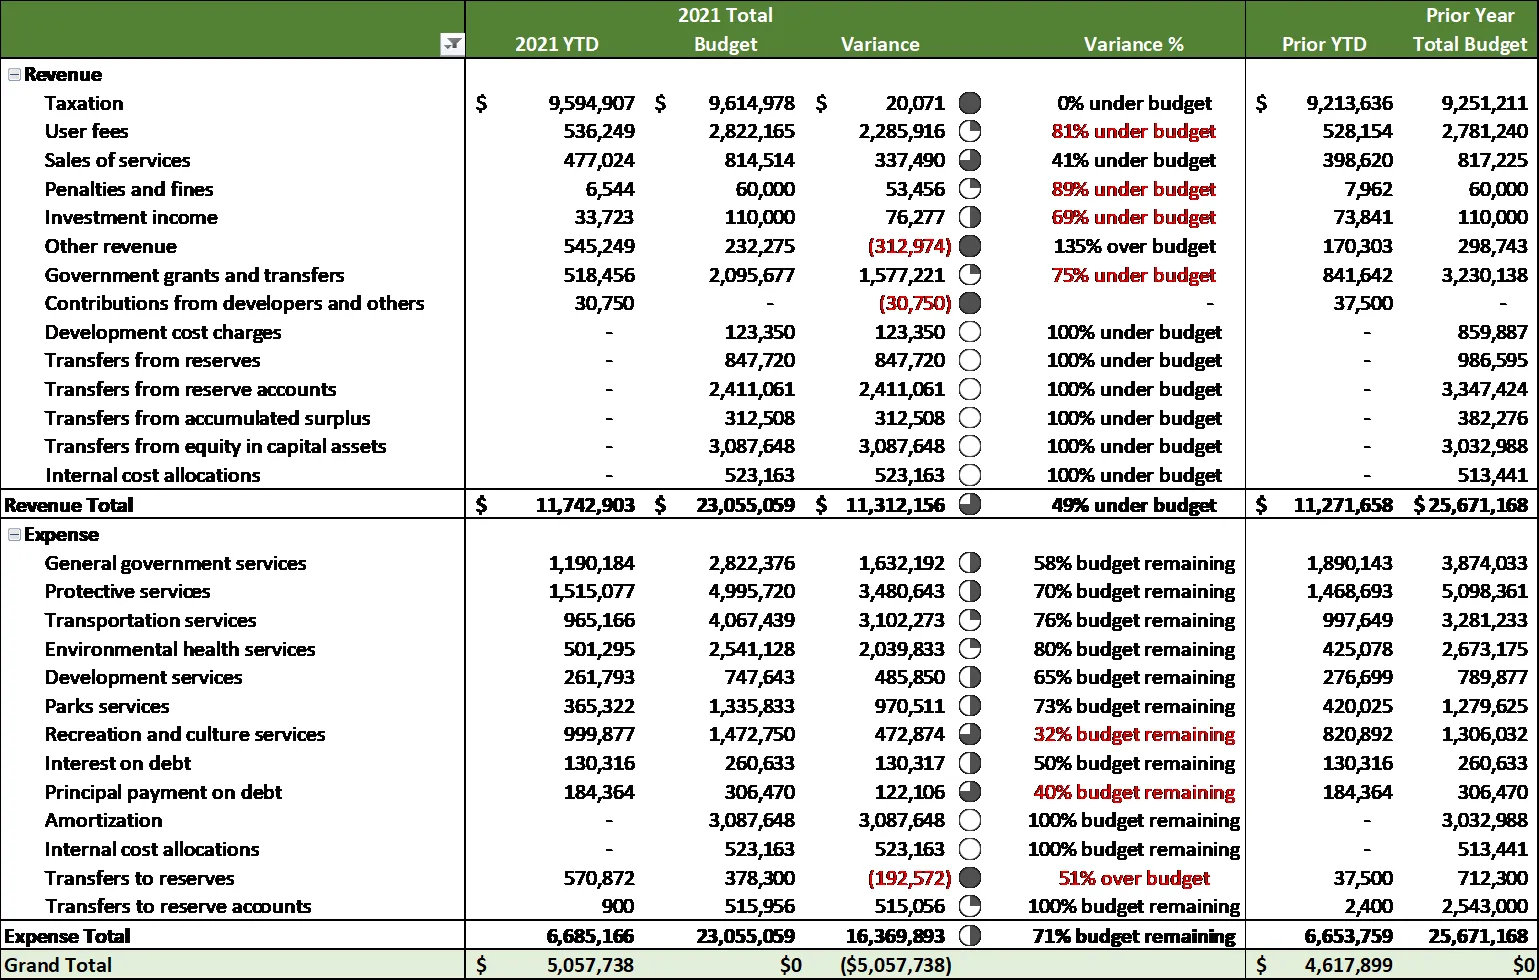
Schedule A – Consolidated Budget Variance
July 13, 2021Page 462 sections
Consolidated financial data showing YTD revenue and expenses versus the 2021 budget.
Total Revenue YTD: $11,742,303Total Expense YTD: $6,685,166
Report to Committee of the Whole Re: Budget Variance and Projects Update Report to June 30, 2021 Meeting Date: July 13, 2021
Page 46
Schedule A – Consolidated Budget Variance
| 2021 YTD | 2021 Total Budget | Variance | Variance % | Prior YTD | Prior Year Total Budget | |
|---|---|---|---|---|---|---|
| Revenue | ||||||
| Taxation | $ 9,594,907 | $ 9,614,978 | $ 20,071 | 0% under budget | $ 9,213,636 | 9,251,211 |
| User fees | 536,249 | 2,822,165 | 2,285,916 | 81% under budget | 528,154 | 2,781,240 |
| Sales of services | 477,024 | 814,514 | 337,490 | 41% under budget | 398,620 | 817,225 |
| Penalties and fines | 6,544 | 60,000 | 53,456 | 89% under budget | 7,962 | 60,000 |
| Investment income | 33,723 | 110,000 | 76,277 | 69% under budget | 73,841 | 110,000 |
| Other revenue | 545,249 | 232,275 | (312,974) | 135% over budget | 170,303 | 298,743 |
| Government grants and transfers | 518,456 | 2,095,677 | 1,577,221 | 75% under budget | 841,642 | 3,230,138 |
| Contributions from developers and others | 30,750 | - | (30,750) | - | 37,500 | - |
| Development cost charges | - | 123,350 | 123,350 | 100% under budget | - | 859,887 |
| Transfers from reserves | - | 847,720 | 847,720 | 100% under budget | - | 986,595 |
| Transfers from reserve accounts | - | 2,411,061 | 2,411,061 | 100% under budget | - | 3,347,424 |
| Transfers from accumulated surplus | - | 312,508 | 312,508 | 100% under budget | - | 382,276 |
| Transfers from equity in capital assets | - | 3,087,648 | 3,087,648 | 100% under budget | - | 3,032,988 |
| Internal cost allocations | - | 523,163 | 523,163 | 100% under budget | - | 513,441 |
| Revenue Total | $ 11,742,903 | $ 23,055,059 | $ 11,312,156 | 49% under budget | $ 11,271,658 | $ 25,671,168 |
| Expense | ||||||
| General government services | 1,190,184 | 2,822,376 | 1,632,192 | 58% budget remaining | 1,890,143 | 3,874,033 |
| Protective services | 1,515,077 | 4,995,720 | 3,480,643 | 70% budget remaining | 1,468,693 | 5,098,361 |
| Transportation services | 965,166 | 4,067,439 | 3,102,273 | 76% budget remaining | 997,649 | 3,281,233 |
| Environmental health services | 501,295 | 2,541,128 | 2,039,833 | 80% budget remaining | 425,078 | 2,673,175 |
| Development services | 261,793 | 747,643 | 485,850 | 65% budget remaining | 276,699 | 789,877 |
| Parks services | 365,322 | 1,335,833 | 970,511 | 73% budget remaining | 420,025 | 1,279,625 |
| Recreation and culture services | 999,877 | 1,472,750 | 472,874 | 32% budget remaining | 820,892 | 1,306,032 |
| Interest on debt | 130,316 | 260,633 | 130,317 | 50% budget remaining | 130,316 | 260,633 |
| Principal payment on debt | 184,364 | 306,470 | 122,106 | 40% budget remaining | 184,364 | 306,470 |
| Amortization | - | 3,087,648 | 3,087,648 | 100% budget remaining | - | 3,032,988 |
| Internal cost allocations | - | 523,163 | 523,163 | 100% budget remaining | - | 513,441 |
| Transfers to reserves | 570,872 | 378,300 | (192,572) | 51% over budget | 37,500 | 712,300 |
| Transfers to reserve accounts | 900 | 515,956 | 515,056 | 100% budget remaining | 2,400 | 2,543,000 |
| Expense Total | 6,685,166 | 23,055,059 | 16,369,893 | 71% budget remaining | 6,653,759 | 25,671,168 |
| Grand Total | $ 5,057,738 | $ 0 | ($ 5,057,738) | $ 4,617,899 | $ 0 |
Page 46
Extracted from: 2021 07 13 Committee of the Whole Agenda - Agenda - Pdf