Presentation
Presentation: Budget Variance and Projects Update
July 13, 2021Pages 49–524 sections
Slide presentation introducing the new interactive budget variance dashboard.
July 13, 2021dchristenson@viewroyal.ca
Page 49–52
Budget Variance and Projects Update
Committee of the Whole
July 13, 2021
Page 49–52
Budget Variance and Projects Update
Traditional report
- Consolidated revenue and expense (operating, capital, all funds)
- Rows and columns of numbers
- High level, no detail
- Snapshot in time
- Single prior year comparative
- Limited project metrics (est. completion)
- Capital projects only
- Not typically made available directly on website
New dashboard
- Operating revenue and expense
- Charts and graphs
- Drilldown to next level of detail
- Updated frequently
- Up to four years comparative data
- More complete project metrics (% completion, comments, etc)
- Capital and non-core projects
- If supported, could be made available directly on Town's website
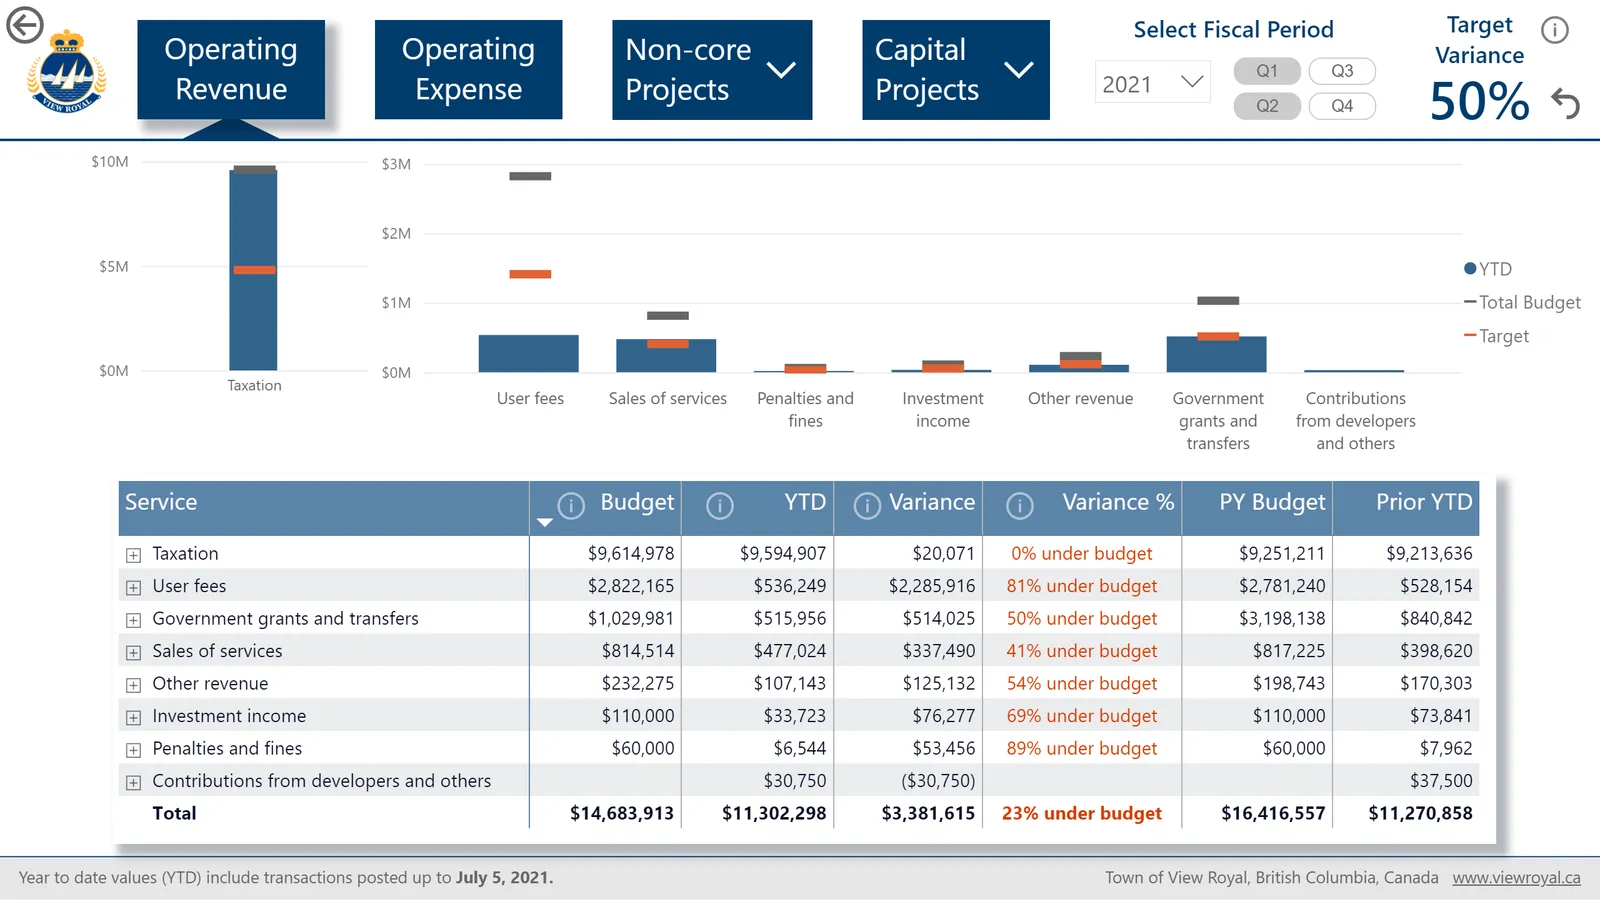
Select Fiscal Period: 2021, Q2
Target Variance: 50%
| Service | Budget | YTD | Variance | Variance % | PY Budget | Prior YTD |
|---|---|---|---|---|---|---|
| Taxation | $9,614,978 | $9,594,907 | $20,071 | 0% under budget | $9,251,211 | $9,213,636 |
| User fees | $2,822,165 | $536,249 | $2,285,916 | 81% under budget | $2,781,240 | $528,154 |
| Government grants and transfers | $1,029,981 | $515,956 | $514,025 | 50% under budget | $3,198,138 | $840,842 |
| Sales of services | $814,514 | $477,024 | $337,490 | 41% under budget | $817,225 | $398,620 |
| Other revenue | $232,275 | $107,143 | $125,132 | 54% under budget | $198,743 | $170,303 |
| Investment income | $110,000 | $33,723 | $76,277 | 69% under budget | $110,000 | $73,841 |
| Penalties and fines | $60,000 | $6,544 | $53,456 | 89% under budget | $60,000 | $7,962 |
| Contributions from developers and others | $30,750 | ($30,750) | $37,500 | |||
| Total | $14,683,913 | $11,302,298 | $3,381,615 | 23% under budget | $16,416,557 | $11,270,858 |
Year to date values (YTD) include transactions posted up to July 5, 2021.
Page 49–52
Thank you!
Link to dashboard is available through report on agenda, but won’t be publicized until it has been more thoroughly tested and Council has had a chance to explore it and provide comments.
Feedback:
Email dchristenson@viewroyal.ca
CC kanema@viewroyal.ca
Page 49–52
Extracted from: 2021 07 13 Committee of the Whole Agenda - Agenda - Pdf