Presentation: Community Climate Action Strategy
Presentation by the Community Energy Association on View Royal's climate strategy, GHG emissions, and reduction targets.
Town of View Royal
Community Climate Action Strategy
Presentation to Committee of the Whole September 14, 2021
Today’s Presentation
GOAL
Introduce the Project and receive your input on View Royal’s low carbon future.
- Introduce the Project
- What it is about
- Why we are doing it
- How View Royal can benefit
- What we will be doing
- Receive your initial guiding input
- Questions & Comments
- How ambitious would you like View Royal to be?
- Strengths, Weaknesses, Opportunities, Challenges?
First, some background
What is the difference Between Mitigation and Adaptation?
MITIGATION
- Reducing our contribution to climate changing emissions
ADAPTATION
- Reducing the risks and impacts related to climate change

What is the difference Between Mitigation and Adaptation?
But…
- Many actions do both
- And the best adaptation strategy is mitigation
What is the Community Climate Action Strategy?
A plan to:
- Leverage local government powers to…
- save residents and businesses…
- energy, emissions and money
One part of broader local government climate action:
- Corporate Energy and Emissions Plan
- Adaptation Plan
Will focus on mitigation, with a slant on adaptation
What are your Community GHG emissions? (DRAFT)
2018 % Splits by Sector
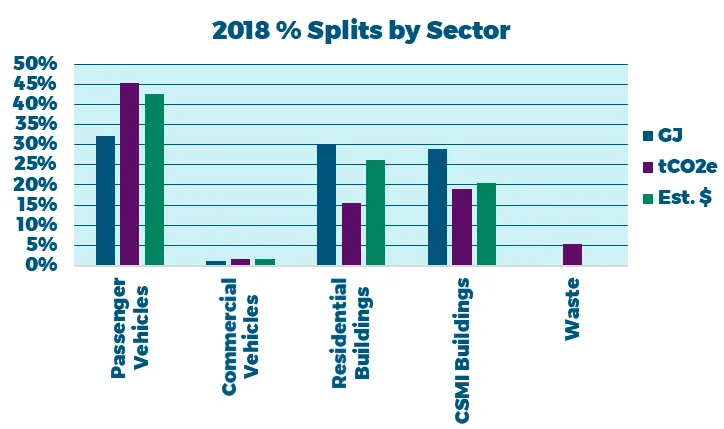
- 45,473 tCO2e
- 4.02 tCO2e/cap
- $25.9 M
- $2.3 k/cap
What are your Climate Impacts & Risks?
Be aware that:
- Year-round temperatures will rise.
- Dry spells in the summer will extend.
- Storm activity will become more frequent and intense, with higher winds and more precipitation falling during storm events.
- Sea levels will rise and will be subject to larger storm surge and wave effects, further increasing the risks of sea level rise.

Benefits of Mitigation Actions
Benefits of having a plan:
- Legislative requirement for GHG targets
- Climate Action Charter
- Funding
Benefits of implementing
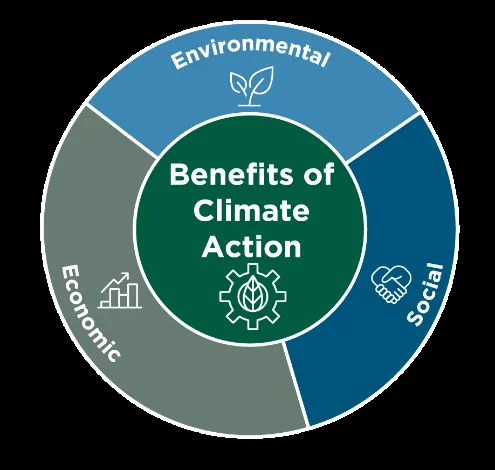
- Environmental: Natural Systems Restoration, Enhanced Green Spaces, Increased Tree Cover, Health & Air Quality
- Social: Increased Livability, Social Equity, Improved Resilience, Support Aging in Place
- Economic: Recirculate Savings in Local Economy, Economic Development & Job Creation, Sustainable Asset Management, Energy Resilience & Affordability
Legislation
From Bill 27 – 2008, Local Government (Green Communities) Statutes Amendment Act, 2008 :
20 Section 877 is amended by adding the following subsection: (3) An official community plan must include targets for the reduction of greenhouse gas emissions in the area covered by the plan, and policies and actions of the local government proposed with respect to achieving those targets.
Energy Expenditure Savings – Potential (DRAFT)
Community Energy Costs, 2018
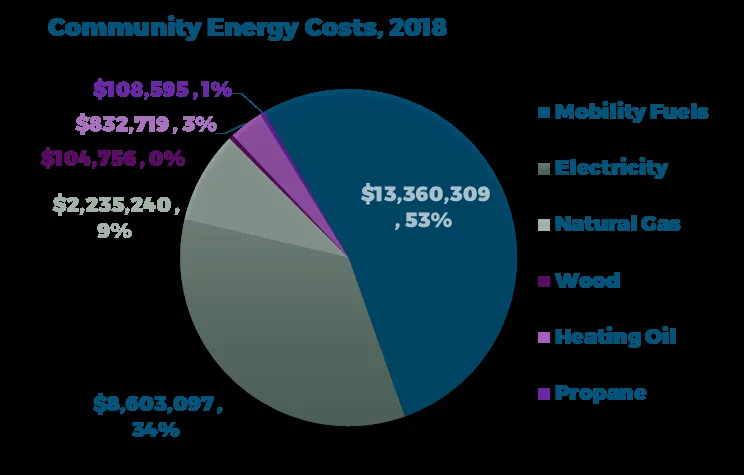
Mobility Fuels: $13,360,309, 53%
Electricity: $8,603,097, 34%
Natural Gas: $2,235,240, 9%
Wood: $832,719, 3%
Heating Oil: $108,595, 1%
Propane: $104,756, 0%
$25.9 M
$2.3 k/cap
Homing in on Health
- Linkages between climate action & health
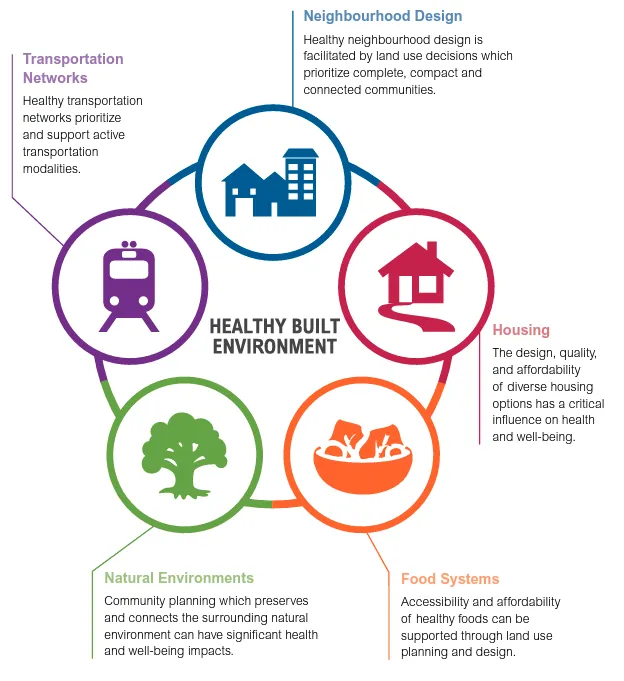
Source: BC Centre for Disease Control, Healthy Built Environment Linkages Toolkit
Homing in on Health
- Detailed example
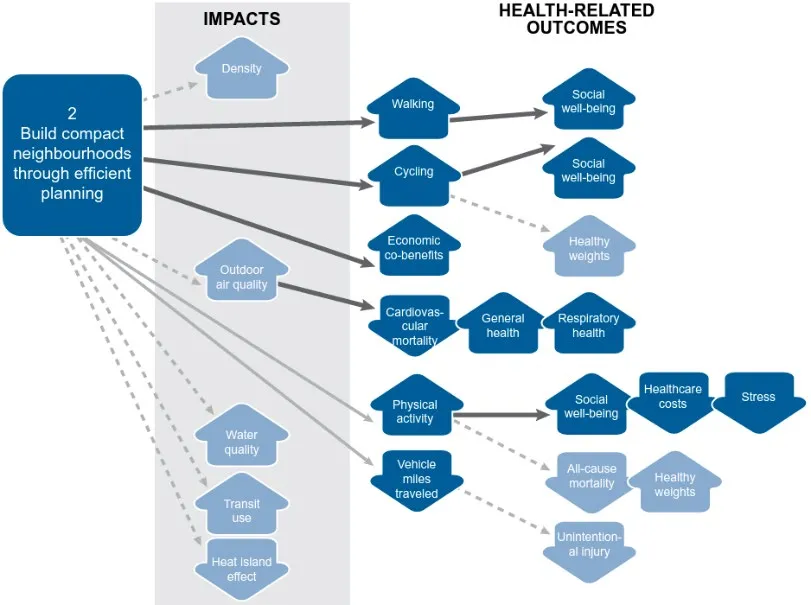
Source: BC Centre for Disease Control, Healthy Built Environment Linkages Toolkit
What’s in your Toolbox?
| Infrastructure | Policy & Regulation | Engagement & Collaboration |
|---|---|---|
 |
 |
 |
| Enable Choice | Shape Choice | Support Choice |
Federal and Provincial Action


Looking Ahead
cleanBC Timeline
- 2020: Investment: Heat pump & Insulation, Greener Homes Grant (Existing buildings)
- 2024: Retrofit Code (Existing buildings); 20% target (New buildings)
- 2025: 10% ZEV sales target
- 2030:
- 40% ZEV target
- 15% RNG target
- New buildings: 80% / Net Zero Ready
- 95% target (associated with leaf icon)
- 2040: 100% ZEV target
Vision of a Low-Carbon Future
THE CLIMATE LEADERS PLAYBOOK
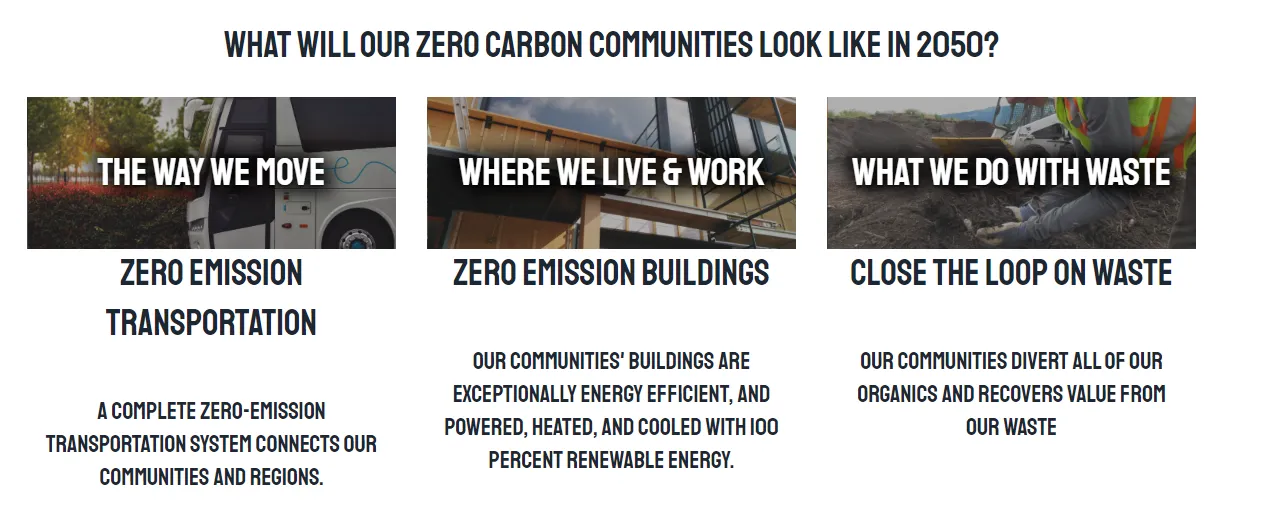
WHAT WILL OUR ZERO CARBON COMMUNITIES LOOK LIKE IN 2050?
- THE WAY WE MOVE: ZERO EMISSION TRANSPORTATION
- A complete zero-emission transportation system connects our communities and regions.
- WHERE WE LIVE & WORK: ZERO EMISSION BUILDINGS
- Our communities' buildings are exceptionally energy efficient, and powered, heated, and cooled with 100 percent renewable energy.
- WHAT WE DO WITH WASTE: CLOSE THE LOOP ON WASTE
- Our communities divert all of our organics and recovers value from our waste.
GHG Reduction Target
Targets At All Levels
Considering a GHG Emissions Reduction Target
- View Royal –
- Current OCP target: Achieve or exceed Provincial targets. 12% below 2007 levels by 2017, 33% by 2030
- Climate Emergency Declaration: Carbon neutrality by 2030
- CRD Target – 33% below 2007 levels by 2020, 61% by 2038. New target should be publicly released September 24th
- Provincial Target - 80% reduction from 2007 levels by 2050. Most communities in BC currently follow the Provincial target, but many have interim targets as well.
- Federal Target - 30% reduction below 2005 levels by 2030, and a plan to work towards net-zero emissions by 2050.
- Global 1.5°C Target (IPCC) – 45% reduction from 2010 levels by 2030, and a 100% reduction by 2050.

Project Quick Summary
What Will We Be Doing?
- Analysis of GHG emissions – inventory & modelling work
- Actions prioritization
- Consultation & input
- 2 staff & stakeholder workshops
- 2 public surveys
- Presentations to Committee of the Whole
- Actions & targets decisions
- Plan writing
- Additional tools
- Residents’ online resource content
- Personal GHG calculator content
All wrapped up by early 2022
Initial Guiding Input
Your Thoughts
- Questions & Comments
- How ambitious would you like View Royal to be?
- What Strengths, Weaknesses, Opportunities, and Challenges do you foresee?