Portage Park Residences Traffic Impact Assessment
A technical report (Attachment 7 to the rezoning application) evaluating traffic patterns, trip generation, and intersection levels of service for a proposed 87-unit multi-family development.
- Island Highway is an undivided two-lane major collector road that widens to three lanes (including a center two way left turn lane) near the development site. Island Highway has bike lanes and sidewalks on both sides of the road. Island Highway runs generally east-west and has a posted speed limit of 50 km/h.
- View Royal Avenue is an undivided two-lane collector road. View Royal Avenue generally runs east-west but bends to a north-south alignment near the Island Highway intersection; for the purposes of this TIA, View Royal Avenue is considered to run north-south. There are no sidewalks, bike lanes, or marked shoulders on View Royal Avenue except for a short section of sidewalk on the southeast corner of the Island Highway intersection. The posted speed limit on View Royal Avenue is 30 km/h.
- Helmcken Road is an undivided two-lane road that is classified as a major collector road north of Island Highway and a collector road south of Island Highway. Helmcken Road provides a connection between Highway 1 and Island Highway. Helmcken Road is considered to run north-south. There are sidewalks and bike lanes on both sides of Helmcken Road. The posted speed limit on Helmcken Road is 40 km/h north of Island Highway and 30 km/h south of Island Highway.
Two (2) key intersections were identified within the study area:
- Island Highway / View Royal Avenue is a three-legged signalized intersection. There are separate westbound and northbound left turn lanes and crosswalks across the south and west leg. The westbound left turn phase is protected / permitted.
- Island Highway / Helmcken Road is a four-legged signalized intersection. There are separate north-, east-, and west-bound left and right turn lanes and a southbound left turn lane. The westbound right turn lane is channelized (yield controlled). The southbound and eastbound left turn phases are protected / permitted.
Both intersections, as well as the Island Highway / Stormont Rd intersection, operate in coordination. The Island Highway / Stormont Rd intersection was excluded from the study as the development will add less than 20 vph to the eastbound and westbound through movements only.
2.3 TRAFFIC MODELLING – BACKGROUND INFORMATION
Analysis of the traffic conditions at the study intersections was undertaken using Synchro Studio (Version 11) and SIDRA (Version 8). Synchro / SimTraffic is a two-part traffic modelling software that provides analysis of the traffic conditions based on the Highway Capacity Manual (2010) evaluation methodology. A detailed description is provided in Appendix A.
For the signalized and stop controlled intersections, Synchro is used to determine the LOS and delays of each intersection while SIDRA is used for the LOS and delay of roundabouts. SimTraffic was used to determine the 95th percentile queue lengths for signalized / unsignalized intersections analyzed in Synchro. The LOS are broken down into six letter grades, with LOS A being excellent operations and LOS F being unstable / failure operations. LOS C is typically considered acceptable, while LOS D is generally considered to be on the threshold between acceptable and unacceptable operations.
2.4 EXISTING TRAFFIC CONDITIONS (2021)
2.4.1 DATA COLLECTION
AM and PM peak hour (8-9AM and 4-5PM respectively) traffic counts were conducted at the study intersections on June 24, 2021. The resulting volumes are shown in Figure 2.
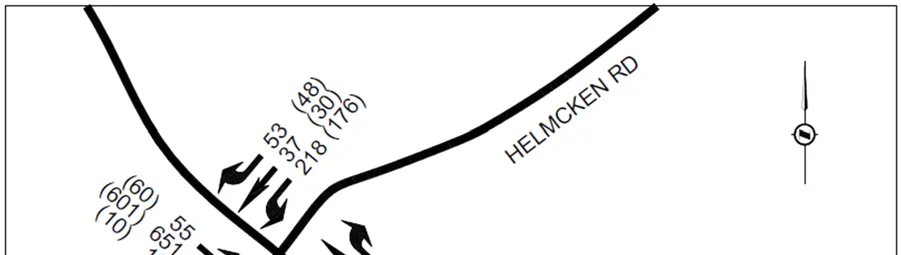
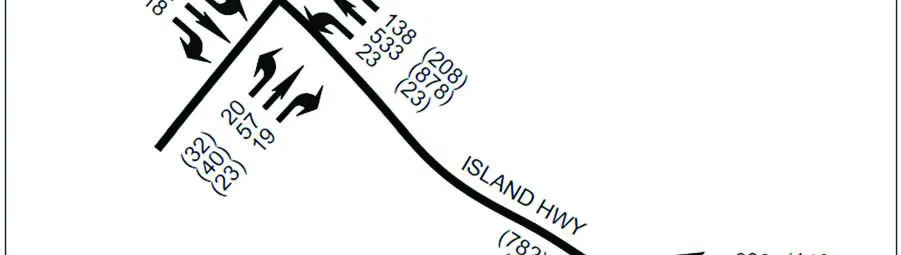
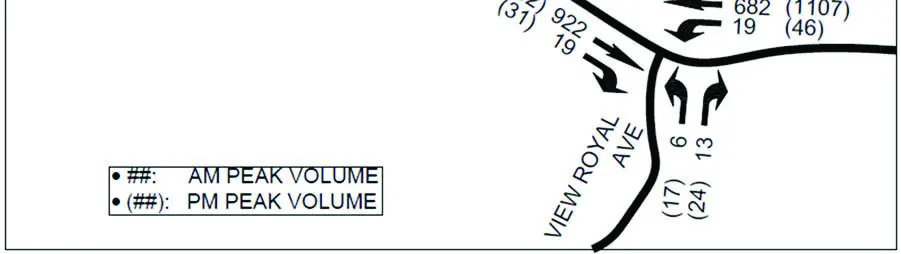
Figure 2: 2021 Existing Volumes
2.4.2 ANALYSIS RESULTS
The existing 2021 volumes were analyzed in Synchro / SimTraffic software to determine the existing 2021 conditions during the AM and PM peak hours, using the existing signal timings for each intersection. The analysis results are summarized in Table 1.
TABLE 1: 2021 EXISTING CONDITIONS
| Intersection (EW / NS) | Movement | AM Peak LOS | AM Peak Delay (s) | AM Peak 95th % Queue (m) | PM Peak LOS | PM Peak Delay (s) | PM Peak 95th % Queue (m) |
|---|---|---|---|---|---|---|---|
| Island Highway / Helmcken Road | EBL | A | 9.0 | 30.4 | A | 8.0 | 25.2 |
| EBT | B | 15.7 | 99.4 | B | 10.2 | 79.2 | |
| EBR | A | 0.1 | 16.5 | A | 0.0 | 5.9 | |
| WBL | B | 16.7 | 14.8 | B | 11.1 | 22.7 | |
| WBT | C | 28.0 | 97.7 | C | 22.5 | 251.5 | |
| WBR | A | 2.9 | 36.4 | A | 6.8 | 39.9 | |
| NBL | C | 33.0 | 14.5 | E | 62.2 | 19.9 | |
| NBT | C | 30.7 | 24.6 | D | 54.3 | 28.2 | |
| NBR | A | 0.4 | 12.2 | A | 1.3 | 14.9 | |
| SBL | D | 43.5 | 37.1 | F | 95.9 | 37.0 | |
| SB T/R | B | 10.6 | 75.2 | C | 22.4 | 79.4 | |
| Island Highway / View Royal Avenue | EB T/R | E | 57.5 | 105.9 | B | 10.3 | 72.3 |
| WBL | A | 4.9 | 16.9 | A | 3.2 | 21.4 | |
| WBT | B | 16.4 | 66.6 | C | 28.3 | 104.8 | |
| NBL | B | 18.5 | 5.9 | D | 49.2 | 15.4 | |
| NBR | A | 9.5 | 10.9 | B | 17.0 | 13.5 |
At the Island Highway / View Royal Avenue intersection, under existing 2021 traffic volumes the eastbound through / right turn movement is at a LOS E during the AM peak hour. The remaining movements are at LOS A/B in the AM peak and LOS D or better in the PM peak.
At the Island Highway / Helmcken Road intersection, the intersection operates well in the AM peak hour with all movements at LOS C or better except the southbound left turn movement (LOS D). However, in the PM peak hour, the northbound and southbound left turn movements are at LOS E and F respectively.
For both intersections, adjusting the signal timing while maintaining the cycle length for coordination did not improve the poor movements. Optimizing the cycle length, at each intersection, improved all movements to LOS D or better during both peak hours. However, This would remove the signals from coordination and reduce the continuous flow of traffic on Island Highway which is not ideal during the peak periods.
3.0 POST DEVELOPMENT
3.1 PROPOSED LAND USE
The proposed development is a 5 storey multi-family residential building containing 87 residential units. The development will include underground parking and will be accessed via a single access on Island Highway. The site plan is shown below in Figure 3.
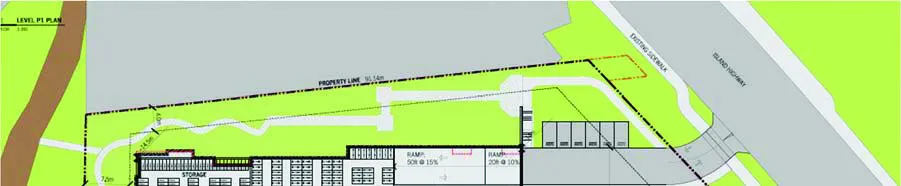
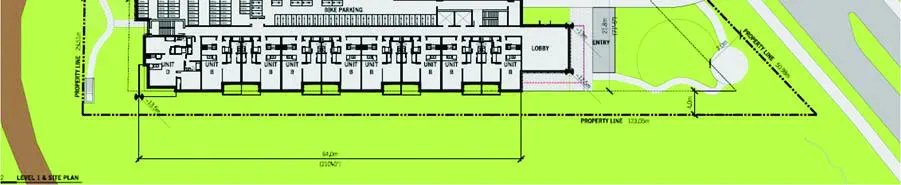
Figure 3: Development Site Plan
3.2 TRIP GENERATION
The number of site trips expected to be generated from the proposed development was calculated using the Institute of Transportation Engineers’ (ITE) Trip Generation Manual (10th Edition). The Trip Generation Manual provides trip rates for a wide variety of land uses gathered from actual sites across North America over the past 35 years.
The results of the trip generation are summarized in Table 2. The development is expected to generate 31 trips (8 inbound / 23 outbound) during the AM peak hour and 38 trips (23 inbound / 15 outbound) during the PM peak hour.
TABLE 2: TRIP GENERATION SUMMARY – AM AND PM PEAK HOUR
| ITE Code | Land Use | Units | Trip Rate | Trips In | Trips Out | Total Trips |
|---|---|---|---|---|---|---|
| AM Peak Hour | ||||||
| 221 | Multifamily Housing (Mid-Rise) | 87 Units | 0.36 / unit | 8 | 23 | 31 |
| Total (AM Peak): | 8 | 23 | 31 | |||
| PM Peak Hour | ||||||
| 221 | Multifamily Housing (Mid-Rise) | 87 Units | 0.44 / unit | 23 | 15 | 38 |
| Total (PM Peak): | 23 | 15 | 38 |
3.3 TRIP ASSIGNMENT
The trip assignment for the primary trips were based on the existing traffic patterns and the key origins and destinations for traffic in the area. The trips generated by the development during the AM and PM peak hours were assigned based on the following distribution ratios:
Inbound Trips (AM and PM):
- 50% of inbound trips come from the east via Island Highway;
- 20% of inbound trips come from the west via Helmcken Road to Island Highway; and
- 30% of inbound trips come from the west via Island Highway.
Outbound Trips (AM and PM):
- 60% of outbound trips are heading to the east via Island Highway;
- 15% of outbound trips are heading to the west and north via Island Highway to Helmcken Road; and
- 25% of outbound trips are heading to the west via Island Highway.
The resulting trip assignment is shown in Figure 4.
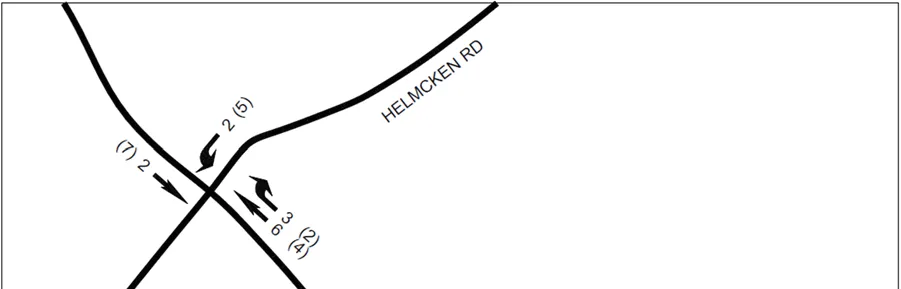
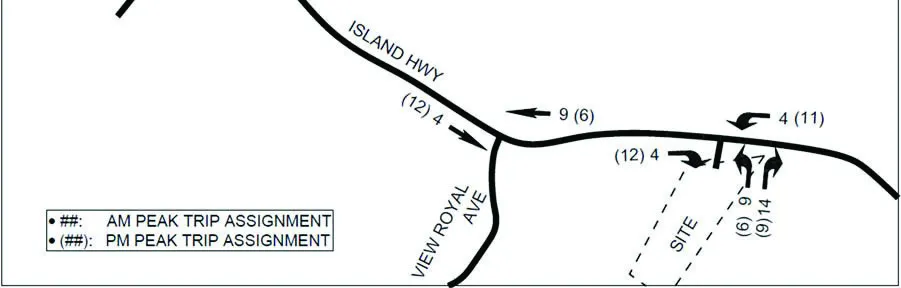
Figure 4: Trip Assignment
3.4 POST DEVELOPMENT CONDITIONS
The 2021 post development volumes were determined by adding the site trips (shown in Figure 4) to the existing volumes (shown in Figure 2). The resulting post development volumes were analyzed in Synchro / SimTraffic to determine the 2021 post development conditions. The 2021 post development volumes are shown in Figure 5 and the analysis results are summarized in Table 3.
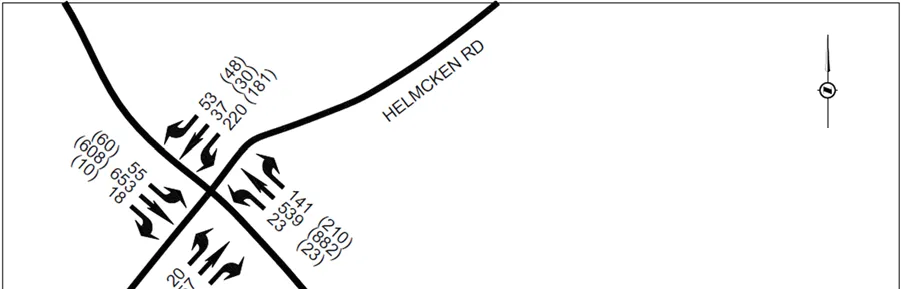
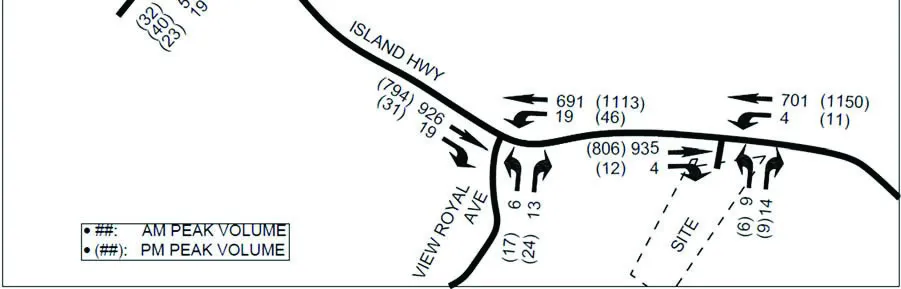
Figure 5: 2021 Post Development Volumes
TABLE 3: 2021 POST DEVELOPMENT CONDITIONS
| Intersection (EW / NS) | Movement | AM Peak LOS | AM Peak Delay (s) | AM Peak 95th % Queue (m) | PM Peak LOS | PM Peak Delay (s) | PM Peak 95th % Queue (m) |
|---|---|---|---|---|---|---|---|
| Island Highway / Helmcken Road | EBL | A | 9.1 | 24.8 | A | 8.0 | 27.9 |
| EBT | B | 15.8 | 85.6 | B | 10.3 | 75.4 | |
| EBR | A | 0.1 | 11.9 | A | 0.0 | 8.3 | |
| WBL | B | 16.7 | 21.0 | B | 11.1 | 21.8 | |
| WBT | C | 28.4 | 98.8 | C | 22.6 | 229.1 | |
| WBR | A | 3.1 | 36.6 | A | 6.9 | 39.8 | |
| NBL | C | 33.0 | 14.7 | E | 62.2 | 18.4 | |
| NBT | C | 30.7 | 24.6 | D | 54.3 | 26.5 | |
| NBR | A | 0.4 | 11.6 | A | 1.3 | 12.8 | |
| SBL | D | 44.3 | 36.5 | F | 102.6 | 37.6 | |
| SB T/R | B | 10.6 | 68.6 | C | 22.4 | 106.6 | |
| Island Highway / View Royal Avenue | EB T/R | E | 59.1 | 101.9 | B | 10.5 | 64.9 |
| WBL | A | 4.9 | 18.2 | A | 3.3 | 21.9 | |
| WBT | B | 17.0 | 70.3 | C | 29.4 | 94.8 | |
| NBL | B | 18.5 | 9.2 | D | 49.2 | 14.3 | |
| NBR | A | 9.5 | 10.7 | B | 17.0 | 12.6 | |
| Island Highway / Site Access | EB T/R | A | 0.0 | 0.9 | A | 0.0 | 0.0 |
| WBL | B | 10.3 | 5.6 | A | 9.8 | 8.3 | |
| WBT | A | 0.1 | 2.5 | A | 0.1 | 23.0 | |
| NB L/R | D | 33.3 | 5.6 | E | 47.9 | 7.4 |
The addition of site traffic does not impact the operations of either the Island Highway / Helmcken Road or Island Highway / View Royal Avenue intersections. Under 2021 post development conditions, the levels of service are unchanged from existing conditions.
The site access operates at LOS D in the AM peak and LOS E in the PM peak. Due to the limited gaps in Island Highway, left turning vehicles may have to wait some time to find a gap; however, as the 95th percentile queues are less than one vehicle in length, vehicles waiting to turn left are not blocking other drivers. Alternatively, left turning vehicles can choose to turn right and take an alternate route to their destination.
4.0 LONG TERM CONDITIONS (2031)
4.1 2031 BACKGROUND CONDITIONS
The 2031 background volumes were determined by applying an annual growth rate to the existing 2021 volumes. Based on historical volumes from between 2007 and 2019 (from the CRD traffic data website), traffic volumes have remained stagnant or declined on Island Highway. The Island Highway volumes have not been increasing due to the corridor and adjacent major intersections being at / near capacity during the peak periods. As such, the existing Island Highway through volumes were used for 2031 volumes. For the other roads in the study area, a conservative annual growth rate of 2% was applied. The resulting 2031 background volumes were then analyzed in Synchro / SimTraffic software to determine the long term background conditions. The 2031 background volumes are shown in Figure 6 and the analysis results are summarized in Table 4.
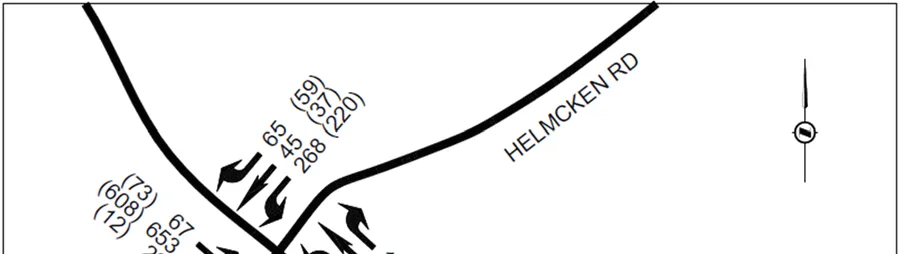
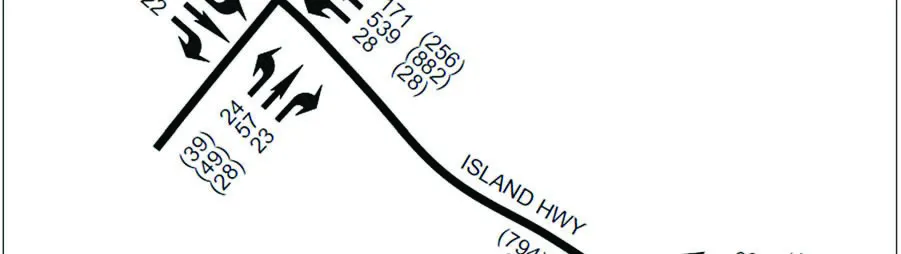
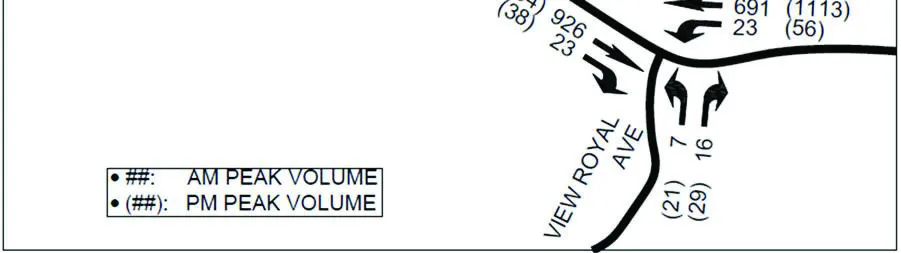
Figure 6: 2031 Background AM and PM Peak Hour Volumes
TABLE 4: 2031 BACKGROUND CONDITIONS
| Intersection (EW / NS) | Movement | AM Peak LOS | AM Peak Delay (s) | AM Peak 95th % Queue (m) | PM Peak LOS | PM Peak Delay (s) | PM Peak 95th % Queue (m) |
|---|---|---|---|---|---|---|---|
| Island Highway / Helmcken Road | EBL | A | 9.9 | 28.3 | A | 9.9 | 28.9 |
| EBT | B | 16.5 | 107.1 | B | 10.7 | 84.7 | |
| EBR | A | 0.1 | 16.2 | A | 0.0 | 7.7 | |
| WBL | B | 18.1 | 22.1 | B | 11.7 | 26.4 | |
| WBT | C | 30.0 | 103.1 | C | 24.6 | 375.8 | |
| WBR | A | 4.5 | 39.3 | A | 8.3 | 44.5 | |
| NBL | C | 33.9 | 17.0 | E | 63.9 | 23.2 | |
| NBT | C | 30.9 | 22.4 | D | 54.2 | 27.6 | |
| NBR | A | 0.5 | 11.3 | A | 1.5 | 16.9 | |
| SBL | E | 69.9 | 36.6 | F | 140.0 | 37.4 | |
| SB T/R | B | 10.4 | 109.2 | C | 25.3 | 183.0 | |
| Island Highway / View Royal Avenue | EB T/R | E | 60.0 | 101.6 | B | 11.0 | 68.3 |
| WBL | A | 5.2 | 18.0 | A | 3.7 | 22.0 | |
| WBT | B | 16.4 | 70.9 | C | 28.3 | 107.8 | |
| NBL | B | 18.4 | 7.1 | D | 50.0 | 17.5 | |
| NBR | A | 9.1 | 11.9 | B | 16.2 | 13.6 |
Under 2031 background conditions, at the Island Highway / Helmcken Road intersection the southbound left turn movement drops to LOS E in the AM peak hour. The northbound and southbound left turns operate at a LOS E/F in the PM.
At the Island Highway / View Royal intersection, the eastbound through / right movement at LOS E in the AM and all other movements at LOS D or better (most at LOS A/B) during both peak hours.
4.2 2031 POST DEVELOPMENT CONDITIONS
The 2031 post development volumes were determined by adding the site trips to the 2031 background volumes. The 2031 post development volumes were then analyzed in Synchro / SimTraffic software to determine the long-term post development conditions at the study intersections. The 2031 post development volumes are shown in Figure 7 and the analysis results are summarized in Table 5.
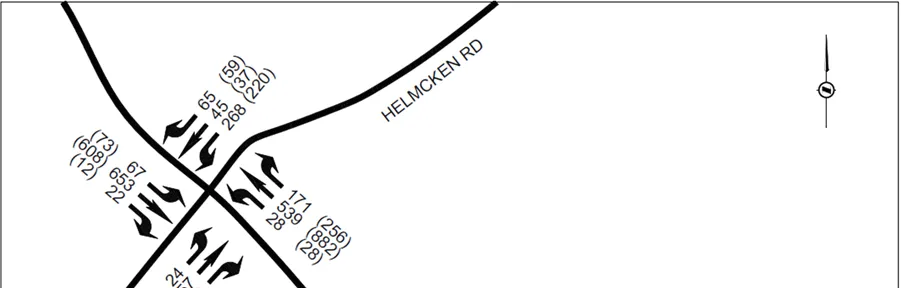
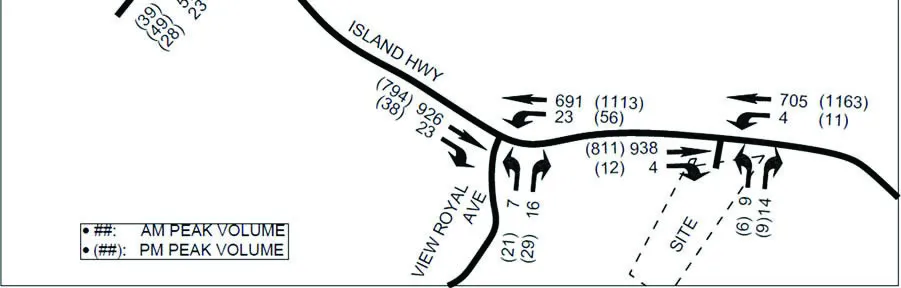
Figure 7: 2031 Post Development Volumes
TABLE 5: 2031 POST DEVELOPMENT CONDITIONS
| Intersection (EW / NS) | Movement | AM Peak LOS | AM Peak Delay (s) | AM Peak 95th % Queue (m) | PM Peak LOS | PM Peak Delay (s) | PM Peak 95th % Queue (m) |
|---|---|---|---|---|---|---|---|
| Island Highway / Helmcken Road | EBL | A | 10.0 | 31.9 | B | 10.2 | 31.8 |
| EBT | B | 16.5 | 92.8 | B | 10.9 | 78.0 | |
| EBR | A | 0.1 | 10.9 | A | 0.0 | 7.0 | |
| WBL | B | 18.2 | 26.3 | B | 11.8 | 28.7 | |
| WBT | C | 30.4 | 102.0 | C | 24.9 | 312.5 | |
| WBR | A | 4.7 | 39.9 | A | 8.4 | 42.4 | |
| NBL | C | 33.9 | 15.0 | E | 63.5 | 23.2 | |
| NBT | C | 30.9 | 22.7 | D | 54.0 | 32.2 | |
| NBR | A | 0.5 | 14.2 | A | 1.5 | 15.9 | |
| SBL | E | 71.5 | 36.4 | F | 146.8 | 34.5 | |
| SB T/R | B | 10.4 | 108.3 | C | 25.2 | 147.1 | |
| Island Highway / View Royal Avenue | EB T/R | E | 61.6 | 104.2 | B | 11.3 | 75.0 |
| WBL | A | 5.2 | 19.0 | A | 3.8 | 21.1 | |
| WBT | B | 17.0 | 66.8 | C | 29.4 | 97.4 | |
| NBL | B | 18.4 | 7.1 | D | 50.0 | 18.6 | |
| NBR | A | 9.1 | 11.5 | B | 16.2 | 14.4 | |
| Island Highway / Site Access | EB T/R | A | 0.0 | 0.0 | A | 0.0 | 0.9 |
| WBL | B | 10.3 | 5.2 | A | 9.8 | 8.0 | |
| WBT | A | 0.0 | 2.9 | A | 0.1 | 16.2 | |
| NB L/R | D | 33.5 | 6.6 | E | 48.4 | 5.4 |
The addition of site traffic does not impact the long-term operations of either the Island Highway / Helmcken Road or Island Highway / View Royal Avenue intersections. Under 2031 post development conditions, the levels of service are unchanged from 2031 background conditions (with the exception of the Island Highway / Helmcken Road eastbound left turn which drops from LOS A to B).
The site access operates at LOS D in the AM peak and LOS E in the PM peak. Due to the limited gaps in Island Highway, left turning vehicles may have to wait some time to find a gap; however, as the 95th percentile queues are less than one vehicle in length, vehicles waiting to turn left are not blocking other drivers. Alternatively, left turning vehicles can choose to turn right and take an alternate route to their destination.
5.0 ACCESS REVIEW
The development is proposed to be accessed by a single access off Island Highway. The TAC Geometric Design Guide for Canadian Roads (2017) suggests a minimum corner clearance distance of 55m from a signalized intersection for an access on a collector road (Figure 8.8.2). The access will be located 130m east of View Royal Avenue, which exceeds the suggested minimum distance.
The TAC Geometric Design Guide also suggests a minimum sight distance for a right turn (looking to the left) of 95m and for a left turn (looking to the right) of 105m for a 50km/h road (TAC Table 9.9.4 / 9.9.6). The proposed access has a sight distance to the west (looking left from the access) of 130m and a sight distance to the east (looking right from the access) of 170m; therefore, the sight distances at the access exceed the TAC suggested minimums.
5.1 TWO-WAY LEFT TURN LANE
At the site access location on Island Highway, there is a 45m section of two-way left turn lane (TWLTL) with median islands at either end (see Figure 8). The proposed access is located approximately at the mid-point of the TWLTL and is the only access on the south side of the road adjacent to the TWLTL. There is one driveway on the north side of Island Highway at the east end of the TWLTL; this driveway provides access to eight single family homes.
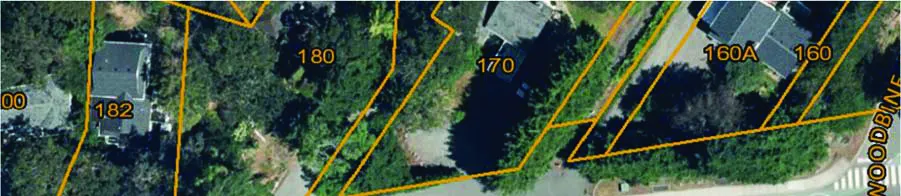
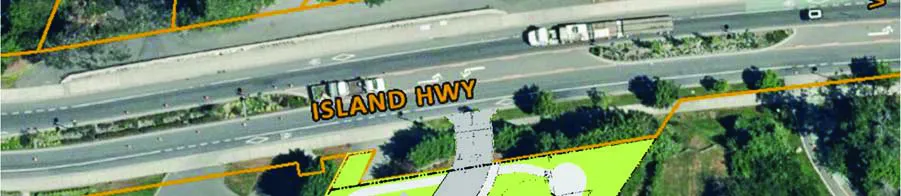
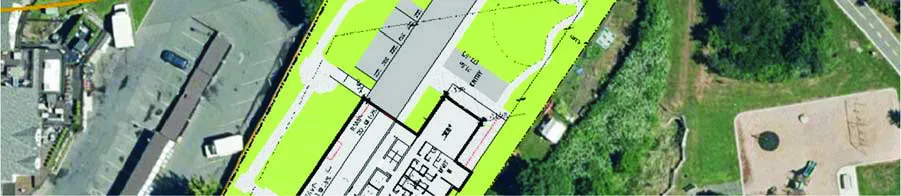
Figure 8: Proposed Access Location and Two-Way Left Turn Lane
As the south access is approximately 10m west of the north access, the accesses are considered to be negatively offset. This creates the potential for conflict between eastbound and westbound left turning vehicles within the TWLTL. However, the volume of vehicles using the TWLTL, in either direction, is very low. (North driveway is estimated to have 3 to 4 vph and this south site driveway 11 vph). Due to the low volumes, the frequency of opposing vehicles attempting to use the TWLTL at the same time will be very low and therefore limits the potential for actual conflicts in the two way left turn lane.
6.0 ALTERNATIVE TRANSPORTATION MODES
6.1 PEDESTRIANS / CYCLISTS
There are existing sidewalks on both sides of Island Highway which provide a connection to the wider View Royal pedestrian network. There is a crosswalk across Island Highway located at the View Royal Avenue intersection, 135m to the west. There is also a pedestrian overpass across Island Highway 200m east of the site.
There are painted bike lanes on both sides of Island Highway for the entire length of the road.
The E&N Rail Trail multi-use pathway is located 85m east of the site which provides pedestrians and cyclists with a connection to Esquimalt and Victoria to the east and Colwood and Langford to the west. There are existing paths through Portage Park which provide access to the E&N trail, including a pathway that starts at Island Highway 20m east of the development site and another pathway that runs along the south property boundary. A connection to the path on the south property boundary is recommended to provide pedestrian and cyclist access to the E&N Rail Trail.
6.2 TRANSIT
The nearest transit stops are located 200m east of the site, at the pedestrian overpass across Island Highway. These stops are serviced by BC Transit Route #14 (Vic General / UVic) and #46 (Dockyard / Westhills). Route #14 runs between Victoria General Hospital and the University of Victoria and runs every 15 to 20 minutes throughout the day. Route #46 runs between the Westhills Transit Exchange in Langford and the Esquimalt Navy base and runs every hour between 6AM and 6PM, with the frequency increasing to every 30 minutes during the AM and PM peak hours.
7.0 CONCLUSION
Under existing conditions, during the AM peak hour the Island Highway / View Royal Avenue intersection eastbound through / right turn movement operates at LOS E; during the PM peak hour the northbound and southbound left turn movements operate at a poor condition. Optimizing the signal timing (including the cycle lengths) at each individual intersection improves both intersection operations to LOS D or better for all movements during both peak hours; however, this would remove the signals from coordination and may increase the amount of stop and go traffic on Island Highway during the peak periods.
At opening day, the development will generate 31 trips in the AM peak and 38 trips in the PM peak. Under 2021 post development conditions, the addition of site traffic does not impact the operations of the study intersections, with the LOS of all movements unchanged from background operations.
In the long term 10-year post development horizon (2031), under background conditions the Island Highway / Helmcken Road intersection southbound left turn movement drops to LOS E in the AM peak hour. At the Island Highway / View Royal Avenue intersection, under 2031 background conditions the levels of service of all movements are unchanged from 2021. Under 2031 post development conditions, the addition of site traffic does not impact the study intersections, with the LOS of all movements unchanged (expect for the Island Highway / Helmcken Road eastbound left turn, which drops from LOS A to B) from 2031 background conditions.
The proposed site access on Island Highway operates at LOS D in the AM peak hour, and LOS E in the PM peak hour, the 95th percentile queue is one vehicle in length. The spacing and sightline distances for the intersection exceed the minimum distances suggested by TAC. Conflicts within the two way left turn at the site access with the opposing driveway are expected to be very limited.
There are existing sidewalks and bike lanes on Island Highway; no additional pedestrian or cyclist facilities are recommended on Island Highway. A connection to the multi-use pathway on the south property boundary is recommended to provide access to the E&N Rail Trail. Transit stops are located 200m east of the site; no upgrades to the transit infrastructure are recommended.
7.1 RECOMMENDATIONS
The following recommendations are made regarding the proposed Island Highway development:
- Provide a pedestrian / cyclist connection to the multi-use pathway on the south property boundary, to provide access to the E&N Rail Trail.